University of Vermont
ScholarWorks @ UVM
Northwest Crops & Soils Program
UVM Extension
2016
Cool Season Annual Forage Mixtures Trial
Heather Darby
University of Vermont, heather.darby@uvm.edu
Sara Ziegler
University of VermontNate Brigham
University of VermontJulija Cubins
University of VermontAbha Gupta
University of VermontFollow this and additional works at:
https://scholarworks.uvm.edu/nwcsp
Part of the
Agricultural Economics Commons
This Report is brought to you for free and open access by the UVM Extension at ScholarWorks @ UVM. It has been accepted for inclusion in Northwest Crops & Soils Program by an authorized administrator of ScholarWorks @ UVM. For more information, please contact
donna.omalley@uvm.edu.
Recommended Citation
Darby, Heather; Ziegler, Sara; Brigham, Nate; Cubins, Julija; and Gupta, Abha, "Cool Season Annual Forage Mixtures Trial" (2016). Northwest Crops & Soils Program. 17.
© March 2017, University of Vermont Extension
2016 Cool Season Annual
Forage Mixtures Trial
Dr. Heather Darby, UVM Extension Agronomist
Sara Ziegler, Nate Brigham, Julija Cubins, and Abha Gupta
UVM Extension Crops and Soils Technicians
(802) 524-6501
2016 COOL SEASON ANNUAL FORAGE MIXTURES TRIAL Dr. Heather Darby, University of Vermont Extension
heather.darby[at]uvm.edu
In 2016, the University of Vermont Extension Northwest Crops and Soils Program evaluated yield and quality of cool season annuals and mixtures of these annuals at Borderview Research Farm in Alburgh, VT. In the Northeast, cool season perennial grasses dominate the pastures and hay meadows farmers rely on throughout the season. Often times during the fall months, the perennial pasture will decline in yield and quality. Addition of cool season annual forages into the grazing system during this time may help improve the quality and quantity of forage and potentially extend the grazing season. Recently, there has been a growing interest in utilizing multiple cool season forage species to maximize yield and quality. We compared seven varieties of five annual species alone and in three-and four-species mixtures to evaluate potential differences in forage production and quality. While the information presented can begin to describe the yield and quality performance of these forage mixtures in this region, it is important to note that the data represent results from only one season and one location.
MATERIALS AND METHODS
In 2016, 12 cool season annual forages alone and in mixtures were evaluated at Borderview Research Farm in Alburgh, VT (Table 1). The plot design was a randomized complete block with four replications. Forage species and mixture information, as well as seeding rates (lbs ac-1), are summarized in Table 2. Due to land constraints, the mixtures were composed using only one variety of oats and triticale even though two varieties were trialed as monocultures.
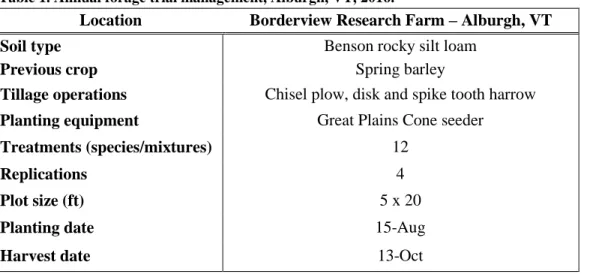
Table 1. Annual forage trial management, Alburgh, VT, 2016.
Location Borderview Research Farm – Alburgh, VT Soil type Benson rocky silt loam
Previous crop Spring barley
Tillage operations Chisel plow, disk and spike tooth harrow
Planting equipment Great Plains Cone seeder
Treatments (species/mixtures) 12
Replications 4
Plot size (ft) 5 x 20
Planting date 15-Aug
Harvest date 13-Oct
The soil type at the Alburgh location was a Benson rocky silt loam (Table 2). The seedbed was chisel plowed, disked, and finished with a spike tooth harrow. The previous crop was spring barley. Plots were 5’ x 20’and replicated 4 times. The trial was planted with a cone seeder on 15-Aug. Plots were hand harvested on 13-Oct by cutting material growing within a 0.25m2 area.
Table 2. Forage mixture composition and seeding rates, 2016.
Abbreviation Variety and Species Seeding rate Alone In mixture O/P/T Everleaf Oats 125 75 Lynx Peas 60 60 Appin Turnip 6 5 Tr/P/T 815 Triticale 125 75 Lynx Peas 60 60 Appin Turnip 6 5 Rye/P/T Kodiak Ryegrass 30 30 Lynx Peas 60 30 Appin Turnip 6 5 Tr/O/P/T 815 Triticale 125 50 Everleaf Oats 125 50 Lynx Peas 60 50 Appin Turnip 6 5 Tr/Rye/P/T 815 Triticale 125 60 Kodiak Ryegrass 30 20 Lynx Peas 60 30 Appin Turnip 6 5
Forage Maker 50 Oats 125
-Bolt Triticale 125
-An approximate 1 lb subsample of the harvested material was collected, dried, ground, and then analyzed at the University of Vermont’s Testing Laboratory, Burlington, VT, for forage quality. Dry matter yields were calculated.
Forage quality was analyzed using the FOSS NIRS (near infrared reflectance spectroscopy) DS2500 Feed and Forage analyzer. Dried and coarsely-ground plot samples were brought to the lab where they were reground using a cyclone sample mill (1mm screen) from the UDY Corporation. The samples were then analyzed using the FOSS NIRS DS2500 for crude protein (CP), acid detergent fiber (ADF), neutral detergent fiber (NDF), 48-hour digestible NDF (NDFD), and total digestible nutrients (TDN).
Mixtures of true proteins, composed of amino acids, and non-protein nitrogen make up the CP content of forages. The CP content of forages is determined by measuring the amount of nitrogen and multiplying by 6.25. The bulky characteristics of forage come from fiber. Forage feeding values are negatively associated with fiber since the less digestible portions of plants are contained in the fiber fraction. The detergent fiber analysis system separates forages into two parts: cell contents, which include sugars, starches, proteins, non-protein nitrogen, fats and other highly digestible compounds; and the less digestible components found in the fiber fraction. The total fiber content of forage is contained in the neutral detergent fiber (NDF). Chemically, this fraction includes cellulose, hemicellulose, and lignin. Because of these chemical
components and their association with the bulkiness of feeds, NDF is closely related to feed intake and rumen fill in cows.
Yield data and stand characteristics were analyzed using mixed model analysis using the mixed procedure of SAS (SAS Institute, 1999). Replications within trials were treated as random effects, and mixtures were treated as fixed. Treatment mean comparisons were made using the Least Significant Difference (LSD) procedure when the F-test was considered significant (p<0.10).
Variations in yield and quality can occur because of variations in genetics, soil, and other growing conditions. Statistical analysis makes it possible to determine whether a difference among hybrids is real or whether it might have occurred due to other variations in the field. At the bottom of each table a LSD value is presented for each variable (i.e. yield). Least Significant Differences
(LSDs) at the 0.10 level of significance are shown. Where the difference between two hybrids within a column is equal to or greater than the LSD value at the bottom of the column, you can be sure that for 9 out of 10 times, there is a real difference between the two hybrids. Hybrids that were not significantly lower in performance than the highest hybrid in a particular column are
indicated with an asterisk. In this example, hybrid C is significantly different from hybrid A but not from hybrid B. The difference between C and B is equal to 1.5, which is less than the LSD value of 2.0. This means that these hybrids did not differ in yield. The difference between C and A is equal to 3.0, which is greater than the LSD value of 2.0. This means that the yields of these hybrids were significantly different from one another. The asterisk indicates that hybrid B was not significantly lower than the top yielding hybrid C, indicated in bold.
RESULTS
Weather data was recorded with a Davis Instrument Vantage PRO2 weather station, equipped with a WeatherLink data logger at Borderview Research Farm in Alburgh, VT (Table 3). From August through October there were an accumulated 1943 Growing Degree Days (GDDs), at a base temperature of 41° F. This is 239 more than the long term average and 48 more than 2015.
Table 3. 2016 weather data for Alburgh, VT.
August September October
Average temperature (°F) 71.6 63.4 50.0
Departure from normal 2.90 2.90 1.90
Precipitation (inches) 3.00 2.50 5.00
Departure from normal -0.93 -1.17 1.39
Growing Degree Days (base 41°F) 942 681 320
Departure from normal 82 95 62
Based on weather data from a Davis Instruments Vantage Pro2 with WeatherLink data logger. Historical averages are for 30 years of NOAA data (1981-2010) from Burlington, VT.
Hybrid Yield
A 6.0
B 7.5*
C 9.0*
In 2016, temperatures were slightly above average during the growing season. Rainfall was below average in August and September but above average in October. Despite the dry weather at planting, the forages did not seem to experience any difficulty germinating. The mild and moist weather during the month of October provided excellent growing conditions up to harvest.
Nearly all forage treatments produced over 2000 lbs ac-1. Winter pea and Triticale 815 has yields below 2000 lbs ac-1 (Table 4). The highest yielding treatment was the turnip planted in monoculture which produced 2649 lbs ac-1 dry matter. The highest yielding mixture was the oat/pea/turnip mixture which produced 2554 lbs ac-1. This year’s yields are considerably higher than last year, averaging 700 lbs ac-1 higher. This is also evidenced by the heights attained by the treatments, ranging from 31.0 to 55.4 cm with an average of 43.9 cm. Last year’s average height was only 15.4 cm. This considerable performance increase is likely due to more favorable weather conditions. However, it is also important to note that previous to this trial being planted there was a crop of spring barley harvested. At the time of harvest of this trial, there was volunteer barley that could not be separated which may also have contributed to the higher yields.
Table 4. Yield, height and quality of twelve forage species/mixtures, 2016.
Abbreviation DM yield Height Dry Matter
Crude protein ADF NDF NDFD lbs ac-1 cm % % of DM % of DM % of DM % of NDF O/P/T 2554* 50.3* 11.9 17.0 26.3 37.7 76.1* Tr/P/T 2454* 50.3* 13.4 18.0 24.0* 32.9 75.8* Rye/P/T 2268* 48.7* 11.2 16.3 23.4* 28.3* 79.9* Tr/O/P/T 2313* 47.8* 12.1 17.6 25.1* 35.9 76.6* Tr/Rye/P/T 2090 41.2 13.5 15.2 23.4* 32.6 80.2* Everleaf Oats 2419* 52.0* 14.7 18.0 31.1 49.9 76.9*
Forage Maker50 Oats 2059 55.4* 18.0* 16.3 28.8 48.1 70.5
815 Triticale 1862 35.7 19.2* 20.9 29.3 47.0 76.1* Bolt Triticale 2095 36.7 18.2* 19.4 25.9 44.9 71.9 Ryegrass 2362* 34.4 16.7 17.9 23.7* 39.1 80.0* Peas 1531 31.0 15.2 23.5* 23.0* 35.4 65.0 Turnip 2649* 42.8 10.6 16.3 22.3* 25.9* 79.4* LSD (p = .10) 544 8.76 2.05 2.15 3.22 5.08 5.39 Trial Mean 2221 43.9 14.6 18.0 25.5 38.1 75.7
Treatments in bold are top performers for that parameter.
Treatments with asterisks* performed statistically similarly to the top performer.
Protein ranged from 15.2 to 23.5%, highest in the monoculture pea treatment, with a trial average of 18.0% (Figure 1). The lowest protein treatment was the triticale/ryegrass/pea/turnip mixture which was statistically similar to the ryegrass/pea/turnip and oat/pea/turnip mixtures as well as the turnip and Forage Maker50 oat monocultures. The lowest ADF and NDF levels of 22.3 and 25.9% respectively were produced by the turnip monoculture treatment. The NDF digestibility ranged from 65.0 to 80.2 with an average of 75.7%. The most digestible treatment, the triticale/ryegrass/pea/turnip mixture, performed statistically similarly to all other treatments except for the pea, Bolt triticale, and Forage Maker50 oat monocultures.
Figure 1. Dry matter yield and protein of 12 annual forage mixtures, 2016.
Treatments with an asterisk* performed statistically similarly to the top performer
* * * * * * 0 4 8 12 16 20 24 28 32 0 250 500 750 1000 1250 1500 1750 2000 2250 2500 2750 3000
Winter Peas 815 Triticale Forage Maker50
Oats
RPTrT Bolt Triticale
RPT TrOPT Ryegrass Everleaf Oats TrPT OPT Turnip P ro tein ( %) Dr y m atter y ield ( lb s ac -1) DM Yield Protein
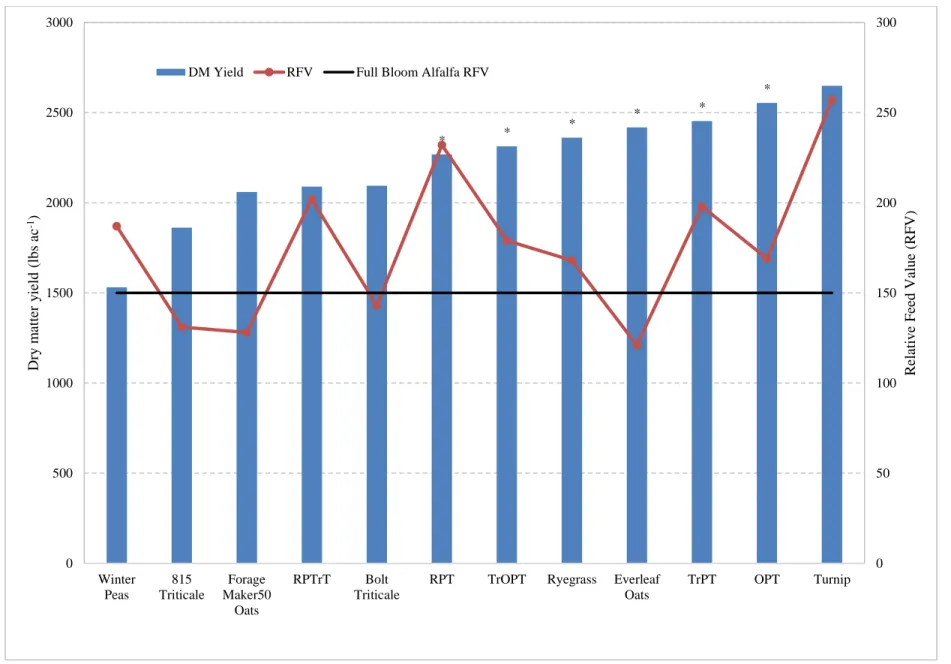
Figure 2. Dry matter yield and RFV of 12 annual forage mixtures, 2016.
Treatments with an asterisk* performed statistically similarly to the top performer.
* * * * * * 0 50 100 150 200 250 300 0 500 1000 1500 2000 2500 3000 Winter Peas 815 Triticale Forage Maker50 Oats RPTrT Bolt Triticale
RPT TrOPT Ryegrass Everleaf Oats TrPT OPT Turnip R elativ e Feed Valu e (R FV) Dr y m atter y ield ( lb s ac -1)
Although treatments were not statistically analyzed for differences in relative feed value (RFV), it is interesting to note the range of values produced by the treatments (Figure 2). Four treatments, which included both varieties of triticale and oats planted in monoculture, had a RFV score below 150 which is the value of alfalfa in full bloom used as a benchmark. The five mixtures trialed had an average RFV of 196 whereas the component monocultures of those mixtures averaged 172, 24 points lower. Three treatments, including turnip monoculture, ryegrass/pea/turnip, and ryegrass/pea/triticale/turnip, had RFV scores over 200. Despite the high quality, the ryegrass/pea/triticale/turnip mixture produced statistically less biomass than the other two treatments although still producing about 1 ton ac-1 dry matter. The mixtures that seemed to retain both high yield and quality were ryegrass/pea/turnip and triticale/pea/turnip. The triticale/oat/pea/turnip and oat/pea/turnip mixtures yielded as high as the top performers but had slightly lower quality compared to the previously mentioned two mixtures. If you compare the monoculture treatments to the three-way mixtures, you can see the yield and quality benefits to adding peas and turnips to your grasses. For example, adding turnips and peas to the oats increased the yield minimally by 135 lbs ac-1 but increased quality considerably by decreasing ADF and NDF thereby increasing RFV by 48 points. Likewise adding peas and turnips to the triticale treatment increased yields by about 600 lbs ac-1 and decreased ADF and NDF increasing RFV by 67 points. Finally, adding peas and turnips to the monoculture annual ryegrass treatment had little effect on yield but increased RFV by 64 points. Increasing the species from three to five did not have a positive impact on yield and quality. For example, by adding triticale to the ryegrass/pea/turnip mixture the yield decreased by 200 lbs ac-1 and the RFV by 30. By adding oats to the triticale/pea/turnip mixture, the yield decreased by 141 lbs ac-1 and the RFV by 19. However, it is important to note that there may be additional benefits to including more species in a mixture that were not investigated in this trial. For instance, triticale could provide additional forage in the following spring which could increase the overall yield and benefit of some of these mixtures. Furthermore, aspects of soil health and fertility were not investigated but could potentially benefit from planting a more complex mixture of species than a monoculture. These additional benefits were outside the scope of this trial and may be investigated in the future.
DISCUSSION
Overall the cool season mixtures trialed performed extremely well producing an average of 2336 lbs ac-1 dry matter. All mixtures except for the ryegrass/pea/triticale/turnip, produced yields statistically similar to the top performing turnip monoculture treatment, however it still produced 2089 lbs ac-1 dry matter. All mixtures also had a RFV score over 150 with two of the five being over 200. The largest difference in yield and quality was seen by adding peas and turnip to the triticale treatment which increased yields by 600 lbs ac-1 and RFV by 48 points. Interestingly, the five-way mixtures did not perform better in terms of yield and quality than their three-way counterparts. However, it is important to realize that there may be additional soil health and quality or additional overwintered forage benefits to some of these mixtures that were not investigated in this trial. These data also only represent one year of data and should not solely be used to make management decisions.
ACKNOWLEDGEMENTS
UVM Extension would like to thank Roger Rainville and his staff at Borderview Research Farm in Alburgh for their generous help with the trials. We would like to acknowledge Erica Cummings, Hillary Emick, Julian Post, and Lindsey Ruhl for their assistance with data collection and entry. This project was supported through a USDA CARE grant. The information is presented with the understanding that no product discrimination is intended and no endorsement of any product mentioned or criticism of unnamed products is implied.
UVM Extension helps individuals and communities put research-based knowledge to work.
Issued in furtherance of Cooperative Extension work, Acts of May 8 and June 30, 1914, in cooperation with the United States Department of Agriculture. University of Vermont Extension, Burlington, Vermont. University of Vermont Extension, and U.S. Department of Agriculture, cooperating, offer education and employment to everyone without regard to race, color, national origin, gender, religion, age, disability, political beliefs, sexual orientation, and marital or familial status.