practical ways to drive field service, looking forward.
susanishaving a hectic Thurs-day at work. Busy Thurs-days are nothing new for this 20-year
veteran of the financial ser -vices industry. Susan works as the direc-tor of operations at the headquarters of Excellence Bank. A regional retail bank with 25 locations, Excellence Bank ca-ters to consumers and small businesses
in the state in which it was founded 75 years ago.
Susan has seen economic ups and downs, but the current recession is per-sisting far longer than she and her col-leagues expected. On her way back from a quick lunch, she checks her smartphone and discovers that a technician from the bank’s server vendor is scheduled
to show up at 3 p.m. for a repair. The vendor’s helpdesk failed to resolve the slow performance of this server – one of Susan’s direct reports has been on the phone with the vendor’s call center twice already – and has scheduled an onsite technician to address the issue.
Joe shows up at Susan’s site 10 min-utes before the scheduled time – an
experienced technician, he works for one of the local outsourcers Susan’s server vendor uses for onsite repairs. This has also been a busy Thursday for Joe. Susan is Joe’s fourth appointment of the day, with one more to go before he calls it a day. Joe came prepared and his appointment at Excellence Bank HQ
went smoothly. Joe quickly confirmed,
predictive analytics in field service
by (leFt to right) scott brown, atanu basu anD tim worth
24 | a n a ly t i c s m a g a z i n e . c o m a n a ly t i c s | n o V e m b e r / D e c e m b e r 2 010
in line with what the second call center agent anticipated, that one faulty part was causing the performance issue with the server. He was carrying the replace-ment part and was able to restore the system to its normal performance level within half an hour, before leaving for his next appointment. The next day, Susan received an e-mail survey from the ven-dor, requesting feedback on Joe’s ser-vice visit and other related topics. She waited until Wednesday to ensure the continued performance of the server
Joe fixed, then favorably completed the
survey.
Can predictive analytics help Susan, Joe, their respective companies and oth-er parties in this ecosystem? That’s the premise here. This article is the second of a two-part series highlighting some of the most practical and effective applica-tions of predictive analytics in after-sales service. Part 1 focused on customer
service; this article will focus on field
service.
Simply put, advances in predictive analytics go further today to identify and quantify not just “what will happen and when,” but also ”why” by syner-gistically combining available datasets with domain knowledge and mathemati-cal sciences. Leading researchers are even coupling predictive analytics with
decision management to provide predic-tions along with associated decisions – i.e., practical and timely action plans to take advantage of the predictions – and calling it predictive decision manage-ment™ or prescriptive analytics.
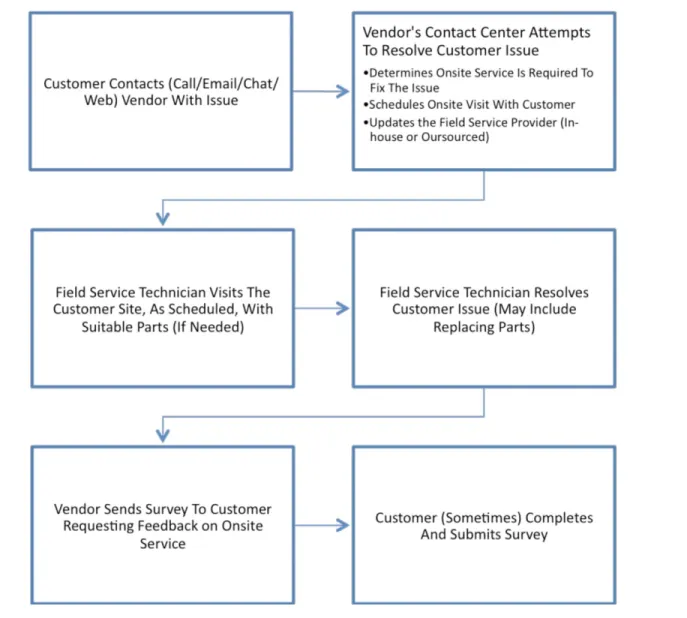
Customer service is the after-sales service provided by a company through contact centers. This service can be for technical or non-technical issues that a customer is experiencing with a prod-uct or service. Contact, usually inbound (i.e., a customer contacting a company), can be made by phone, e-mail, chat and the Web.
Field service is the after-sales ser-vice provided by sending an expert to a customer’s site to resolve an issue, technical or otherwise, that the custom-er is expcustom-eriencing. This usually takes place after the customer has unsuc-cessfully attempted to resolve the issue with customer service, at which point field service is engaged to address the issue.
UNDERSTANDING FIELD SERVICE
The scenariodescribed above involving Susan and Joe is typical in field service
(see Figure 1).
For large computer hardware vendors – Dell, HP, Acer and others – it may take
six or more functions to execute a
suc-cessful field service business process:
Customer service (contact centers), IT,
service logistics, parts fulfillment, carri -ers and service provid-ers.
Measuring services performance can
be far more difficult than doing so for
manufacturing. Underperforming service
providers are quick to point out that ser-vices involve intangibles, and hence can’t be accurately measured and
man-aged. The McKinsey article,
“Measur-ing Performance In Services,” tackled this topic head on, listing best practices through which services executives can implement rigorous metrics to reduce
p r e D i c t i v e
a n a ly t i c s
p r e D i c t i v e
a n a ly t i c s
variance and improve productivity. A follow-on article from McKinsey, “Im-proving Field Service Productivity,”
highlights how real-time technologies and corresponding process adapta-tions are helping companies rein in
“invisible” field service employees and
further improve productivity.
This article focuses on metrics in the critical areas of customer satisfaction, customer loyalty and customer prob-lem resolution. These metrics deal with
effectiveness, not efficiency of field service, and thus are of significance
to the company’s top- and bottom-line. We will also address one of the most critical cost metrics, cost of parts
dis-patch, in field service.
CUSTOmER: SOLVE mY ISSUE
field Technicians show up at a
cus-tomer’s site to resolve an issue the customer is having with a product the customer purchased from the vendor. Three common metrics (also known as key performance indicators, KPIs), generally measured through customer surveys, are used to learn about the resolution of a customer issue:
• Resolve in one (Ri1) – Was the
problem resolved in a single service visit?
subscribe to
Analytics
it’s fast, it’s easy and it’s fRee!
Just visit: http://analytics.informs.org/
aDvances in preDictive
analytics go Further toDay
to iDentiFy anD quantiFy
not Just “what will happen
anD when,” but also ”why” by
synergistically combining
available Datasets with
Domain KnowleDge anD
mathematical sciences.
26 | a n a ly t i c s m a g a z i n e . c o m a n a ly t i c s | n o V e m b e r / D e c e m b e r 2 010
p r e D i c t i v e
a n a ly t i c s
CUSTOmER: mAkE mE hAPPY, EARN mY LOYALTY
cusTomersaTisfacTion and customer
loy-alty are the pillars of any successful
busi-ness. Your customers’ perception, accurate
or otherwise, is your reality. Monitoring, in-terpreting and, most importantly, acting on customer feedback is critical to the success
of any field service operation. Common
metrics that companies use to measure (generally through customer surveys) cus-tomer satisfaction and loyalty include:
• customer satisfaction: How satisfied
are you with the service event that occurred on Oct. 15, 2010? Please
rate from “not at all satisfied” to “extremely satisfied” on a scale
(examples of scales: 1 through 9, 1 through 5, etc.)
• tech support satisfaction: How
satisfied are you with your experience
with the company’s contact centers?
Please rate from “not at all satisfied” to “extremely satisfied” on a scale.
• Company (also known as vendor or brand) satisfaction: How satisfied
are you with the company (not just your recent support experience)?
Please rate from “not at all satisfied” to “extremely satisfied” on a scale.
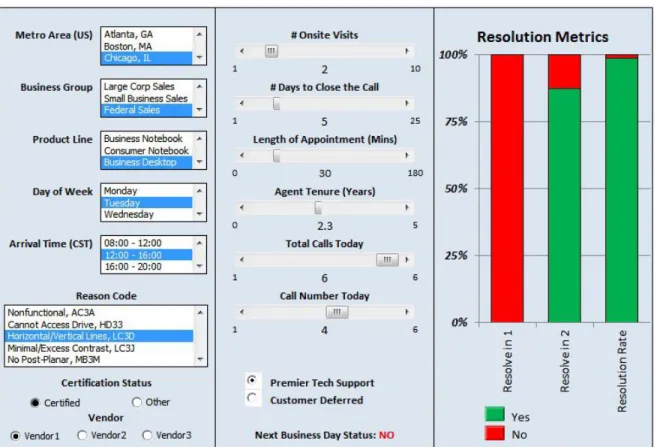
• Recommend likelihood (usually measured through net promoter score): How likely are you to Figure 2 shows an example of an
ad-vanced interactive simulation, originally developed for a large computer hardware vendor, showing the effect of several factors on XPR, Ri1 and Ri2. The factors displayed in this simulation are self-explanatory. It is also important to keep in mind that some of
these factors, i.e., influencers, are interde -pendent. The factors are also displayed, on the screenshot, in their order of importance
with respect to influence they exert on XPR,
Ri1, and Ri2. [Note: All screenshots in this
article have been modified to protect confi -dential information.]
Enter predictive analytics. For a field
service, it can help predict:
• specific issues customers will have
with a particular product, and when they are likely to have these issues, far in advance of these issues occurring;
• XPR, Ri, and Ri2 – percentage values
per month, per quarter – even before customers encounter issues for which they will contact the company for resolution;
• XPR, Ri1 and Ri2 – percentage values
– per product per issue per technician per time horizon (of interest);
• optimum length of appointment to
achieve Ri1, per product per issue per technician per time horizon; and
• a range of insightful custom
predictions specific to each scenario of
interest.
• Resolve within two (Ri2) – Was the
problem resolved within two service visits?
• Problem resolution (XPR) – Was the
problem resolved?
These three metrics depend on many factors that come together to constitute a
field service visit. Obviously, the preferred
outcome is “resolve in one.” Anything a company can do to improve Ri1 will
re-sult in significantly higher satisfaction and
lower costs.
Figure 2: Advanced interactive simulation, showing the effect of several factors on XPR, Ri1 and Ri2.
customer satisFaction anD
customer loyalty are the
pillars oF any successFul
business. your customers’
perception, accurate or
otherwise, is your reality.
p r e D i c t i v e
a n a ly t i c s
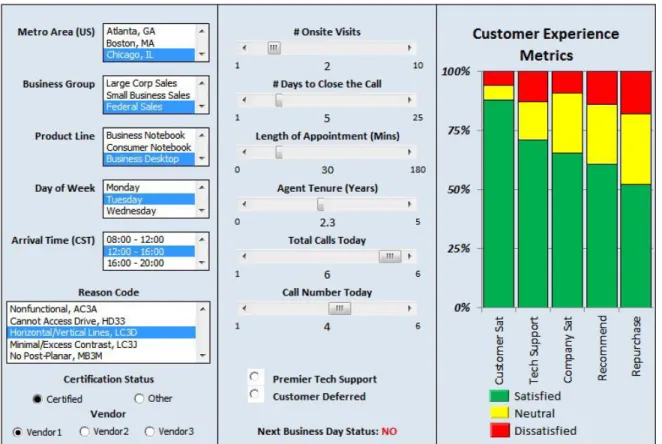
recommend this company to a friend or colleague? Please rate from “extremely unlikely: to “extremely likely” on a scale.
• Repurchase likelihood: How likely are you to repurchase from this company? Please rate from “extremely unlikely” to “extremely likely” on a scale.
Figure 3 shows a screenshot of an advanced interactive simulation that
captures how the major influencers,
Figure 3: Interactive simulation captures how major influencers affect metrics in field service for a large computer hardware vendor.
organized in order of their influence, affect the metrics in field service for a
large computer hardware vendor.
Enter predictive analytics, which
can provide critical predictions for field
service:
• each metric in customer satisfaction
and customer loyalty – percentage values per month and per quarter – even before customers encounter issues for which they will contact the company for resolution;
28 | a n a ly t i c s m a g a z i n e . c o m a n a ly t i c s | n o V e m b e r / D e c e m b e r 2 010 • satisfaction and loyalty performance,
per product per issue per technician per time horizon;
• dependency between Ri1 and
customer satisfaction, per product per issue per technician per time horizon;
• optimum length of appointment to
maximize customer satisfaction and loyalty, per product per issue per technician per time horizon; and
• a range of insightful custom
predictions specific to each scenario of
interest.
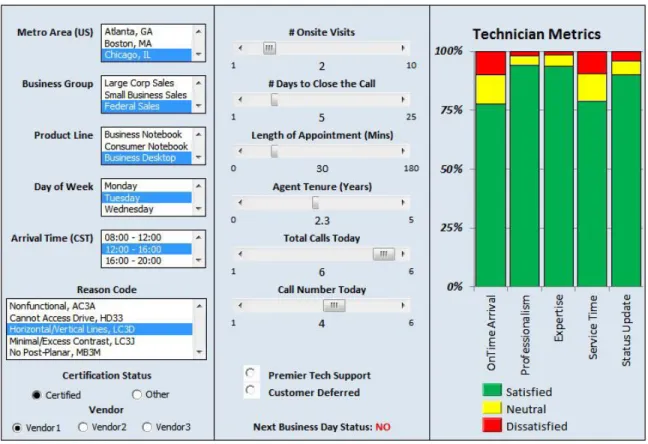
COmPANY: EFFECTIVE FIELD TEChNICIANS
people are The key to running a suc-cessful and effective field service operation, and the field service techni -cian is the “face” of the company to the customer.
How a company uses its field service technicians, optimizes their individu-al efficiency and manages the team’s overall performance are all crucial fac-tors. Some companies include ques-tions in the customer survey to learn more about their customers’ perception of their field technicians. Common met-rics in this category include on-site tech-nician’s timely arrival to customer site, professionalism, expertise in resolving
customer’s issue and effectiveness in updating customer about the status of the issue before leaving customer site (see Figure 4).
Once again, enter predictive analytics,
which can deliver the following field ser -vice predictions:
• technician metrics – percentage values
per month and per quarter – even before customers encounter issues for which they will contact the company for resolution;
• technician expertise, per product per
issue per technician per time horizon;
• technician service time, per product
per issue per technician per time horizon; and
• a range of insightful custom
predictions specific to each scenario of
interest
COmPANY: PARTS mANAGEmENT IS PARAmOUNT
mulTiple Touches with a
custom-er throughout a scustom-ervice event impact
p r e D i c t i v e
a n a ly t i c s
people are the Key to
running a successFul anD
eFFective FielD service
operation, anD the FielD
service technician is the
“Face” oF the company to
the customer.
Figure 4: Metrics in an effective field service operation include timely arrival, professionalism and expertise.
help promote
Analytics
it’s fast and it’s easy! visit:
overall costs: initial contact, service parts, field engineers, event monitoring and managing, etc. However, one of the most critical (and most expensive) ele-ments is the physical part that may be required to successfully complete the onsite repair. Even within the part costs, multiple elements must be managed and optimized (such as logistics costs, procurement costs, inventory costs). All of these elements together make up the overall cost per dispatch (CPD).
Consistently getting the right part to
the right site at the right time is a difficult
endeavor. Some vendors mandate that their parts suppliers maintain a massive inventory of slow-moving, long-storage parts. Others might require high parts turnover rates or frequent new product introductions from their parts suppliers. Effectively managing these inventories can be challenging.
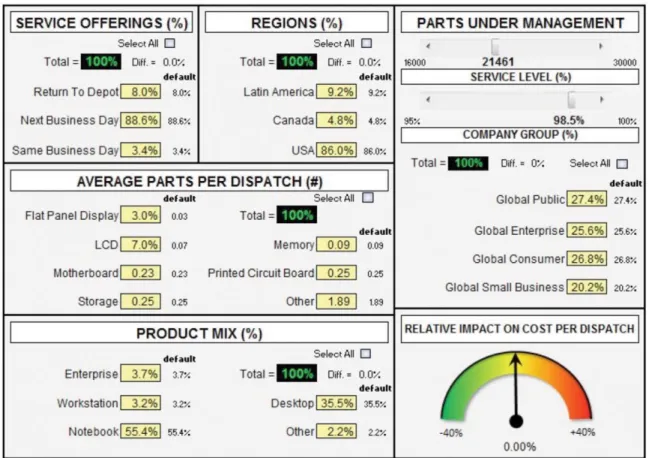
The beauty of predictive analytics is that it can be deployed to evaluate overall
costs as well as individual elements for the complex service parts ecosystems. Recently, a large computer hardware vendor used a predictive, interactive simulator (see Figure 5) to evaluate its service parts network that consisted of multiple service delivery models, mul-tiple regions, mulmul-tiple product lines and hundreds of thousands of individual parts. This robust simulator was able to illustrate the changes in CPD by varying a range of elements.
For example, how much would the CPD go up by increasing the number of ser-vice parts in inventory? Or, what will be the change if the Latin America business grows by 10 percent? There are multi-ple inventory management and network optimization tools that can help model costs, but predictive analytics can bring
it all together, for the first time, making it
easy to see a complex set of levers be-ing manipulated at once.
Predictive analytics can also help ef-fectively manage inventories by predict-ing demand for short-term, new and life cycle parts and thus lower costs and drive customer satisfaction. By prioritiz-ing issues and activities based on antici-pated customer needs rather than simply
maintaining inventory levels, a field ser -vice organization can favorably drive its satisfaction and cost metrics. Creating
self-sustaining processes and systems
that support the predictable flow of parts
from a parts supplier to a vendor
ware-house to a field technician to a customer
site, a business can wrestle back control of inventories and the entire end-to-end parts process.
As with any process, the inclusion of relevant, real-time data dramatically im-proves prediction accuracy. For
exam-ple, entry enabled by smartphone field
units can improve visibility, tracking and execution across the enterprise – sales,
marketing and finance departments can
all get updates on inventory changes as they happen. This immediate updating of crucial parts logistics data can feed predictive models the inputs needed to return vital, immediate and actionable results.
Remember the fundamentals. Pre-dictive analytics is not a panacea; the fundamentals of field service opera-tions have to be addressed first. Ex-amples include consistent service level agreements, streamlined and standard-ized business processes, rigorous data collection (data quality, timeliness, etc.) and strong management involvement. However, with these best practices in place, businesses can enjoy huge ben-efits by deploying Predictive Analytics in field service.
Figure 5: Large computer hardware vendor uses a predictive, interactive simulator to evaluate its service parts network.
3 0 | a n a ly t i c s m a g a z i n e . c o m a n a ly t i c s | n o V e m b e r / D e c e m b e r 2 010
EPILOGUE
iT is summer 2012 and Susan is now
a senior director of business operations at Dominant Bank, a large multipurpose bank with hundreds of locations across
the nation. The recession is finally a past
memory. She took this job last year and
moved to a local branch office; after two decades with smaller financial services outfits, it was time for a change. Susan’s
new job, and the promotion that came with it, didn’t make her days any less hectic, however.
A VP from one of her server vendors is scheduled to show up this afternoon. Susan and her team didn’t have any recent prob-lems with this vendor’s servers, so she was a bit surprised when she learned from her assistant that the vendor reached out and scheduled this meeting two weeks earlier.
David, VP of support operations at the server vendor, arrives on time with a couple of his deputies. Recognizing that Susan is a bit confused about the purpose of this meet-ing, David quickly gets to the point. David’s company wants to offer Susan complimen-tary hardware and service to preemptively replace a few servers in her branch’s back
office. David believes these particular serv -ers may begin to experience issues as soon as two weeks, and David’s company wants to ensure that Susan’s branch doesn’t ex-perience any disruption.
Bewildered but reassured, Susan ap-preciates the offer and accepts it – she can’t afford a disruption in her back
of-fice. Next week Susan is going to meet
her peers from other local branches to evaluate hardware and software ven-dors that can support Dominant Bank’s continued expansion in the region. She e-mails David before this meeting and asks him to get on her calendar again in
two weeks. ❙
Scott Brown ([email protected]) is a senior
manager at Dell with 20 years of experience in end-to-end service delivery, including tech support, field services, service parts and logistics with Dell, Accenture, Exxon and the U.S. Army. He has consulted on supply chain strategies with Qwest, HP, AT&T and Motorola. Atanu Basu ([email protected]) is the CEO of DataInfoCom, an analytics software company headquartered in Austin, Texas. He has 17 years of experience in the semiconductor and the software industry. Dell and Microsoft are among DataInfoCom’s reference, and repeat, customers. DataInfoCom created Predictive Decision Management™ technology and has won an “emerging technology” investment award from the Texas Governor’s office for it. Tim Worth (tworth@ datainfocom.com) is the senior manager of delivery operations at DataInfoCom. He has 20 years of frontline service industry experience with Dell (16 years in service analytics), Sallie Mae and Aditya Birla Minacs.
p r e D i c t i v e
a n a ly t i c s
the beauty oF preDictive
analytics is that it can
be DeployeD to evaluate
overall costs as well as
inDiviDual elements For
the complex service parts
ecosystems.
subscribe to
Analytics
it’s fast, it’s easy and it’s fRee!