PARTIES IN THE AMERICAN ELECTORATE
Gregory J. Wolf
A dissertation submitted to the faculty of the University of North Carolina at Chapel Hill in partial
fulfillment of the requirements for the degree of Doctor of Philosophy in the Department of
Political Science.
Chapel Hill
2015
c
ABSTRACT
GREGORY J. WOLF: Parties in the American Electorate. (Under the direction of James Stimson)
Political scientists know a lot about the opinion dynamics of the electorate as a whole,
yet relatively little is known about the dynamics of mass parties. Much interesting distinct
variation between the parties in the electorate is covered up through aggregation. This
dis-sertation seeks to provide a better understanding of the American political system by
incor-porating measures of partisan opinion liberalism into distinct theories and models of macro
politics. The dissertation project is based on measures of partisan policy mood, which
gauge the demand for more or less liberal policy relative to the status quo for Democrats,
Republicans, and independents in the electorate from 1951 through 2012.
In the first empirical chapter I discuss the collection of these data and the process of
creating annual estimates of policy mood for Democrats, Republicans, and independents
in the electorate. I also provide an in-depth analysis of the over-time differences between
the symbolic and operational ideologies for these three groups. There are clear
distinc-tions between the symbolic and operational ideologies of Republicans and independents in
the electorate, but remarkable consistency between these two conceptions of ideology for
Democrats.
The second empirical chapter applies the thermostatic model of opinion change to
Democrats and Republicans in the electorate. The theory predicts similar opinion
dynam-ics for Democrats and Republicans over time. While the findings support the prediction
of parallel publics, the mechanism through which Democrats and Republicans respond to
policy significantly contributes to mass party polarization. I wrap up this chapter with a
discussion on how the perceptions of policy held by Democrats and Republicans in the
electorate can lead to the inference of mass party polarization even when the preferences
of both sets of partisans are congruent and stable.
The third empirical chapter focuses on representation. I develop a micro theory of
par-tisan representation based on a member of Congress’ electoral calculus to develop macro
level expectations about policy responsiveness to partisan opinion. The findings indicate
that policy is responsive to the opinion of the majority party’s mass partisans, while
inde-pendents and mass partisans of the out-party do not see their preferences translated into
public policy. The finding contradicts research on representation of the mass electorate, but
adds to the growing literature on the representation of sub-aggregate groups and
ACKNOWLEDGMENTS
First, I would like to thank my advisor, Jim Stimson, for his encouragement, support,
and, most of all, patience on this dissertation. Without Jim’s guidance and comments,
of-ten humbling, this dissertation would not be possible. I would also like to thank Frank
Baumgartner, Tom Carsey, Mike MacKuen, and Chris Wlezien for serving as committee
members and their thoughtful comments on the project. Beyond the committee, I should
also thank Peter Enns and Nate Kelly for their comments and encouragement, and David
Barker for sparking my interest in political science when I was a freshman at the
Univer-sity of Pittsburgh way back in the fall of 2003. I am also thankful to the Department of
Political Science at the University of North Carolina at Chapel Hill and Tom Uhlman for
their financial support throughout this entire process.
I would also like to thank my friends and family who have been instrumental at various
stages of this dissertation, either by providing feedback or helping to take my mind off
of the project. This is especially true of three of my fellow cohort members, Derek Epp,
Amanda Grigg, and John Lovett. A special thanks goes to Derek for putting up with me
for five years while we shared a very nice apartment. My parents and siblings were always
there for me, despite not really ever understanding what it was I was doing. Others I’d like
to thank for reasons personal and/or professional include Will Winecoff, Alex Parets, Kevin
Banda, Nick Howard, Harry Kane, Paul Simon, Warren Zevon, and Hilary Chi. Obrigado,
LIST OF TABLES
2.1 Correlations of Between Thre GSS Spending Items by Party………...… 12
2.2 Correlations of Issue Series with Estimated Partisan Moods: First Dimension………… 15
4.1 Partisan Mood Responsiveness………... 50
5.1 Policy Responsiveness to Opinion in the House……… 77
5.2 Policy Responsiveness to Opinion in the Senate………... 83
A.1 Policy Responsiveness to the Reelection Constituency……… 96
A.2 VIFs for Table 5.1………. 99
A.3 VIFs for Table 5.2………... 100
A.4 Policy Responsiveness to Independent Mood………..… 102
A.5 Full ECM of Table 5.1……….… 103
A.6 Full ECM of Table 5.2………. 104
A.7 Short Run Effects of Policy Responsiveness in the House……….. 105
A.8 Short Run Effects of Policy Responsiveness in the Senate………. 106
A.9 Koyck Estimation of Policy Responsiveness in the House……….. 107
LIST OF FIGURES
2.1 Three GSS Series: Liberalism Index………. 11
2.2 Partisan Moods……….. 16
3.1 Proportion of Symbolic Ideologies by Party Identification……….. 22
3.2 Symbolic Ideology by Party Identification………... 25
3.3 Operational Ideology by Party Identification………...… 28
3.4 Operational and Symbolic Ideology………. 29
4.1 Hypothetical Partisan Distribution of Preferences……….... 36
4.2 Policy and Relative Preference Change from
t
to
t+1
……….. 37
4.3 Party Control and Relative Preferences Change from
t
to
t+1
………. 43
4.4 Policy Liberalism and Presidential Partisanship……….. 47
1 INTRODUCTION
“Identification with a party raises a perceptual screen through which the
indi-vidual tends to see what is favorable to his partisan orientation.”
∼Campbell, Converse, Miller, and Stokes (1960)
Party identification is defined as an attachment that citizens have to a political party
(Campbell et al. 1960; Green, Palmquist, and Schickler 2002). It is a lens through which
citizens view the political world and shapes how they not only perceive the political
en-vironment, but how they navigate it (Berelson, Lazarsfeld, and McPhee 1954; Campbell
et al. 1960; Stokes 1966; Shively 1979; Niemi and Jennings 1991; Page and Shapiro 1992;
Bartels 2000, 2002; Green, Palmquist, and Schickler 2002; Cohen 2003; Kam 2005;
Berin-sky 2007; Lewis-Beck, Jacoby, Norporth, and Weisberg 2008; Lenz 2012). In collecting
political information, citizens tend to accept what is in agreement with their partisan
pre-conceptions, and reject what is not (Zaller 1992). Further, the vast literature on motivated
reasoning (e.g. Taber and Lodge 2006; Taber, Cann, and Kucsova 2009) suggests that
parti-sanship highlights specific cues in information processing that biases political perceptions.
These blue or red lenses might result in distinctive differences in sub-aggregate group
opin-ion change between Democrats and Republicans in the electorate.
In addition to shaping opinion, partisanship might affect how opinion changes, and in
consequence how opinion is represented. Recently scholars have begun to uncover great
disparities in the representation of sub-aggregate groups in the American electorate (e.g.
Much interesting distinct variation between the parties in the electorate may be covered
up through aggregation. The causes, dynamics, and consequences of changes in partisan
opinion are important for understanding the political environment, especially in an era
of party polarization. In this dissertation I seek to provide a better understanding of the
American political system. First, I turn to a brief discussion partisanship and public opinion
in the literature.
1.1 Partisanship and Public Opinion in the Literature
The authors ofThe American Voter(Campbell et al. 1960) suggest that partisanship has
perhaps the most important influence on citizens political attitudes and behavior in
Ameri-can politics. In this seminal work these authors argue that partisanship is relatively stable,
though it can be altered by contemporaneous events. Fiorina (1981) further argues that
partisanship is a running tally, by which citizens update their partisanship through a
con-tinuous evaluation of the parties based on current and past events and is more variable than
Campbell et al. (1960) suggest. Moreover, MacKuen, Erikson, and Stimson (1989) (and
Erikson, MacKuen, and Stimson 2002) find that partisanship in the aggregate is variable,
though systematic and gradual, and is subject to routine ebb and flow as citizens interact
in the political world. The primary focus of this project is how partisan attitudes affect the
macro polity. Specifically, I am interested in how partisans of different stripes respond to
the political world and how their preferences shape public policy.
Studies of aggregate public opinion, however, suggest that partisanship plays a lesser
role in movements in public opinion over time. Page and Shapiro (1992) find that Democrats
and Republicans in the electorate move in tandem (see also Soroka and Wlezien 2010).
This parallelism is not restricted to parties, as studies have found that other subgroups in
the electorate, such as gender, age, class, and education, all move in tandem (Page and
This has come to be known as the parallel publics thesis. Thus if Democratic and
Repub-lican opinion move in tandem over time, the the effects of partisanship on shaping opinion
must be minuscule.
The reason for such parallelism, as argued by (Enns and Kellstedt 2008), is that
every-one is receiving the same information, and thus respond similarly to changes in the political
environment.1 But there then seems to be a disconnect between these macro level effects
from the literature on the influence of partisanship in shaping individual attitudes.
How-ever, as noted above, partisanship acts as a lens though which citizens view and process
about political world they live in (Campbell et al. 1960; Fiorina 1980; Niemi and Jennings
1991; Finkel 1993). Further, it has been demonstrated that Democrats and Republicans
respond differently to objective political events (Bartels 2002) and receive and accept
po-litical information differently (Zaller 1992). Considering the influence partisanship has on
individual views, the finding of parallelism between Democratic and Republican opinion is
remarkable.2 For a long period in the latter half of the twentieth century, Democratic and
Republican opinion moved in tandem. However, as we will see in the next chapter, these
opinions have moved further and further apart over time.
The deviation of Democratic and Republican opinion parallels the polarization of Democrats
and Republicans in Congress (Poole and Rosenthal 2007; McCarty, Poole, and Rosenthal
2006). In this dissertation I seek to add to this literature on the influences of partisanship
on opinion, and how these opinions affect the American system of government.
1.2 The Approach
Herein I seek to add to the understanding of the American political system. The
ex-tant literature has covered the system well. Studies of macro politics have covered public
1Enns and Kellstedt (2008) are mostly focused the opinion of groups of different education and income levels.
opinion, representation, and elections. I do the same here with opinion change and
rep-resentation, incorporating the attitudes of the major parties in the electorate at the macro
level into the macro system.3 The motivation here is that the most important predictor of
individual level behavior in American politics is covered up through aggregation processes
in the study of the macro system. As stated above, political parties are important in the
processes of attitude formation, policy making, and elections. Ignoring parties and partisan
attitudes may distort the realities of the political world. Through incorporating mass
parti-san attitudes I hope to provide a better understanding of how politics works in America.
Thus I study politics from a macro level perspective in which the focus is on aggregates
rather than individuals. As such attention is paid not to the politics of individual partisans,
but partisan aggregates. However, the individual cannot be ignored. If we wish to
under-stand macro level movements, we must begin with micro level theories. From these micro
level theories we can then build macro level understandings about opinion and other
politi-cal changes (Erikson, MacKuen, and Stimson 2002). Because I am interested in change at
the macro level, the data and methods use times series to study the dynamic relationships
involving partisan attitudes, public policy, and representation.
1.3 Plan of the Dissertation
Substantively, I seek to provide a better understanding of the American political system
by taking the opinion liberalism, or ideology, of the parties in the electorate into account.
Of particular interest is how liberal or conservative each of these groups are over time.
To do this, of course, it is necessary to measure the opinion liberalism of Democrats and
Republicans over time; this is the focus of chapter 2. In chapter 2 I develop measures of
liberalism, based on Stimson’s (1999) public policy mood, for Democrats, independents,
and Republicans in the electorate. This results in annual measures of mood for Democrats,
Republicans, and independents spanning the period 1951 through 2008. What is clear is
that for a long period of time, the parties in the electorate moved in tandem. However, in
the early 1990s the opinion liberalism of the parties start to polarize, thus ending the era of
parallel publics.
In chapter 3, I provide two ways to measure the ideology of the parties in the
elec-torate using the General Social Survey. The first of these is based on ideological
self-identification, called symbolic ideology, and the second is a similar measure of mood
in-troduced in chapter 2. I compare and contrast these data in a variety of ways, showing the
distinction between symbolic and operational ideology.
In chapter 4 I use these measures of Democratic and Republican mood to ask how
Democratic and Republican preferences for policy liberalism respond to the political
envi-ronment. I apply Wlezien’s (1995) model of public opinion as a thermostat to the parties
in the electorate, asking what moves partisan opinion. Applying an updated theory of the
thermostat (Coggins, Stimson, Atkinson, and Baumgartner n.d.) that considers the party of
the president as a thermostatic mechanism as well the model’s original input, public policy,
I find distinct differences in the responsiveness of Democrats and Republicans to the
politi-cal environment. Democrats are responsive to changes in public policy, while Republicans
are responsive to party control of the White House. The takeaway from this result is this
difference is likely indicative of differing perceptions of policy between Democrats and
Republicans.
The last empirical chapter, I consider how partisan opinion affects public policy through
representation. Here I ask whether or not the co-partisans of majority party’s in political
institutions, specifically Congress, are advantaged through representation. The answer, it
turns out, is “yes.” The finding supports some micro level understandings of dyadic
repre-sentation, while providing a contradiction to our understanding of macro level
Finally, chapter 6 attempts to bring the dissertation together, discussing how our
under-standing of movements in partisan opinion can help scholars of American politics to better
understand the American political system. In this chapter I also provide a plan for moving
this project forward through the addition of measure of partisan assessments of the parties
2 PARTISAN MOODS IN THE UNITED STATES
Much is known about the shifts in the American public’s opinion liberalism over time.
These shifts in opinion have been well documented by Stimson (1999, 1991), who has
provided the most comprehensive time series of the public’s attitudes towards government
activity in the United States. These attitudes ebb and flow over time, responding to changes
in party control of government, economic conditions, and other exogenous factors. Though
there is significant variation in public opinion over time, these trends in opinion are
remark-ably stable and predictable. And yet there is much to be revealed about public opinion that
remains unknown; while we know a lot about the American electorate’s opinion liberalism
over time, we know relatively little about the subaggregate opinion of groups within the
electorate. The most important of these groups are the political parties in the electorate,
Democratic and Republican, as well as though who choose to not identify with a party,
independents.
2.1 Moving from Individual Partisans to the Aggregate Parties in the Electorate
Most of the studies on the opinion of partisans in the United States focus on the political
attitudes of individual partisans, analyzing the differences between Democrats and
Repub-licans (and sometimes independents). This research has informed us about how partisans
become loyal to their political party and also how an individual’s partisanship shapes his
or her political attitudes. Importantly, this research has uncovered important distinctions
in how partisans of different ilk interpret political messages, events, and stimuli. And yet
nearly all macro level research discards partisanship. “Macro” does, however, imply the
maco level political outcomes. The approach here is distinct from previous studies of
pub-lic opinion change because I disaggregate the pubpub-lic and focus on the meso level of the
parties in the electorate. Much like what we observe with the public as a whole, we will
see orderly change in partisan opinion.
Focusing on opinion at the party level in the electorate allows us to distinguish between
the parties in the electorate beyond the attitudinal differences between Democratic and
Republican identifiers. By analyzing the aggregate parties in the electorate we can ask not
only what distinguishes the opinion of Democrats from the opinion Republicans, but why
and howchangesin these opinions differ over time?
2.2 The Dynamics of the Parties in the Electorate
We know a lot about how partisan attitudes differ at the individual level. Likewise,
we know a lot about the opinion dynamics of the American public. They survey data are
plentiful to break the American public’s aggregate opinion down by party. However, only
recently has the technology become available that the collection of these data could be
done with ease. A countless number of questions have been asked of random samples of
the American public over time regarding their attitudes towards the scope of government
on a wide variety of issues. Often included in these surveys are questions that ask
respon-dents about their party identification. Using a respondent’s answer to the question of his or
her party deification, we can easily stratify the responses to questions regarding attitudes
towards the scope of government by party identification. Taking the meaning of party
iden-tification seriously, in particular as a psychological attachments, I only include individuals
who identify with one of the two parties in their respective party; independents,
regard-less of whether or not they lean towards one of the parties, are places in the independents
category.
To do this I use data from the General Social Surveys (GSS), American National
the Roper archive, which has archived opinion data regarding, and importantly, has made it
easy to break survey marginals down by party identification usingRoperExplorer.1 From
these sources have over 75 specific questions asked between 1951 and 2008, for a total of
over 1,000 surveys. All of these questions ask respondents, generally speaking, whether
they want “more” or “less” government intervention on a specific issue - for example, “Are
we spending too much, too little, or about the right amount on welfare?” or “Do you think
that people in the government waste a lot of money we pay in taxes, waste some of it, or
don’t waste very much of it?.” Each individual survey of the public provides information
about public preferences towards a specific issue. On its own, the individual survey item
provides little information; however, if we compare answers to one question with answers
to the same question at a different point in time, we can observe a tend in opinion.
Ad-ditionally, we can compare trends in answers to a question to other questions over time,
thus observing shared trends in opinion across issues. I use an algorithm developed by Jim
Stimson to create single indicators of opinion liberalism for each party in the electorate
from the many individual question series (see Stimson 1999, Appendix 1, for the specific
details of the algorithm).
Each of the questions are unique in that they address specific issues in a specifically
worded manner. But what is clear is that there is shared variance across the issues. While
there is some idiosyncratic component at the issue and question level, there lies an
assump-tion that there is some latent opinion underlying these individual attitudes towards
gov-ernment. What we want to uncover is that common, latent sentiment within Democratic,
Republican, and independent groups in the electorate.
2.2.1 Example Analysis: Three GSS Spending Priorities
When we look at individual questions over time, there should be parallel movements
in the responses to these questions within each group. This is well illustrated by looking
at three raw question series from the GSS. The lead for these three question items is, “We
are faced with many problems in this country, none of which can be solved easily or
inex-pensively. I’m going to name some of these problems, and for each one I’d like you to tell
me whether you think we’re spending too much money on it, too little money, or about the
right amount.” The survey then mentions a specific issue area, where respondents are asked:
“Are we spending too much, too little, or about the right amount on [the issue in question].”
The issues used in this example are “improving the conditions of blacks,” “improving and
protecting the environment,” and “welfare.”
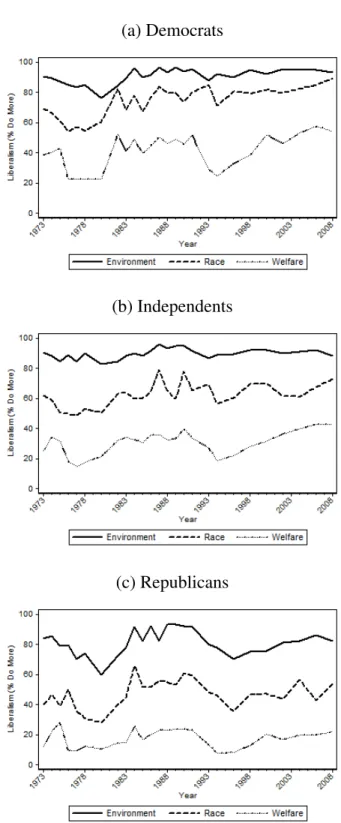
Figure 2.1 plots the over-time responses to these questions for Democrats,
indepen-dents, and Republicans in the electorate. Specifically, the scale on the left-hand side of the
figure is the percentage of respondents giving the “to little” response out of all respondents
who answered “too little” or “too much.” This provides the average number of Democrats,
independents, or Republicans who support doing more or less in each year the GSS issued
the survey.
The common patterns in the over-time responses to these questions are apparent in
Figure 2.1 for Democrats, independents, and Republicans in the electorate. The three
se-ries differ on the average level of support within each party in the electorate, and each
series also has its own particularities. Within each party, support for more spending on
the environment is the greatest, followed by race and welfare, respectively. For all three
groups, support for more spending on the environment is always above 60 percent. Support
for more spending on improving the conditions of blacks is always above 50 percent for
Democrats, and with the exception of 1976 and 1977, always above 50 percent for
indepen-dents; for Republicans, support for spending on this issue goes back and forth over the 50
percent mark over time. Democrats, however, are the only group that breaks the 50 percent
mark in support for more spending on welfare; independents and Republicans as collective
(a) Democrats
(b) Independents
(c) Republicans
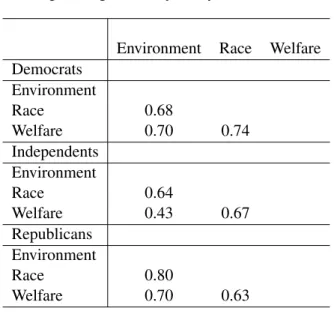
Table 2.1: Correlations of Between Three GSS Spending Items by Party.
Environment Race Welfare Democrats
Environment
Race 0.68
Welfare 0.70 0.74
Independents Environment
Race 0.64
Welfare 0.43 0.67
Republicans Environment
Race 0.80
Welfare 0.70 0.63
Note:N = 26
However, most importantly there is common movement between each series within
each partisan group. It is evident that these three issues have a common variance; when
one increase, so do the other two. This is evident in the covariation in change across each
of the three series split by party. The shared variance between the three series at the party
level is also evident by looking at the correlations between them. Table 2.1 displays the
correlation between each series for Democrats, independents, and Republicans. The high
correlations are further evidence of a shared, common component between each of the three
series within each group.
While support for more spending by issue varies within each party in the electorate,
the series of each issue are highly correlated; when support for more spending on one
issue increases, so too do the others (on average). This ends up being true of nearly every
domestic issue in American politics. The common variance shared across issues suggests
that there is an underlying ideology or mood affecting citizens attitudes towards specific
issues, and more generically, government. Using questions from these three areas and a
opinion towards the scope of government that captures each party in the electorate’s support
for more liberal (or conservative) policy.
2.2.2 Partisan Moods: Measurement and Product
Using GSS, ANES, and Gallup data, we can incorporate many questions across a
vari-ety of domestic issues that have been asked more than once since 1951, all of which capture
some underlying, latent opinion. Doing so allows us to create a more comprehensive and
precise measure of partisan sentiments towards government. Combining each series of
questions, however, is no straightforward task. This is because we cannot simply average
across the percentage of people in support of the liberal (or conservative) position on each
question within each year for each partisan group to generate an average level of support
across issues (and questions) for more liberal policy. This is, first, because the GSS, ANES,
and Gallup differ in their survey methodologies, which can result in different levels of
sup-port, even if questions wordings are identical. Second, while the GSS, ANES, and Gallup
ask similar questions regarding many of the same issues, differences in question wording
can also affect levels of support for the liberal or conservative position. Thus we need to be
able to take each series of questions independently and take these distinctions into account
before combining them into a single measure of opinion. The last issue is one of missing
data. Most of the questions used here are not asked on an annual basis. For example, most
questions from the ANES are only asked every two or four years. Similarly, the GSS, while
once an annual survey, switched to a biannual survey in 1994. Another issue with the GSS
is that it was only first administered in 1973. Thus if we want to extend the time series
backwards on an annual basis, we need survey questions from other survey houses, such as
Gallup, to do so. So a method is needed that can aggregate across each question series and
generate expected values for years in which the question was not asked based on what is
known about the opinion trends of the other question series.
as mentioned above. Stimson developed this algorithm for this exact purpose: to create a
measure of the public’s latent opinion liberalism. This is how it works. If the same question
is asked more than once by a survey house, we can tell whether support for the liberal
position went up or down each time the question was askedon that question. This results
in change ratios for each question item that capture the degree of change in the responses
to the specific question over time. Each question series is then rescaled to a baseline of
support and for each year that a question is asked, which yields whether or not responses
were higher or lower than the baseline and by how much. While the direct comparison of
responses between questions are not comparable, due to the reasons outlined above, the
ratios of measured values between any pair of questions are. The combination of these
ratios results in something like a weighted average, where questions that are asked more
frequently and/or that have larger samples receive more weight in the resulting measure.
This procedure allows for the use of 75 survey questions that can be broken down by
party identification. The result is a time series of latent opinion liberalism for each
parti-san group in the electorate, Democrats, Republicans, and independents. These “partiparti-san
moods” are displayed in Figure 2.2 below. Before examining the history of these moods,
we should check how the components of mood, the individual survey items, fit with the
general movement of each partisan series.
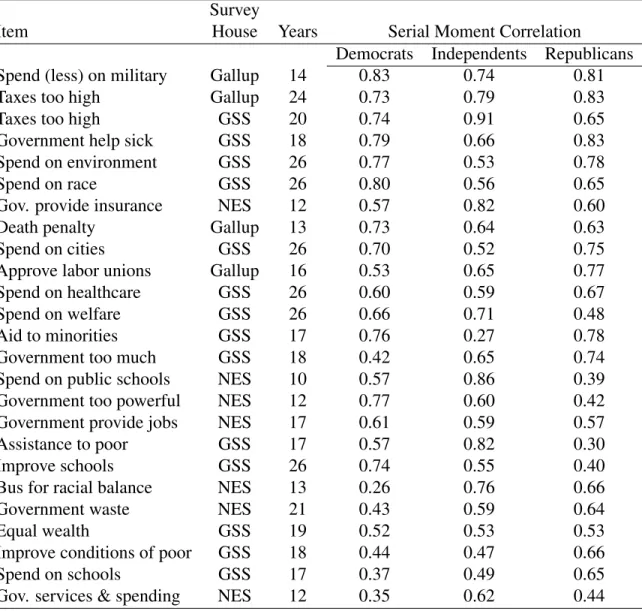
Table 2.2 presents the 25 items that contribute most substantially to the first dimension
of each partisan mood. The table indicates that there are some distinct differences in the
issues that form coherent ideologies across the parties in terms of how much each issue
contributes to each general measure of opinion. However, of these items, New Deal issues,
along with race and environmental protection, are those that define the latent dimension
for all three mood series. For the most part, these issues are strongly associated with
Table 2.2: Correlations of Issue Series with Estimated Partisan Moods: First Dimension
Survey
Item House Years Serial Moment Correlation
Democrats Independents Republicans
Spend (less) on military Gallup 14 0.83 0.74 0.81
Taxes too high Gallup 24 0.73 0.79 0.83
Taxes too high GSS 20 0.74 0.91 0.65
Government help sick GSS 18 0.79 0.66 0.83
Spend on environment GSS 26 0.77 0.53 0.78
Spend on race GSS 26 0.80 0.56 0.65
Gov. provide insurance NES 12 0.57 0.82 0.60
Death penalty Gallup 13 0.73 0.64 0.63
Spend on cities GSS 26 0.70 0.52 0.75
Approve labor unions Gallup 16 0.53 0.65 0.77
Spend on healthcare GSS 26 0.60 0.59 0.67
Spend on welfare GSS 26 0.66 0.71 0.48
Aid to minorities GSS 17 0.76 0.27 0.78
Government too much GSS 18 0.42 0.65 0.74
Spend on public schools NES 10 0.57 0.86 0.39
Government too powerful NES 12 0.77 0.60 0.42
Government provide jobs NES 17 0.61 0.59 0.57
Assistance to poor GSS 17 0.57 0.82 0.30
Improve schools GSS 26 0.74 0.55 0.40
Bus for racial balance NES 13 0.26 0.76 0.66
Government waste NES 21 0.43 0.59 0.64
Equal wealth GSS 19 0.52 0.53 0.53
Improve conditions of poor GSS 18 0.44 0.47 0.66
Spend on schools GSS 17 0.37 0.49 0.65
Gov. services & spending NES 12 0.35 0.62 0.44
measure of public mood. Most of the large differences between the associations of
individ-ual items and the respective partisan moods are not between Democrats and Republicans,
but between the two parties and independents (e.g. aid to minorities). This is perhaps of
no surprise, as the parties have developed platforms that should result in cohesiveness of
opinion amongst partisans; such a mechanism is absent amongst independents.
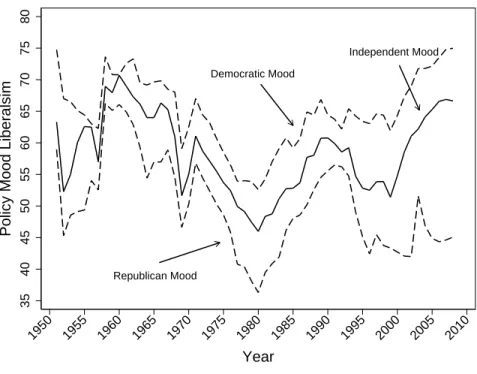
The Democratic, Republican, and independent mood series are largely based on New
dimen-Democratic Mood
Independent Mood
Republican Mood
35
40
45
50
55
60
65
70
75
80
Policy Mood Liberalsim
1950 1955 1960 1965 1970 1975 1980 1985 1990 1995 2000 2005 2010
Year
Figure 2.2: Partisan Moods, 1951-2008
Figure 2.2, we see that the moods trend in ways that would be expected given what scholars
know about the movement of public opinion in the electorate over time. Liberalism is at
its highest points in the 1960s and trends in the conservative direction until Ronald Reagan
wins the presidency in 1980; these trends are consistent with Stimson’s mood data
captur-ing the preferences of the electorate. Unlike the GSS data presented above, the Mood data
presented here indicate that Republicans are not always above the 50 percent mark in their
preference for liberal policy. These more precise data show that Republicans prefer
con-servative policy in the mid-1950s, mid 1970s through the mid-1980s, and in nearly every
year following the Republican takeover of the House of Representatives in 1994. Similarly,
independents briefly indicate preferences for conservative policy in the late 1970s before
moving back in the liberal direction following the election of Ronald Reagan. Democrats
and independents through time. There appears to be no difference in reaction to
signifi-cant events, such as Watergate, between Democrats, Republicans, and independents in the
electorate until the 1990s. Until the 1990s, each of the three Moods trend in opposition to
the party in the White House. From the series origin in 1951 through 1992, the correlation
between Democratic and Republican Mood is astoundingly high (r=0.90). This fits nearly
perfectly with Page and Shapiro’s (1992) finding of parallel publics between the parties in
the electorate. However, the correlation between Democratic and Republican Mood from
1993 through 2008 is extremely low (r = 0.08), significantly lower than in the previous
period. What is clear is that something changed in the early 1990s that caused these
par-tisan ideologies to deviate. It might be true ideological polarization, or it could simply be
the result of partisan sorting.
What is clear is that Democrats and Republicans in the electorate are farther from each
other ideologically than any point, at least, in the post-World War II era. In the next chapter
I seek to understand how partisan opinion changes, applying Wlezien’s (1995) thermostatic
model of opinion change to the parties in the electorate. I then use these same Mood data
3 THE IDEOLOGICAL ATTITUDES OF MASS PARTIES IN AMERICA
The American political parties today are ideologically distinct in both government and
the electorate. However, this has not always been the case. In the 1950s, the Democratic
and Republican Parties were practically indistinguishable from one another (APSA 1950).
Since the 50s, the parties have become more distinct and are now considered to be
“po-larized” (McCarty, Poole, and Rosenthal 2006). While we know this about the parties in
government, much less is known about the ideology of the parties in the electorate, and
particularly how they have changed over time, let alone how these attitudes affect the
po-litical system. In this chapter I lay out the data used to capture these changes in partisan,
ideological preferences towards government. The question asked is, “how to the parties in
the electorate change ideologically over time?”
In American politics, ideology is generally characterized on a left-right, liberal-conservative
scale which underlies political attitudes. The left, liberal position today is one that is
char-acterized by government intervention in economic affairs and equality through the levelling
the playing field; the right, conservative position is synonymous with free markets and and
the belief that equality is achieve through hard work. Generically, liberal has come to be
as-sociated with government intervention (or “big government”), while conservative is largely
associated with limited government and states rights. But when voters hear the words
“lib-eral” and “conservative,” are these the associations that they are making? More than fifty
years ago Campbell et al. (1960) suggested that voters do not understand politics in
ide-ological terms. But this does not mean that voters do not hold real political attitudes that
fall on the left-right spectrum; the American public is not as nonideological as Converse
Thus a distinction must be made between the symbols that are associated with the
ide-ologically charged words “liberal” and ”conservative” and true ideological policy
prefer-ences (Ellis and Stimson 2012). Symbolic ideology is meant to capture how voters think
of themselves ideologically in the political world (Conover and Feldman 1981).
Tradi-tionally, ideology is measured by asking respondents to place themselves somewhere on
the ideological continuum, typically on a Likert scale. While symbolic ideology captures
how individuals consider their personal political beliefs, it may not accurately reflect their
true, latent political preferences. The words “liberal” and “conservative” hold meanings to
individuals outside of politics, and are likely to influence an individual’s self-identified
ide-ological disposition. This identification is largely symbolic and may hold little relevance to
and individual’s underlying political attitudes. In the aggregate, symbolic ideology gauges
how the public thinks of itself ideologically. Because symbolic ideology is only weakly
tied to real political attitudes, we need a better way to understand ideology in American
politics that gauges real policy preferences.
If we consider that a citizen’s policy preferences fall along the ideological continuum,
then a case can be made that the summation of these preferences is a latent measure of
ide-ology. Ellis and Stimson (2012) call this operational ideology and reflects an individual’s
preferences towards the scope of government. For instance, Ellis and Stimson (pp. 17) ask
the following questions with respect to such preferences:
Should government redistribute income from wealthy citizens to poorer ones?
If so, how much? Should government be more or less involved in providing (for
example) health care to those who cannot afford it, income security to older
citizens, or job training to those who desire it? Should it strongly regulate
the activities of private business in the name of protecting the environment?
Should it spend more in national defense?
ideology that is distinct from symbolic ideology (Ellis and Stimson 2012). This conception
of ideology is not distorted by factors such as Biblical conservatism or a distaste for the
things that go along with word “liberal”). Operational ideology thus is devoid of all the
problems intertwined with symbolic ideology; it is devoid of nonpolitical content.
To examine the ideological distinctions, both symbolic and operational, between Democrats
and Republicans in the electorate over time, I need time serial data on the attitudes of
the American public that can be broken down by partisanship. I also need to be able
to compare symbolic and operational ideology. In this chapter I use data from the
Gen-eral Social Survey (GSS), which asks respondents about their party affiliation, ideological
self-identification, and views on variety of public policy issues regarding the scope of
gov-ernment. These data have the advantage of consistently asking the same policy oriented
questions over a period of almost forty years.1 These data allow for the comparison of
the symbolic and operational conceptions of ideology over time for the Democratic and
Republican parties in the electorate, as well as independent identifiers. Additionally, I this
allows for the comparison of these three distinct groups to the electorate as a whole in order
to see how each of the groups relates to the mass electorate.
3.1 Symbolic Ideology in the Electorate
Let’s first examine symbolic ideology. Respondents on surveys regarding political
atti-tudes are frequently asked whether they considered themselves to be politically liberal or
conservative. For example, the General Social Survey (GSS) asks respondents to answer
the following question:
We hear a lot of talk these days about liberals and conservatives. I’m going to
show you a seven-point scale on which the political views that people might
hold are arranged from extremely liberal–point 1–to extremely conservative–
point 7. Where would you place yourself on this scale?
The question is meant to measure the ideology of the respondent and is known as
self-identified, or symbolic, ideology. It is frequently used as such in models of voting
behav-ior, presidential approval, and political participation in micro level analyses. For example,
Fiorina (2009; 2005) uses symbolic ideology to demonstrate how moderate the American
public is and the lack of polarization between Democrats and Republicans in the
elec-torate. Levendusky (2009) similarly uses symbolic ideology in a discussion of partisan
sorting. Symbolic ideology has also been used by scholars as a predictor of vote choice
and candidate evaluation in elections (Abramowitz 1981; Bonneau and Cann 2015; Ensley
2007; Jacoby 2003; Lewis-Beck 1988; Lyons and II 1992; Palfrey and Poole 1987; Squire
and Smith 1988; Wlezien, Franklin, and Twiggs 1997). The results of symbolic ideology
across many of these studies of mixed, and often weak relative to other factors. Simply put,
it is not a good predictor of choice or candidate placement because it poorly captures
polit-ical attitudes. But that does not mean it is unimportant. Symbolic ideology is not random
and may have meaningful movement over time.
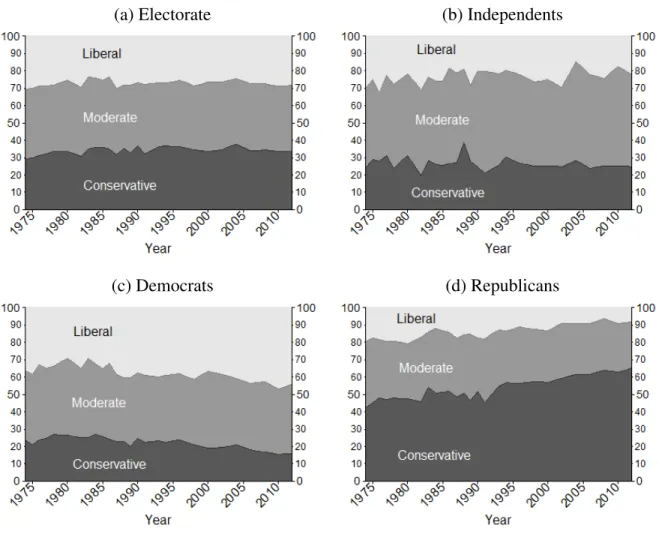
Using GSS data covering the years 1974 through 2012, I break down the proportion of
GSS respondents identifying as liberal, conservative, and moderate, in the electorate and
for Democratic, Republican, and independent identifiers.2,3These data are plotted in Figure
3.1.
Looking first at the electorate as a whole (see Panel (a), Figure 3.1), the modal
re-sponse throughout the period is the moderate identification, indicating that a plurality of
respondents identify as ideologically moderate for nearly the entire time period. This is
also the case with respondents who identify as independents in regard to their partisanship
(see Panel (b), Figure 3.1). The proportion of symbolic moderates increases from about 46
2Extremely liberal, liberal, and slightly liberal are all folded into the “liberal” category, while extremely conservative, conservative, and slightly conservative are all folded into the “conservative” category. Gaps in the GSS series are filled using linear interpolation.
(a) Electorate (b) Independents
(c) Democrats (d) Republicans
Source: General Social Survey.
Figure 3.1: Proportion of Liberal, Moderate, and Conservative Symbolic Identification in the Electorate and by Party Identification, 1974-2012.
percent of independents to nearly 60 percent in the early 1990s, before decreasing to the
mid 50s in the early 2010s. The moderate symbolic ideology always reaches a majority
among independents in the electorate. The proportion of symbolic moderates, however, is
lower among Democratic and Republican partisans in the electorate. But the difference is
not a large one. The proportion of symbolically moderate Democrats is relatively stable
through the entire series, never deviating from approximately 40 percent of Democratic
identifiers. Conversely, while Republicans have nearly the same proportion of symbolic
declines dramatically over time. By the mid-2000s only a quarter of Republicans state that
they are ideologically moderate, moderately increase by a few percent towards the end of
the decade.
Of greater interest is the rise of symbolic liberalism in Democrats and symbolic
con-servatism in Republicans over the course of these thirty-eight years, the ideologies we
typically associate the two parties with in modern American politics. The proportion of
Democrats who identify as symbolically liberal is 36 percent in the mid-1970s and
in-creases by approximately eight percent to 44 percent by the early 2010s (see Panel (c),
Figure 3.1). During this period, symbolical liberalism overtakes the symbolic moderate
identification as the modal response for Democrats in the electorate. However, the
propor-tion of moderate, Democratic identifiers remains stable, at around 40 percent, through the
entire series. The decline in symbolic conservatism within Democratic identifiers is picked
up by a rise in symbolic liberalism. In contrast, there is a steady decline in symbolic
lib-eralism for both independents and Republicans in the electorate over this period, which is
also true for the mass electorate. This result is consistent with recent findings by Ellis and
Stimson (2012) on the ideological self-identification of the electorate.
The decline in symbolic liberalism by Republicans in the electorate is accompanied by
a substantial increase in symbolic conservatism (see Panel (d), Figure 3.1). A plurality
of Republicans, slightly above 40 percent, identify as conservative in the mid-1970s and
this proportion increases to solid majority of 65 percent in 2012. The increase in symbolic
conservatism comes at the expense of both symbolic moderates and liberals within the set
of Republican partisans. Symbolic liberalism decreases from 20 percent in 1974 to less
than 10 percent in 2012, while the moderate identification decreases by nearly the same
percentage, going from 38 percent in 1974 to 26 percent in 2012. Within both parties
in the electorate, the symbolic ideological identity associated with each respective party
identification among partisans at the end of the period of analysis in 2014.
The large number of moderate identifiers within each group presented above might
cloud the picture as to the symbolic ideology of the parties in the electorate. Many
respon-dents may be unsure what “liberal” and “conservative” mean and thus choose the moderate
response as a safe response. At the same time, informed respondents with truly
mod-erate opinions may also choose the modmod-erate response. This makes it difficult to draw
information about self-identifying ideological moderates, as noted by Stimson (2004). To
gain a better perspective we can look at the symbolic ideology of mass Democrats and
Republicans by looking only at GSS respondents who identify as liberal or conservative,
eliminating those who choose the “moderate” response. Doing so provides better, more
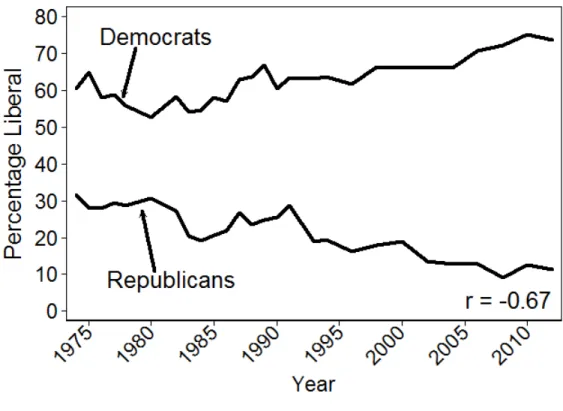
clear look at the trends of symbolic ideology within each party. Figure 3.2 plots the
sym-bolic liberalism of Democrats and Republicans in the electorate for the years 1974 through
2012.4
Figure 3.2 shows a clear polarization of symbolic ideology between the Democratic and
Republican Parties in the electorate over time. Looking only at Democratic and Republican
partisans who symbolically identify as liberal or conservative, there is a clear trend towards
liberalism within the Democratic Party and a strong trend towards conservatism within the
Republican Party. Democratic symbolic liberalism increases from around 60 percent in the
mid-1970s to a high of 75 percent in 2010, never falling below 50 percent. The decrease
in symbolic liberalism within the Republican Party in the electorate is much stronger shift,
starting at a high of nearly 32 percent in 1974 and declining to nearly 10 percent in 201,
with a low of nine percent in 2008). While the domination of the symbolic conservatism
continues in the mass electorate (Ellis and Stimson 2012), symbolic liberalism is steadily
increasing within the Democratic partisans.
Source: General Social Survey.
Figure 3.2: Symbolic Ideology by Party Identification, 1974-2012.
While Figure 3.2 show a clear polarization of symbolic ideology between Democratic
and Republican mass partisans over time, it is unclear what what this actually means for
the political system. It might be evidence of increasingly polarized mass parties or sorting,
but it is hardly indicative of polarizing ideological preferences on public policy between
Democrats and Republicans in the electorate. This is because of the disconnect between
symbolic ideology and ideological policy preferences. While a majority of Americans
identify as politically conservative, a majority of Americans also prefer liberal policy to
conservative policy (Stimson 2004; Ellis and Stimson 2012). This is a paradox scholars
have only recently began to investigate in detail. In the next section I go into further detail
3.2 Operational Ideology in the Electorate
As we saw in the previous chapter, a better understanding of the ideological preferences
of parties in the electorate can be had by looking at operational ideology. Even though
citizens may not speak in ideological terms (i.e. know what “liberal” and “conservative”
mean) ((Converse 1964)), they can and do express truly held policy preferences (Zaller
1992). In this section of the chapter I create measures of partisan moods using only GSS
data, in order to allow for a direct comparison with symbolic ideology from the same
data source. Similar to the measurement strategy employed in the previous chapter, I use
questions that generally ask respondents whether the federal government should do more
or less in a specific policy domain. The resulting measures of opinion are similar to the
measures of mood presented in the previous chapter, though as less precise and cover a
shorter time span.
3.2.1 Measuring Mood with the GSS
The GSS has asked 10 questions about preferences towards government spending on
general issue areas consistently over time. Responses to these questions are coded in the
liberal or conservative direction, based on preferences for more or less government where
“more” is the liberal position and “less” is the conservative position, with the exception
of foreign policy related items which are coded in the reverse.5 Principal components
factor analysis suggests that these questions load on one dimension, accurately capturing
preferences towards government spending across a variety of domains. These are issues
that we typically consider gauge preferences towards the scope of government. Included
in this dimension are preferences on traditional distributive and redistributive issues which
represent “who gets what” in American politics (Ura and Ellis 2008). More importantly,
it captures the traditional “liberal-conservative” conflict over the proper size and role of
government. Thus, this dimension is a suitable proxy on the conventional economic and
scope of government that has divided liberals and conservatives for the latter half of the
twentieth century.
Net liberal-conservative preference scores are created for each respondent in the GSS
by coding each of the ten questions in a liberal, neutral, or conservative direction and
summing across these ten questions for each respondent. Following Ura and Ellis’ (2008)
method, this yields score a for individuals that can range from -10 to +10 where higher
scores indicate higher levels of liberalism. I then take this scale and convert it to a scale
that ranges from zero to 100, resembling Stimson’s Policy Mood on which this measure is
based.
The next step is to stratify respondents by party. To do so I simply separate individuals
into Democrats, Republicans, and independents based on their self-reported party
identifi-cation as done above with symbolic ideology.6 I then aggregate across each set of identifiers
to create annual measures of partisan mood for Democrats, Republicans, and independents.
Gaps for years in which the GSS was not administered are filled using linear interpolation.
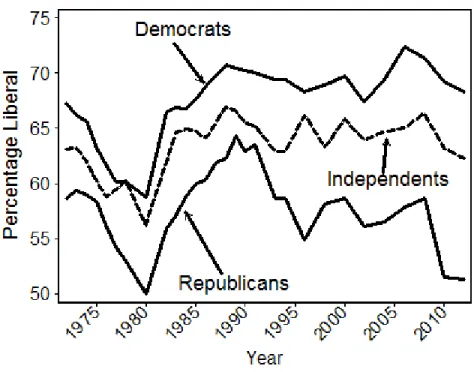
These measures of operational ideology, or “Mood,” for Democrats, Republicans, and
in-dependents in the electorate are displayed in Figure 3.3.
The operational ideology data show a different story than does symbolic ideology. Each
set of identifiers, Democrats, Republicans, and independents, all have an average
prefer-ence for liberal policy through the entire series. Unlike symbolic ideology, each group
indicates a preference for more liberal policy over time, on average. I will provide more
in-depth analysis of the operational ideology for Democrats, Republicans, and independents
below, with a more finely tuned measure of operational liberalism. But before moving on,
I want to delve further into the discrepancies between symbolic and operational ideology
at the mass party level.
Source: General Social Survey.
Figure 3.3: Operational Ideology by Party Identification, 1973-2012.
3.3 Comparing Operational and Symbolic Ideology
More can be learned about the ideological composition of the electorate and the mass
parties by comparing symbolic and operational ideology within and across each party in
the electorate. While both measures provide an answer as to how liberal or conservative
the public or parties in the electorate are, they have different meanings; only one tells us
about ideological policy preferences.
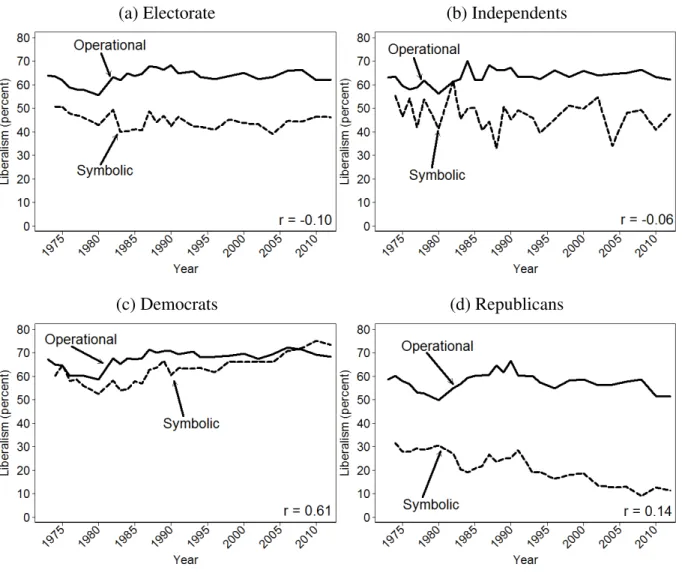
Figure 3.4 presents the comparisons of operational and symbolic ideology for the
elec-torate as a whole, independents, Democrats, and Republicans in the elecelec-torate over time.7
Panel (a) plots the symbolic and operational ideology of the entire electorate. The
differ-ence between symbolic and operational ideology is nearly 20 percent. At no point do the
two series overlap; operational ideology is always at a higher level than symbolic ideology.
(a) Electorate (b) Independents
(c) Democrats (d) Republicans
Source: General Social Survey.
Figure 3.4: Comparing Operational and Symbolic Ideology in the Electorate and by Party Identification, 1973-2012.
Further, the correlation between the symbolic ideology of the electorate and its operational
ideology is weak and negative (r=-0.10), consistent with previous findings on the
relation-ship between symbolic and operational ideology (Stimson 2004; Ellis and Stimson 2012).
There are similarly weak connections between the symbolic and operational forms of
ideology for independent and Republican identifiers. While independents (see Panel (b))
is slightly more than 15 percent. Again, operational ideological is consistently higher than
symbolic ideology for the entire series, though there is overlap in the range of each. While,
symbolic ideology is nearly identical to operational ideology in 1982, but the two series are
practically unrelated with a correlation ofr=-0.06.
The stark difference between operational and symbolic ideology is most striking for
Republicans in the electorate (see Panel (d), Figure 3.4). Republicans consistently prefer
liberal policy but also consistently identify as conservative. The difference between
op-erational and symbolic ideology in this case is staggering, with an average difference of
roughly 35 percent. The correlation between Republican operational ideology and
sym-bolic ideology is weak (r=0.14), which fits neatly with Ellis and Stimson’s 2012 recent
findings regarding conflicted conservatives.
The weak relationship between operational and symbolic ideology, however, does not
hold up for Democrats in the electorate (see Panel (c), Figure 3.4). In this case
opera-tional and symbolic ideology trend together and are similar in level. The average
differ-ence between symbolic and operational ideology for Democratic partisans is only about
five percent. Further, the two series correlated strongly at r=0.61. Considering the mass
electorate’s general disposition to favor liberal policy and Democratic partisans’ inclination
to identify as liberal, perhaps this strong relationship should not be surprising. Importantly,
this shows that operational and symbolic ideology are not completely disconnected.
3.4 Conclusion
Individuals who identify as liberal truly are liberal politically. Liberals do not conflate
their symbolic ideology with other meanings as individuals identifying as conservative are
prone to do. This may be due to a greater link between liberal and Democratic identities
than that between conservative and Republican identities. While the conservative
identi-fication can take on many different meanings to people who claim that identiidenti-fication, the
that represents liberals. In the chapters that follow I examine how these attitudes factor into
4 PARTISAN THERMOSTATS: OPINION CHANGE AND PUBLIC POLICY
The previous chapter introduced the measures of Democratic and Republican Moods
and discussed how these measures have ebbed and flowed over time. There was a clear
trend against the party of the president for both groups, but such trends are not meaningful
unless we can explain them and do so and provide clear evidence of causal effects. In this
chapter I investigate what causes these Moods to change. Specifically, I evaluate whether
or not Democrats and Republicans in the electorate respond similarly or distinctively to
changes in political stimuli. In an era where much talk is made of mass party polarization,
the opinion dynamics of the mass parties can help shed further light into the ongoing debate
(see Abramowitz 2011; Hetherington 2009; Fiorina, Abrams, and Pope 2005; Layman,
Carsey, and Horowitz 2006). Considering the contemporary political environment, it might
not be unexpected to find distinctive differences in partisan opinion change. If partisan
responses to political stimuli are different between Democrats and Republicans, then we
may be able to trace the relatively new phenomenon of mass party polarization to its origin.
However, using today’s politics to make judgements about opinion trends over time is not
a fruitful exercise and may bias our expectations towards finding evidence of polarizing
effects. Thus I use Wlezien’s (1995) model of opinion change to develop expectations
about the similarities or differences in partisan opinion dynamics. First, however, we need
to know how partisanship can affect opinion.
4.1 The Influence of Partisanship on Political Attitudes
Partisanship affects the perceptions, demands, and values that citizens hold towards
government and acts as a useful information tool to citizens (Bartels 2002; Campbell et al.
may hold differing perceptions and opinions towards government, partisanship may result
in distinctive differences in subgroup opinion change between Democrats and Republicans
in the electorate. Page and Shapiro (1992) find that partisan subgroups are nearly the only
subgroups in the population that indicate divergent opinions (on single issue items) over
time. Their results indicate that Republicans are the partisan group deviating from the
“tra-ditional” path, a finding further supported in recent work by Ura and Ellis (2012; see also
Soroka and Wlezien 2010). Page and Shapiro (1992, pp. 311) argue that these divergent
trends are “undoubtedly related to party leadership of opinion,” because citizens receive
and adjust their preferences from trusted, co-partisan cue-givers. However, this may not
be the case at all. In a more recent study Saeki (2013) finds that members of Congress do
not act as opinion leaders to their co-partisans in the electorate. Further, Enns and
Kell-stedt (2008) suggest that everyone responds in similar patterns to changes in the political
environment because everyone receives the same information.
It has also been demonstrated that public opinion is highly responsive to public policy
(Wlezien 1995, 2004; Erikson, MacKuen, and Stimson 2002). Here I focus on how the
main product of government, public policy, affects partisan opinion change. In addition to
policy outputs I also consider how party control of the White House might affect citizens
perceptions of public policy. I consider these two pieces, policy and party control, to be the
primary movers of public opinion and apply Wlezien’s (1995) thermostatic model to
gen-erate expectations about how the two parties in the electorate, the subgroups of Democratic
and Republican identifiers, respond to these primary movers.
4.2 The Thermostatic Model
Wlezien (1995) proposes a model of the policy making process in which the liberalism
of policy outcomes are a function of public opinion. The public acts like a thermostat and
policy makers act like a HVAC (Heating, Ventilation, and Air Conditioning) unit (or, more
temperature is colder than the preferred temperature, the public demands more heat and
signals a preference for more heat to policy makers. Policy makers respond by turning
on the furnace, increasing the temperature. As the temperature approaches the public’s
preferred temperature, the demand for more heat decreases. When the temperature gets too
hot for the public and moves beyond the public’s preferred temperature, the public demands
a cooler temperature. The cycle continues.
The relationship between public opinion and policy is similar. In policy terms, the
model suggests that the public has some ideological preference towards public policy.
When policy is more liberal than this preference, the public demands more conservative
policy; when policy is more conservative than this preference, the public demands more
liberal policy. The demand for more liberal or conservative policy sends a signal to policy
makers that policy has moved too far in one direction, to which the policy makers respond.
The public’s demand for policy change can be expressed as:
Rt=Pt∗−Pt
whereRis relative preferences,P∗is the public’s preferred level of policy,P is the current level of policy output, andtis a point in time. This is the thermostatic model.1
Relative preferences,R, are the focus here and are something political scientists know
quite a bit about. Stimson’s mood (1999; 1991) is an aggregate measure of the public’s
relative preferences, gauging whether or not the public demands more or less liberal policy
from government.2 By breaking down these demands by partisanship we can learn not only
1For a good, comprehensive illustration of the thermostatic model see Chapter 2 of Soroka and Wlezien (2010).
about the differences in policy demand between each set of partisans, but also how each
responds to changes in the policy environment.
4.3 Partisan Opinion and Public Policy: Applying the Thermostat
To generate expectations about how the average opinion of Democrats and Republicans
in the electorate change I apply the thermostatic model to both groups of partisan identifiers.
If the expectations for changes in Democratic and Republican opinion are the same, then
the application provides a policy-based theoretical underpinning for Page and Shapiro’s
(1992) finding of parallel publics.3 If the prediction yields an expectation of divergence,
then the application of the theory provides for a policy-based, thermostatic understanding
for mass party ideological polarization.
4.3.1 Modelling Aggregate Partisan Relative Preference Change
In generating expectations for Democratic and Republican opinion change in the
ther-mostatic context, it is first necessary to make assumptions about distribution of ideological
preferences for both parties in the electorate. In the terms of the thermostatic model, these
ideological preferences are absolute preferences,P∗.
Consider each party in the electorate as a collection of individuals identifying with the
same political party, Democratic or Republican. Assume that each individual has some
la-tent absolute preference towards the scope of government along the right-left,
conservative-liberal ideological spectrum and these absolute preferences are fixed over time. For intuitive
purposes, let’s assume cardinal utility and that this ideological spectrum is on a scale that
ranges from 0 to 100 for both absolute policy preferences and policy where higher values
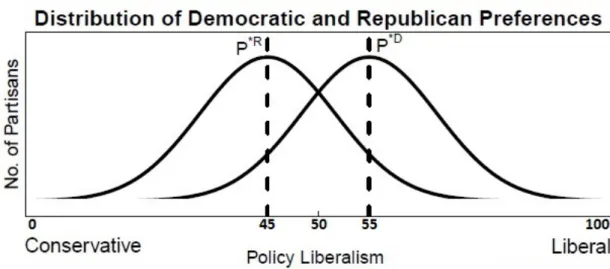
are more liberal. Next assume that the mean absolute preference of Republican identifiers
is 45, the mean absolute preference of Democratic identifiers is 55, and that individual
pref-erences within each party are distributed standard normal within this policy space.4 Thus
Note: Hypothetical distribution of absolute preferences for Democrats and Republicans. P∗D is the
cen-tral tendency of Democratic absolute preferences andP∗R is the central tendency of Republican absolute
preferences.
Figure 4.1: Partisan Distribution of Preferences
we have a policy space in which the variance of absolute preferences for both the
Demo-cratic and Republican parties in the electorate is standardized, and Democrats are more
liberal than Republicans, on average.5 These hypothetical distributions are displayed in
Figure 4.1, whereP∗RandP∗D indicate the median preferred level of policy, or absolute
preference, for the Republican and Democratic Parties in the electorate, respectively.
The next step is to consider the relative preferences (R) of Democratic and Republican
partisans. Relative preferences are the difference between absolute preferences and policy.
In the aggregate, we can observe the proportion of partisan identifiers who prefer more
liberal (or conservative) policy than the status quo to get a mean relative preference for
Democrats and Republicans in the electorate.6 This is a party in the electorate’s relative
preference. With these assumptions and definitions in place, we can input policy into the
preferences change when policy changes. The logic is more general.
5This assumption of a standard normal distribution is in place for computational simplicity, allowing for the direct comparison of relative preference change between the parties in this hypothetical exercise.
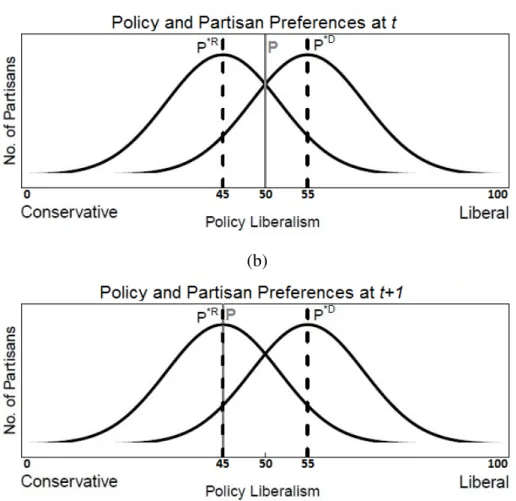
(a)
(b)
Note: These figures show Democratic and Republican preferences in the electorate timetwhere policy is
located at 50 and timet+1where policy is at 45.P∗Dis the central tendency of Democratic absolute
preferences,P∗Ris the central tendency of Republican absolute preferences, andPis policy. Figures not to
scale.
Figure 4.2: Policy and Relative Preference Change from Timettot+1.
same ideological space to observe changes the relative preferences of the two parties in the
electorate.
Let’s start with the assumption that policy is located at 50 on our hypothetical policy
continuum, which is the center of policy space, at time t. Individuals with an absolute
preference greater than 50 prefer more liberal policy, while individuals with an absolute