TRACE ELEMENT PARTITIONING BETWEEN TITANITE AND GROUNDMASS IN SILICIC VOLCANIC SYSTEMS
Michael Robert Ackerson
A thesis submitted to the faculty of the University of North Carolina at Chapel Hill in partial fulfillment of the requirements for the degree of Master of Science in the Department of Geological Sciences.
Chapel Hill 2011
Approved by: Allen F. Glazner
ABSTRACT
MICHAEL R. ACKERSON: Trace Element Partitioning Between Titanite and Groundmass in Silicic Volcanic Systems
(Under the direction of Dr. Allen F. Glazner)
Data for titanite and groundmass from seven Tertiary ignimbrites show a wide range of titanite trace-element concentrations and partitioning values. The range of partitioning values is due to lattice strain (with an ideal radius near Gd) and melt polymerization and is likely affected by the water content of the melt. The REEs, Y, Sc, Th and U are compatible in titanite whereas Rb, Sr, Ba and Pb are incompatible. Sector and growth zoning in titanite indicate disequilibrium crystal growth. Furthermore, differences in zoning, chemical
iii
ACKNOWLEDGEMENTS
I would like to acknowledge and thank my advisor Dr. Allen F. Glazner for his direction, scientific insight and guidance, which have been fundamental to the completion of this project and my growth as a scientist. I would also like to thank my committee member Dr. Drew Coleman for his support, perspective, comments and edits, and my committee member Dr. Jonathan Lees for his encouragement and assistance.
This project could not have been completed without the help of Drs. Alan Boudreau and Gary Dwyer of Duke University, Dr. Sohrab Habibi from the UNC Chemistry
TABLE OF CONTENTS
LIST OF TABLES……….v
LIST OF FIGURES………..vi
LIST OF SYMBOLS………...vii
Chapter I. INTRODUCTION………..1
Geologic Background………3
Geology of Samples……….10
II. METHODS………..16
III. RESULTS………...19
Data Quality and Reproducibility of Results………...36
IV. DISCUSSION………41
Integrity of the Groundmass………41
Trace Element Partitioning………..44
Lattice Strain………46
Melt Polymerization……….48
v
LIST OF TABLES Table
1. Sample locations and mineral assemblages………...11
2. Major-element compositions of volcanic groundmass………..14
3. Trace-element concentrations of titanite crystals………..21
4. Trace-element concentrations in volcanic groundmass……….26
5. Major-element compositions of selected titanite grains………29
6. Titanite/groundmass partitioning values for volcanic titanite crystals…………..30
LIST OF FIGURES Figure
1. Structure and chemical substitutions in titanite………...4
2. Titanite stability in T-fO2 space………...7
3. Sector zoning and coupled substitution in titanite………...9
4. Trace-element concentrations in volcanic titanite……….33
5. Trace-element concentrations in volcanic groundmass……….34
6. Titanite/groundmass trace-element partitioning values……….35
7. Monte Carlo simulation of Ce partitioning values in Fish Canyon Tuff………...39
8. Model of plagioclase contamination in Fish Canyon Tuff………43
9. Effect of melt composition and pressure on partitioning in experimental systems adapted from Green and Pearson (1985)………...45
10. Lattice strain modeling………..47
11. Effect of melt polymerization on partitioning values………...51
12. Sector and growth zoning in titanite from plutonic and volcanic rocks………...53
13. Rare earth element concentrations in plutonic and volcanic titanite………55
14. Al+Fe versus Ti in plutonic and volcanic titanite……….56
vii
LIST OF ABBREVIATIONS AND SYMBOLS
ASI aluminum saturation index
Cg concentration in groundmass
Cl concentration in liquid
Ct concentration in titanite
Ct/Cg partitioning value
fO2 oxygen fugacity
HFSE high field strength element
ICP-MS inductively coupled plasma mass spectrometer LILE large ion lithophile element
LSM lattice strain model
mt mass of titanite
NBO/T non-bridging oxygen/ tetrahedrally coordinated cation
REE rare earth element
RSD relative standard deviation
T temperature
vl volume of liquid
I. INTRODUCTION
A primary goal of igneous petrology is to investigate the structural and chemical evolution of the continents. Fundamental to this goal is a need to understand how plutonic and volcanic rocks form, including the petrogenetic connections between them. Because mineral and melt trace-element compositions are sensitive to changes in temperature and pressure, they can yield information about the chemical and physical changes of a magma system that may not be reflected in the major element composition of the resultant rocks. In this way, trace-element analysis is a valuable tool that can provide insight toward
understanding the processes that govern the formation of igneous rocks.
Accessory minerals provide insight into the trace-element composition of a rock and thereby help address questions about the formation of silicic plutonic and volcanic rocks and how they are related. Despite their low abundance, accessory minerals often contain a substantial portion of their host rock’s trace element budget. Titanite
((Ca,REE3+,Y)(Ti,Al,Fe3+)(O,F,OH)SiO4) is an example of such an accessory mineral. It
2
makes it useful when determining the connection between plutonic and volcanic rocks (Glazner et al., 2008). In addition, titanite contains high enough concentrations of uranium to make it a useful mineral in geochronology (Zhang and Scharer 1996, Frost et al. 2000).
In order to accurately predict the effect of titanite crystallization on the composition of the melt and other phases, it is necessary to understand the degree to which titanite partitions trace elements in silicic systems and the factors affecting this partitioning. The trace-element content of titanite (and other minerals) is affected by factors that include lattice strain, melt polymerization and the water content of the melt. Partitioning values (defined as the ratio of an element’s concentration in titanite compared to its concentration in the glass or groundmass) are a direct way to study the interaction between titanite and melt. Trace
elements that fit most readily into a lattice site will impart the least amount of stress and strain on a crystal and will therefore be preferred in the crystal over more poorly fitting elements. This results in higher partitioning values for elements that have a better fit with the crystal lattice structure of titanite. Moreover, as the melt from which titanite is crystallizing becomes more polymerized, the compatibility of trace elements in the melt will change (Watson 1976, Watson 1977, Prowatke and Klemme 2005). Because the water content of a melt plays an important role in controlling melt polymerization, it too can affect trace-element partitioning into titanite.
crystals in volcanic rocks therefore can provide an important first step into understanding the partitioning behavior of trace elements in plutonic rocks.
In this study, I explore the titanite/glass equilibrium in samples collected from Tertiary ignimbrites from the western United States and compare them with data for associated plutonic rocks and plutonic rocks of the Mesozoic Sierra Nevada batholith. The data suggest that partitioning values for volcanic titanite crystals are controlled by lattice strain and melt polymerization, and are likely affected by the water content of the melt. In addition, plutonic and volcanic titanite crystals exhibit distinct differences in their trace-element content, zoning and substitution mechanisms. This finding belies crystallization from similar systems and is consistent with the idea that most volcanic titanite forms through typical down-T crystallization of high melt-fraction systems whereas plutonic titanite forms at near- or sub-solidus conditions as is demonstrated for other phases in plutonic rocks.
Geologic Background
Titanite is an orthosilicate mineral whose structure allows for several significant substitutions. Its mineral structure consists of chains of Ti octahedra bounded by Si
4
In many igneous rocks, titanite crystals contain most of the REEs (Gromet and Silver 1983). Despite this, little work has been published on REE concentrations in titanite from silicic volcanic systems. Whereas determinations of trace element concentrations of titanite crystals in plutonic rocks are common (Simmons and Hedge 1978, Noyes et al. 1983, Broska et al. 2007), only a few studies have looked at volcanic titanite (Giannetti and Luhr 1983, Belkin et al. 1996, Della Ventura et al. 1999, Bachmann et al. 2005). Of partitioning studies in volcanic rocks, only one was performed using laser-ablation ICP-MS—the preferred modern method of trace-element data collection (Bachmann et al. 2005). Other studies collected data using electron microprobe analysis (Gianetti and Luhr 1983, Belkin et al. 1996).
The paucity of REE data for volcanic titanite is mirrored by the limited research on the conditions of titanite crystallization in magmatic systems. Titanite commonly occurs in intermediate to felsic igneous rocks, and a range of metamorphic conditions from
low-pressure contact metamorphism of marls and limestones (Frost et al. 2000, Xirouchakis et al. 2001) to eclogite facies metamorphism of mafic igneous rocks (Oberti et al. 1991). In
igneous rocks, the timing of the first appearance of titanite during crystallization is under debate. Bateman and Chappell (1979) used the euhedral crystal shape of titanite crystals in the Tuolumne Intrusive Suite of Yosemite National Park, California to infer early
6
1971, Whitney and Stormer 1985, Nakada 1991). The relationship between titanite stability and oxygen fugacity is displayed in figure 2, which shows the fO2-T relations of
titanite-bearing and titanite-absent dacitic and rhyolitic volcanic rocks from the western United States. Titanite-bearing rocks typically occur closer to the hematite-magnetite buffer curve, whereas titanite-absent rocks are found closer to the nickel-nickel oxide buffer curves. Wones (1989) attributes this to the reactions:
titanite + magnetite + quartz = hedenbergite + ilmenite + O2 (1)
3CaTiSiO5 + 2Fe3O4 + 3SiO2 = 3CaFeSi2O6 + 3FeTiO3 + O2
where increasing oxidation favors the left side of the reaction.
Frost et al. (2000) deemed reaction (1) to be a function of oxygen fugacity, bulk chemistry and melt phase chemistry. They also considered the reaction:
titanite + annite = K-feldspar + ilmenite + quartz + CaO + H2O (2)
3CaTiSiO5 + KFe3AlSi3O10(OH)2 = KAlSi3O8 + 3FeTiO3 + 3SiO2 + 3CaO(l) + H2O(l)
where CaO and H2O are components of the melt phase.
Other intensive parameters can also affect titanite partitioning. Xirouchakis et al. (2001a,b) inferred a strong experimental correlation between T, fO2, the activity of SiO2
partition coefficients of REEs increase with increasing SiO2 in the melt phase, decreasing
8
Titanite crystals in both volcanic and plutonic rocks typically exhibit sector-zoned cores (Fig. 3) with growth (oscillatory) zoned rims, demonstrating disequilibrium crystal growth (Paterson and Stephens 1992, Shore and Fowler 1996). The formation of sector zoning is aided by factors including rapid crystal growth and anisotpopic incorporation of trace elements along the crystals surface (Watson and Liang, 1995). In igneous titanite, crystal growth is predominantly along the {111} crystal faces. When crystal growth is rapid, slow-growing faces dominate the crystal morphology. Coupled with differences in crystal face growth rates is the anisotropic preference for the REEs and Y to occur along the {100} sectors, whereas Al and Fe occur preferentially along the {111} sectors (Paterson and Stephens, 1992).
Because disequilibrium zoning in igneous titanite is commonplace (Paterson and Stephens 1992, Vuorinen and Halenius 2005, McLeod et al. 2011), mineral/groundmass partitioning values cannot be considered equilibrium partition coefficients. Disequilibrium partitioning values should be used with reserve when being applied to equilibrium
fractionation models. The interpretation of zoning patterns in minerals (in particular oscillatory zoning) is dependent upon their formational environment. Elements with
10
discussed by Johnson and Glazner, 2010) will exhibit oscillatory zoning that is a
consequence of thermally induced periods of melt creation and subsequent crystal growth.
Geology of Samples
Volcanic and plutonic samples collected for this study (Table 1) are part of the silicic ignimbrite flare-up that occurred in the western United States during the Cenozoic Era and range in age from Eocene to Miocene (36.7-11.3 Ma). Additionally, data are presented for plutonic rocks of the Mesozoic Sierra Nevada batholith (Gaschnig 2005, Davis et al. 2011). Volcanic rocks sampled range in composition from dacite to rhyolite and vary widely in crystallinity, temperature and water content. Plutonic rocks are quartz monzonites and granodiorites.
Two samples were analyzed from the Timber Mountain-Oasis Valley Caldera complex of southwestern Nevada—a pumice sample from the Ammonia Tanks Member of the Timber Mountain caldera and a whole-rock sample from the Tiva Canyon Member of the Oasis Valley caldera. Both units are rhyolitic ash-flow tuffs. The tuffs existed as relatively dry magmas (1-2 wt% H2O) and formed at temperatures ranging from 816 °C for the
Ammonia Tanks to 838 °C for Tiva Canyon (Lipman 1966, Byers et al. 1976, Christiansen et al. 1977, Broxton et al. 1989, Mills et al. 1997, Bindeman et al. 2006).
The Fish Canyon Tuff and Pagosa Peak dacite from the La Garita caldera system in the San Juan volcanic field of Colorado were also analyzed. The Fish Canyon magma system is thought to be a reactivated plutonic system that erupted nearly homogeneous crystal-rich dacitic magma in three stages. The Pagosa Peak dacite is a precursor to the main unit erupted from the caldera, the Fish Canyon Tuff. The Fish Canyon magma system existed at
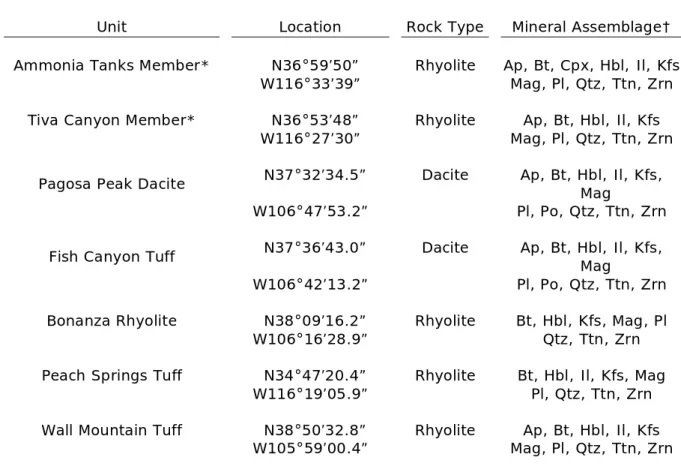
Table 1: Sample locations and mineral assemblages
Unit Location Rock Type Mineral Assemblage†
Ammonia Tanks Member* N36°59’50” Rhyolite Ap, Bt, Cpx, Hbl, Il, Kfs
W116°33’39” Mag, Pl, Qtz, Ttn, Zrn
Tiva Canyon Member* N36°53’48” Rhyolite Ap, Bt, Hbl, Il, Kfs
W116°27’30” Mag, Pl, Qtz, Ttn, Zrn
Pagosa Peak Dacite N37°32’34.5” Dacite Ap, Bt, Hbl, Il, Kfs, Mag
W106°47’53.2” Pl, Po, Qtz, Ttn, Zrn
Fish Canyon Tuff N37°36’43.0” Dacite Ap, Bt, Hbl, Il, Kfs,
Mag
W106°42’13.2” Pl, Po, Qtz, Ttn, Zrn
Bonanza Rhyolite N38°09’16.2” Rhyolite Bt, Hbl, Kfs, Mag, Pl
W106°16’28.9” Qtz, Ttn, Zrn
Peach Springs Tuff N34°47’20.4” Rhyolite Bt, Hbl, Il, Kfs, Mag
W116°19’05.9” Pl, Qtz, Ttn, Zrn
Wall Mountain Tuff N38°50’32.8” Rhyolite Ap, Bt, Hbl, Il, Kfs
W105°59’00.4” Mag, Pl, Qtz, Ttn, Zrn
*Samples collected by Frost (1987), donated to project from the scientific collections at Michigan State University by Dr. Thomas Vogel.
†Mineral abbreviations from Kretz (1983): Ap=apatite, Bt=biotite, Cpx=clinopyroxene, Hbl=hornblende, Il=ilmenite, Kfs=K-feldspar, Mag=magnetite, Pl=plagioclase,
12
et al. 1997, Bachmann et al. 2002, Bachmann et al 2008, Lipman and McIntosh 2008). The Fish Canyon Tuff sample was collected from the type locality of the Ar-Ar sanidine standard FCs (Renne et al. 1998).
Three other samples were analyzed from the San Juan volcanic field. These include volcanic samples from the phenocryst-poor rhyolitic Bonanza Tuff (Varga and Smith 1984, Lipman and McIntosh 2008) and the low-silica rhyolite Wall Mountain Tuff (Chapin and Lowell 1979, McIntosh and Chapin 2004) and a plutonic sample from a quartz monzonite of the Mount Princeton Batholith (Lipman 2007, Lipman and McIntosh 2008).
A final volcanic sample was analyzed from the high-K rhyolite Peach Springs Tuff of
California (Glazner et al. 1986, Glazner 1988, Pamukcu 2010). Although the titanite grains in this sample were euhedral and unaltered, much of the groundmass was altered to either zeolite or clay (likely montmorillonite). This alteration is evident in the major-element analyses of the Peach Springs Tuff “groundmass” (Table 2). Because the REEs are relatively immobile in groundmass during alteration (Zielinski 1982), they may not have moved when the groundmass was altered, and the REE analyses may be more or less the same as the initial groundmass concentration. Still, the partitioning values determined for the Peach Springs Tuff may not accurately represent the partitioning behavior between titanite crystals and melt.
To study the differences between plutonic and volcanic titanite crystals, samples were also analyzed from the Sierra Nevada Batholith. Two samples were analyzed from the John Muir Intrusive Suite of the Sierra Nevada Batholith–a sample of the Lake Edison
14
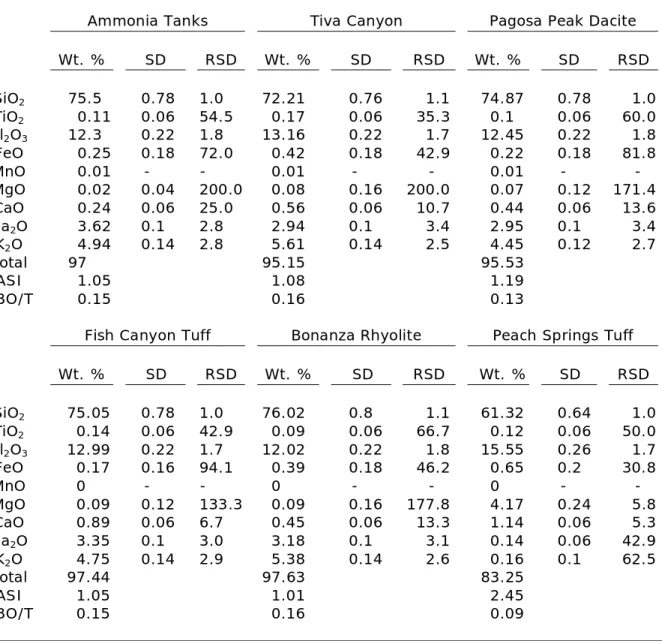
Table 2: Major-element compositions of volcanic groundmass*
Ammonia Tanks Tiva Canyon Pagosa Peak Dacite
Wt. % SD RSD Wt. % SD RSD Wt. % SD RSD
SiO2 75.5 0.78 1.0 72.21 0.76 1.1 74.87 0.78 1.0
TiO2 0.11 0.06 54.5 0.17 0.06 35.3 0.1 0.06 60.0
Al2O3 12.3 0.22 1.8 13.16 0.22 1.7 12.45 0.22 1.8
FeO 0.25 0.18 72.0 0.42 0.18 42.9 0.22 0.18 81.8
MnO 0.01 - - 0.01 - - 0.01 - -
MgO 0.02 0.04 200.0 0.08 0.16 200.0 0.07 0.12 171.4
CaO 0.24 0.06 25.0 0.56 0.06 10.7 0.44 0.06 13.6
Na2O 3.62 0.1 2.8 2.94 0.1 3.4 2.95 0.1 3.4
K2O 4.94 0.14 2.8 5.61 0.14 2.5 4.45 0.12 2.7
Total 97 95.15 95.53
ASI 1.05 1.08 1.19
NBO/T 0.15 0.16 0.13
Fish Canyon Tuff Bonanza Rhyolite Peach Springs Tuff
Wt. % SD RSD Wt. % SD RSD Wt. % SD RSD
SiO2 75.05 0.78 1.0 76.02 0.8 1.1 61.32 0.64 1.0
TiO2 0.14 0.06 42.9 0.09 0.06 66.7 0.12 0.06 50.0
Al2O3 12.99 0.22 1.7 12.02 0.22 1.8 15.55 0.26 1.7
FeO 0.17 0.16 94.1 0.39 0.18 46.2 0.65 0.2 30.8
MnO 0 - - 0 - - 0 - -
MgO 0.09 0.12 133.3 0.09 0.16 177.8 4.17 0.24 5.8
CaO 0.89 0.06 6.7 0.45 0.06 13.3 1.14 0.06 5.3
Na2O 3.35 0.1 3.0 3.18 0.1 3.1 0.14 0.06 42.9
K2O 4.75 0.14 2.9 5.38 0.14 2.6 0.16 0.1 62.5
Total 97.44 97.63 83.25
ASI 1.05 1.01 2.45
NBO/T 0.15 0.16 0.09
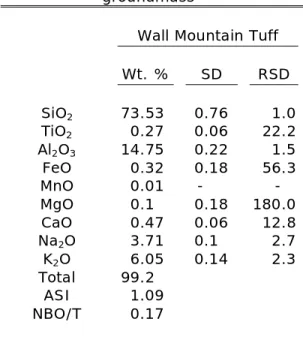
Table 2 (cont’d): Major-element
compositions of volcanic groundmass*
Wall Mountain Tuff
Wt. % SD RSD
SiO2 73.53 0.76 1.0
TiO2 0.27 0.06 22.2
Al2O3 14.75 0.22 1.5
FeO 0.32 0.18 56.3
MnO 0.01 - -
MgO 0.1 0.18 180.0
CaO 0.47 0.06 12.8
Na2O 3.71 0.1 2.7
K2O 6.05 0.14 2.3
Total 99.2
ASI 1.09
NBO/T 0.17
II. METHODS
Titanite crystals and groundmass were separated from bulk rock samples using
standard techniques including steel-plate disc milling, water tabling, methylene iodide
density separation and magnetic separation. Once separated from the other phases, titanite
crystals were selected for analysis on the basis of euhedral crystal shape and lack of
inclusions (to reduce trace-element contamination). Primary crystal and groundmass
selection was performed using a non-polarized binocular microscope. Selected crystals and
groundmass were scrutinized under cross-polarized light to identify any inclusions that may
have been missed in ordinary light.
Inclusion-free titanite and groundmass samples were weighed and prepared for
solution ICP-MS analysis. Titanite crystals were separated into replicate groups (6-18
crystals/replicate) and weighed using a Sartorius 4504 MP8 Ultra Micro balance with an
accuracy of ± 0.2 μg. Because volcanic groundmass can contain up to 300 times lower REE
concentrations than titanite crystals (Bachmann et al. 2005), the mass of groundmass
analyzed was approximately 250-300 times greater than the mass of titanite analyzed. Once
weighed, the crystal and groundmass replicate groups were placed individually in 4:1
mixtures of concentrated HF and HNO3 in a tightly sealed Teflon beaker and dissolved on a
130°C hot plate for five days. After this interval, the beakers were placed in an ultrasonic
cleaner for 30-90 minutes. The solutions were dried and re-dissolved in 5% HNO3 for
Once dissolved in HNO3, titanite and groundmass trace-element compositions were
analyzed using solution ICP-MS on a Varian 820 ICP-MS. Calibration curves were created using the Claritas PPT multi-element standard solutions CLMS-1 and CLMS-2 from SPEX CertiPrep. Analyte concentrations were recorded as concentrations (ppb) in the analyzed solution. Concentrations in titanite were calculated using:
(1)
where Ct is the concentration in titanite (ppm), Cl is the concentration in the liquid analyte in
ppm, and mt and vl are the masses of the titanite crystals and the volume of the liquid, respectively. l is the density of the liquid, which is assumed to be 1 g/cm3.
18
corrections were performed using SX logger software. The beam was run at 15 keV and 20
nA, with a spot size of 10 μm. Elements were standardized to a suite of silicate mineral
standards. Groundmass samples were analyzed using a Cameca Camebax electron probe
micro-analyzer (EPMA) at Duke University. Data correction was performed using ZAF
correction in the Cameca PAP software. The beam spot size was typically 10-15 μm, with an
accelerating voltage of 15 keV and a beam current of 15 nA. Volcanic groundmass was
III. RESULTS
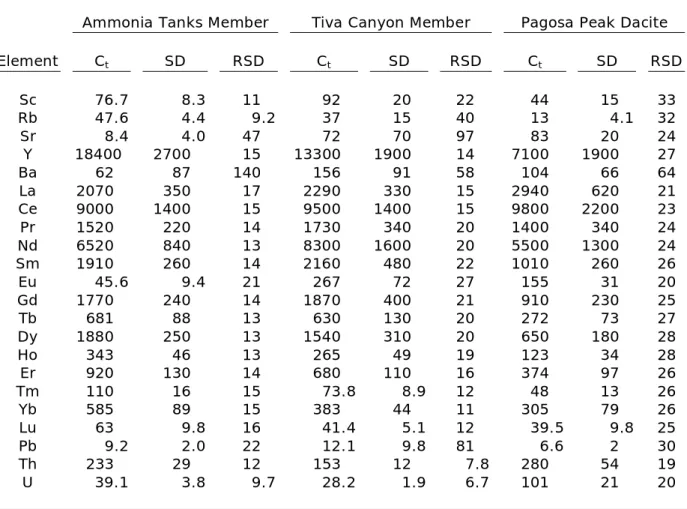
Trace-element concentrations in plutonic and volcanic titanite crystals are in good agreement with laser ablation ICP-MS analyses of plutonic titanite (Marks et al., 2008) and volcanic titanite from the Fish Canyon Tuff and Pagosa Peak dacite (Bachmann et al., 2005). Overall, concentrations of individual elements range over an order of magnitude between samples (Table 3, Fig. 4). Titanite crystals of the Fish Canyon Tuff and Pagosa Peak dacite contain the lowest REE concentrations of the volcanic samples and are similar in trace-element composition to the plutonic titanite crystals. REE concentrations in the Bonanza Rhyolite and Ammonia Tanks Member are greater than concentrations previously reported for any titanite. All titanite samples exhibit Eu anomalies.
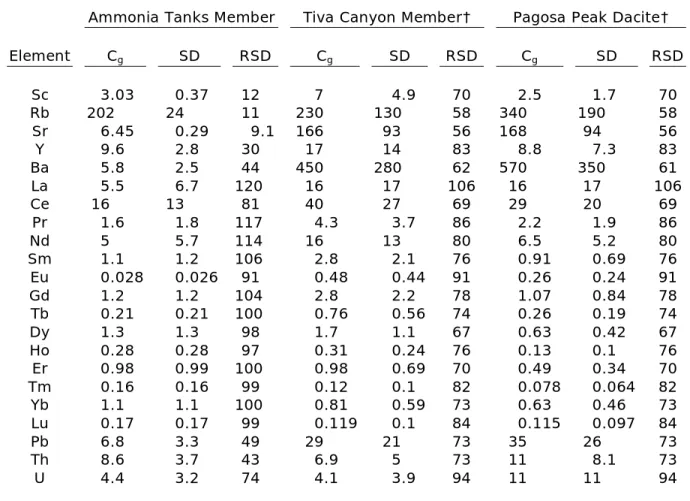
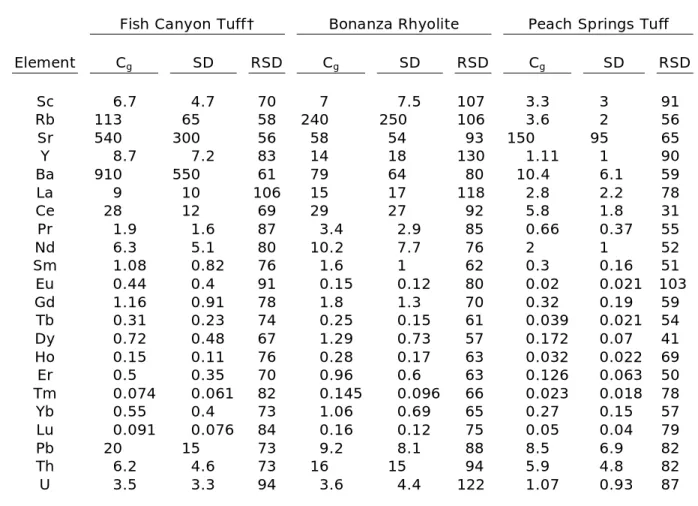
Groundmass trace-element concentrations are highly variable, but also significantly lower than titanite concentrations (Table 4, Fig. 5). The Ammonia Tanks Member and Peach Springs Tuff have the lowest trace-element concentrations, whereas the Wall Mountain Tuff and Tiva Canyon Member have the highest concentrations. Groundmass Eu anomalies are all negative except for a small positive anomaly in Fish Canyon Tuff groundmass.
20
silica (around 75 wt% SiO2). Major-element analyses of the groundmass yields totals
averaging above 95%.
Table 3: Trace-element concentrations of titanite crystals.*
Ammonia Tanks Member Tiva Canyon Member Pagosa Peak Dacite
Element Ct SD RSD Ct SD RSD Ct SD RSD
Sc 76.7 8.3 11 92 20 22 44 15 33
Rb 47.6 4.4 9.2 37 15 40 13 4.1 32
Sr 8.4 4.0 47 72 70 97 83 20 24
Y 18400 2700 15 13300 1900 14 7100 1900 27
Ba 62 87 140 156 91 58 104 66 64
La 2070 350 17 2290 330 15 2940 620 21 Ce 9000 1400 15 9500 1400 15 9800 2200 23 Pr 1520 220 14 1730 340 20 1400 340 24 Nd 6520 840 13 8300 1600 20 5500 1300 24 Sm 1910 260 14 2160 480 22 1010 260 26
Eu 45.6 9.4 21 267 72 27 155 31 20
Gd 1770 240 14 1870 400 21 910 230 25
Tb 681 88 13 630 130 20 272 73 27
Dy 1880 250 13 1540 310 20 650 180 28
Ho 343 46 13 265 49 19 123 34 28
Er 920 130 14 680 110 16 374 97 26
Tm 110 16 15 73.8 8.9 12 48 13 26
Yb 585 89 15 383 44 11 305 79 26
Lu 63 9.8 16 41.4 5.1 12 39.5 9.8 25
Pb 9.2 2.0 22 12.1 9.8 81 6.6 2 30
Th 233 29 12 153 12 7.8 280 54 19
U 39.1 3.8 9.7 28.2 1.9 6.7 101 21 20
22
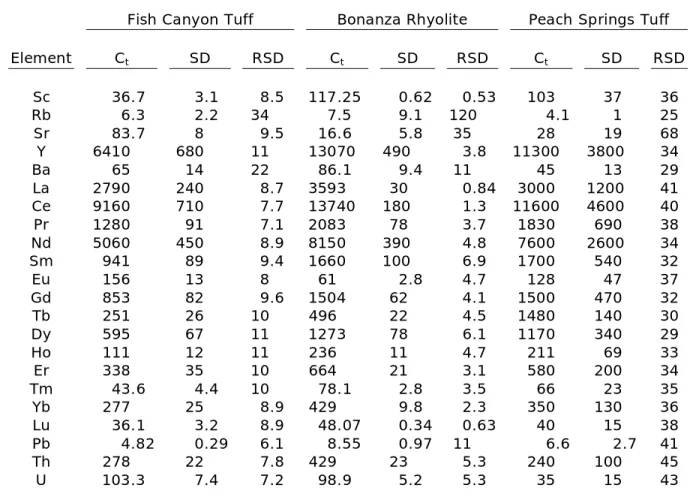
Table 3 (cont’d): Trace-element concentrations of titanite crystals.*
Fish Canyon Tuff Bonanza Rhyolite Peach Springs Tuff
Element Ct SD RSD Ct SD RSD Ct SD RSD
Sc 36.7 3.1 8.5 117.25 0.62 0.53 103 37 36
Rb 6.3 2.2 34 7.5 9.1 120 4.1 1 25
Sr 83.7 8 9.5 16.6 5.8 35 28 19 68
Y 6410 680 11 13070 490 3.8 11300 3800 34
Ba 65 14 22 86.1 9.4 11 45 13 29
La 2790 240 8.7 3593 30 0.84 3000 1200 41
Ce 9160 710 7.7 13740 180 1.3 11600 4600 40
Pr 1280 91 7.1 2083 78 3.7 1830 690 38
Nd 5060 450 8.9 8150 390 4.8 7600 2600 34
Sm 941 89 9.4 1660 100 6.9 1700 540 32
Eu 156 13 8 61 2.8 4.7 128 47 37
Gd 853 82 9.6 1504 62 4.1 1500 470 32
Tb 251 26 10 496 22 4.5 1480 140 30
Dy 595 67 11 1273 78 6.1 1170 340 29
Ho 111 12 11 236 11 4.7 211 69 33
Er 338 35 10 664 21 3.1 580 200 34
Tm 43.6 4.4 10 78.1 2.8 3.5 66 23 35
Yb 277 25 8.9 429 9.8 2.3 350 130 36
Lu 36.1 3.2 8.9 48.07 0.34 0.63 40 15 38
Pb 4.82 0.29 6.1 8.55 0.97 11 6.6 2.7 41
Th 278 22 7.8 429 23 5.3 240 100 45
U 103.3 7.4 7.2 98.9 5.2 5.3 35 15 43
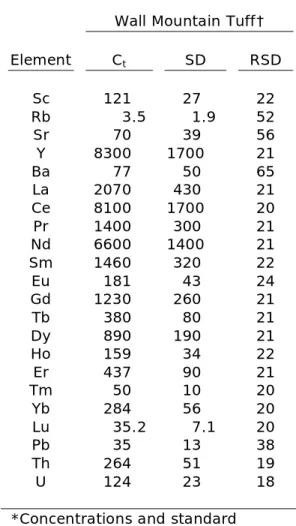
Table 3 (cont’d): Trace-element
concentrations of titanite crystals.*
Wall Mountain Tuff†
Element Ct SD RSD
Sc 121 27 22
Rb 3.5 1.9 52
Sr 70 39 56
Y 8300 1700 21
Ba 77 50 65
La 2070 430 21 Ce 8100 1700 20 Pr 1400 300 21 Nd 6600 1400 21 Sm 1460 320 22 Eu 181 43 24 Gd 1230 260 21
Tb 380 80 21
Dy 890 190 21
Ho 159 34 22 Er 437 90 21
Tm 50 10 20
Yb 284 56 20
Lu 35.2 7.1 20
Pb 35 13 38
Th 264 51 19 U 124 23 18
*Concentrations and standard deviation (2) are in ppm. RSD is reported in %.
24
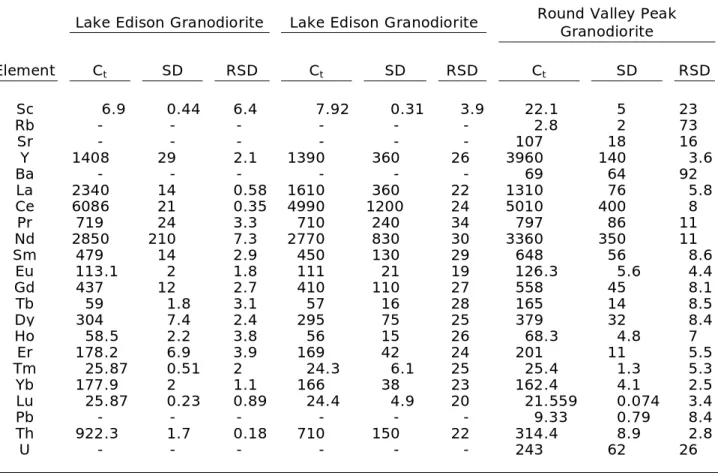
Table 3 (cont’d): Trace-element concentrations of titanite crystals.*
Lake Edison Granodiorite Lake Edison Granodiorite Round Valley Peak Granodiorite
Element Ct SD RSD Ct SD RSD Ct SD RSD
Sc 6.9 0.44 6.4 7.92 0.31 3.9 22.1 5 23
Rb - - - - - - 2.8 2 73
Sr - - - - - - 107 18 16
Y 1408 29 2.1 1390 360 26 3960 140 3.6
Ba - - - - - - 69 64 92
La 2340 14 0.58 1610 360 22 1310 76 5.8
Ce 6086 21 0.35 4990 1200 24 5010 400 8
Pr 719 24 3.3 710 240 34 797 86 11
Nd 2850 210 7.3 2770 830 30 3360 350 11
Sm 479 14 2.9 450 130 29 648 56 8.6
Eu 113.1 2 1.8 111 21 19 126.3 5.6 4.4
Gd 437 12 2.7 410 110 27 558 45 8.1
Tb 59 1.8 3.1 57 16 28 165 14 8.5
Dy 304 7.4 2.4 295 75 25 379 32 8.4
Ho 58.5 2.2 3.8 56 15 26 68.3 4.8 7
Er 178.2 6.9 3.9 169 42 24 201 11 5.5
Tm 25.87 0.51 2 24.3 6.1 25 25.4 1.3 5.3
Yb 177.9 2 1.1 166 38 23 162.4 4.1 2.5
Lu 25.87 0.23 0.89 24.4 4.9 20 21.559 0.074 3.4
Pb - - - - - - 9.33 0.79 8.4
Th 922.3 1.7 0.18 710 150 22 314.4 8.9 2.8
U - - - - - - 243 62 26
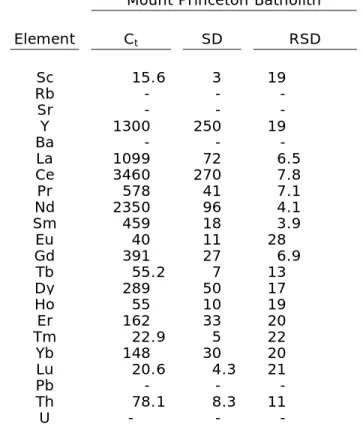
Table 3 (cont’d): Trace-element
concentrations of titanite crystals.*
Mount Princeton Batholith
Element Ct SD RSD
Sc 15.6 3 19
Rb - - -
Sr - - -
Y 1300 250 19
Ba - - -
La 1099 72 6.5
Ce 3460 270 7.8
Pr 578 41 7.1
Nd 2350 96 4.1
Sm 459 18 3.9
Eu 40 11 28
Gd 391 27 6.9
Tb 55.2 7 13
Dy 289 50 17
Ho 55 10 19
Er 162 33 20
Tm 22.9 5 22
Yb 148 30 20
Lu 20.6 4.3 21
Pb - - -
Th 78.1 8.3 11
U - - -
26
Table 4: Trace-element concentrations in volcanic groundmass*
Ammonia Tanks Member Tiva Canyon Member† Pagosa Peak Dacite†
Element Cg SD RSD Cg SD RSD Cg SD RSD
Sc 3.03 0.37 12 7 4.9 70 2.5 1.7 70
Rb 202 24 11 230 130 58 340 190 58
Sr 6.45 0.29 9.1 166 93 56 168 94 56
Y 9.6 2.8 30 17 14 83 8.8 7.3 83
Ba 5.8 2.5 44 450 280 62 570 350 61
La 5.5 6.7 120 16 17 106 16 17 106
Ce 16 13 81 40 27 69 29 20 69
Pr 1.6 1.8 117 4.3 3.7 86 2.2 1.9 86
Nd 5 5.7 114 16 13 80 6.5 5.2 80
Sm 1.1 1.2 106 2.8 2.1 76 0.91 0.69 76
Eu 0.028 0.026 91 0.48 0.44 91 0.26 0.24 91
Gd 1.2 1.2 104 2.8 2.2 78 1.07 0.84 78
Tb 0.21 0.21 100 0.76 0.56 74 0.26 0.19 74
Dy 1.3 1.3 98 1.7 1.1 67 0.63 0.42 67
Ho 0.28 0.28 97 0.31 0.24 76 0.13 0.1 76
Er 0.98 0.99 100 0.98 0.69 70 0.49 0.34 70
Tm 0.16 0.16 99 0.12 0.1 82 0.078 0.064 82
Yb 1.1 1.1 100 0.81 0.59 73 0.63 0.46 73
Lu 0.17 0.17 99 0.119 0.1 84 0.115 0.097 84
Pb 6.8 3.3 49 29 21 73 35 26 73
Th 8.6 3.7 43 6.9 5 73 11 8.1 73
U 4.4 3.2 74 4.1 3.9 94 11 11 94
*Concentrations and standard deviation (2) are in ppm. RSD is reported in %.
Table 4 (cont’d): Trace-element concentrations in volcanic groundmass*
Fish Canyon Tuff† Bonanza Rhyolite Peach Springs Tuff
Element Cg SD RSD Cg SD RSD Cg SD RSD
Sc 6.7 4.7 70 7 7.5 107 3.3 3 91
Rb 113 65 58 240 250 106 3.6 2 56
Sr 540 300 56 58 54 93 150 95 65
Y 8.7 7.2 83 14 18 130 1.11 1 90
Ba 910 550 61 79 64 80 10.4 6.1 59
La 9 10 106 15 17 118 2.8 2.2 78
Ce 28 12 69 29 27 92 5.8 1.8 31
Pr 1.9 1.6 87 3.4 2.9 85 0.66 0.37 55
Nd 6.3 5.1 80 10.2 7.7 76 2 1 52
Sm 1.08 0.82 76 1.6 1 62 0.3 0.16 51
Eu 0.44 0.4 91 0.15 0.12 80 0.02 0.021 103
Gd 1.16 0.91 78 1.8 1.3 70 0.32 0.19 59
Tb 0.31 0.23 74 0.25 0.15 61 0.039 0.021 54
Dy 0.72 0.48 67 1.29 0.73 57 0.172 0.07 41
Ho 0.15 0.11 76 0.28 0.17 63 0.032 0.022 69
Er 0.5 0.35 70 0.96 0.6 63 0.126 0.063 50
Tm 0.074 0.061 82 0.145 0.096 66 0.023 0.018 78
Yb 0.55 0.4 73 1.06 0.69 65 0.27 0.15 57
Lu 0.091 0.076 84 0.16 0.12 75 0.05 0.04 79
Pb 20 15 73 9.2 8.1 88 8.5 6.9 82
Th 6.2 4.6 73 16 15 94 5.9 4.8 82
U 3.5 3.3 94 3.6 4.4 122 1.07 0.93 87
*Concentrations and standard deviation (2) are in ppm. RSD is reported in %.
28
Table 4 (cont’d): Trace-element
concentrations in volcanic groundmass*
Wall Mountain Tuff†
Element Cg SD RSD
Sc 6.8 4.8 70
Rb 250 150 58 Sr 74 41 56
Y 18 15 83 Ba 370 230 61 La 14 15 106 Ce 48 33 69
Pr 4.1 3.5 86
Nd 15 12 80
Sm 2.9 2.2 76
Eu 0.46 0.42 91
Gd 2.8 2.2 78
Tb 0.79 0.58 74
Dy 1.8 1.2 67
Ho 0.35 0.26 76
Er 1.07 0.75 70
Tm 0.14 0.12 82
Yb 0.91 0.67 73
Lu 0.14 0.12 84
Pb 30 22 73
Th 12.8 9.4 73
U 10.4 10 94
*Concentrations and standard deviation (2) are in ppm. RSD is reported in %.
Table 5: Major-element compositions of selected titanite grains*
Ammonia Tanks Tiva Canyon Peach Springs Tuff
Wt. % SD RSD Wt. % SD RSD Wt. % SD RSD
SiO2 28.64 1.06 3.7 28.30 0.86 3.04 29.10 0.58 2.0
Ce2O3 1.24 0.28 22.6 1.61 0.30 18.6 1.60 0.12 7.5
Al2O3 1.44 0.32 22.2 1.38 0.26 18.8 1.61 0.06 3.7
CaO 23.64 1.06 4.5 23.76 0.60 2.52 24.46 0.66 2.7
FeO 2.96 0.44 14.9 2.34 0.46 19.7 2.63 0.20 7.6
TiO2 35.08 1.68 4.8 36.50 0.84 2.30 35.84 0.84 2.3
Total 93.26 94.07 95.40
Wall Mountain Tuff Mount Princeton Batholith
Wt. % SD RSD Wt. % SD RSD
SiO2 29.68 0.42 1.4 29.50 0.66 2.2
Ce2O3 0.47 0.44 93.6 0.83 0.62 74.7
Al2O3 3.35 0.46 13.7 0.66 0.36 54.5
CaO 25.82 0.58 2.2 25.97 0.92 3.5
FeO 1.95 0.20 10.3 1.57 0.50 31.8
TiO2 34.11 0.52 1.5 38.98 1.06 2.7
Total 95.41 97.54
30
Table 6: Titanite/groundmass partitioning values for volcanic titanite crystals*
Ammonia Tanks Member Tiva Canyon Member† Pagosa Peak Dacite†
Element Ct/Cg SD RSD Ct/Cg SD RSD Ct/Cg SD RSD
Sc 25.3 4.1 16 14.2 9.5 67 18 14 77
Rb 0.236 0.035 15 0.16 0.11 70 0.039 0.026 66
Sr 1.31 0.62 48 0.43 0.49 112 0.5 0.3 61
Y 1920 640 33 800 660 82 870 730 84
Ba 11 16 147 0.35 0.29 84 0.18 0.16 88
La 370 460 122 150 150 101 200 210 106
Ce 570 480 83 240 170 69 370 270 73
Pr 1000 1200 119 410 360 87 690 550 80
Nd 1300 1500 115 540 420 78 920 750 82
Sm 1700 1900 107 800 570 71 1230 940 76
Eu 1600 1500 93 580 550 95 610 580 95
Gd 1500 1600 105 710 540 76 810 710 78
Tb 3200 3200 101 830 630 76 1130 830 73
Dy 1400 1400 99 1000 620 63 1100 760 69 Ho 1200 1200 99 900 630 70 1000 760 77
Er 940 950 101 730 470 64 810 590 72
Tm 700 700 100 640 510 80 670 560 83
Yb 520 520 101 490 350 73 510 380 73
Lu 370 370 100 350 580 79 340 320 94
Pb 1.35 0.73 54 0.42 0.46 109 0.19 0.15 79
Th 27 12 45 22 16 74 25 19 76
U 9 6.7 74 6.9 6.5 95 9 8.7 96
* Standard deviation (2) is in ppm. RSD is reported in %.
Table 6 (cont’d): Titanite/groundmass partitioning values for volcanic titanite crystals*
Fish Canyon Tuff† Bonanza Rhyolite Peach Springs Tuff
Element Ct/Cg SD RSD Ct/Cg SD RSD Ct/Cg SD RSD
Sc 5.5 3.8 70 17 18 107 31 30 98
Rb 0.056 0.038 67 0.032 0.051 160 1.13 0.69 61
Sr 0.154 0.087 57 0.28 0.28 99 0.2 0.18 94
Y 780 650 83 900 1200 129 10200 9800 96
Ba 0.072 0.047 65 1.09 0.89 81 4.4 2.9 66
La 320 360 110 240 290 118 1070 950 88
Ce 580 390 66 470 430 92 2000 1000 50
Pr 720 610 64 620 530 85 2800 1800 67
Nd 850 670 79 800 610 76 3900 2400 63
Sm 910 670 74 1010 640 63 5600 3400 60
Eu 360 330 91 420 330 80 6300 6900 110
Gd 790 610 77 840 590 70 4700 3100 67
Tb 880 640 73 2000 1200 61 12000 7500 62
Dy 900 570 64 1000 560 57 6800 3400 50
Ho 820 600 73 860 540 63 6700 5100 76
Er 730 520 71 690 430 63 4600 2800 61
Tm 650 530 81 540 360 66 2800 2400 85
Yb 550 390 71 400 260 65 1320 880 67
Lu 430 370 85 290 220 75 790 690 88
Pb 0.24 0.18 73 0.93 0.83 89 0.78 0.71 92
Th 44 33 74 26 25 94 70 37 94
U 30 28 95 27 33 122 33 32 97
* Standard deviation (2) is in ppm. RSD is reported in %.
32
Table 6 (cont’d): Titanite/groundmass
partitioning values for volcanic titanite crystals*
Wall Mountain Tuff†
Element Ct/Cg SD RSD
Sc 18 13 73
Rb 0.014 0.011 78
Sr 0.95 0.75 79
Y 490 400 82
Ba 0.21 0.19 89
La 160 160 103
Ce 180 120 69
Pr 350 320 91
Nd 470 360 77
Sm 540 420 77
Eu 420 390 93
Gd 470 360 77
Tb 510 400 78
Dy 530 380 71
Ho 500 370 73
Er 430 300 70
Tm 390 340 88
Yb 330 250 75
Lu 270 230 85
Pb 1.15 0.95 82
Th 21 16 76 U 12 11 96
* Standard deviation (2) is in ppm. RSD is reported in %.
36
Data Quality and Reproducibility of Results
Results of trace-element concentrations in titanite crystals between replicates were consistent. Each titanite sample (with the exception of the Wall Mountain Tuff) had 2-3 replicates. Due to the low modal abundance of titanite crystals, the rarity of inclusion-free titanite crystals and the small size of the crystals (100 microns or less), only one replicate of Wall Mountain Tuff titanite was analyzed. Most samples had relative standard deviations (RSDs) below 20%. Because analyzed titanite crystals were inclusion-free, inter-sample variation was likely caused by error from weighing the crystals or incomplete dissolution during sample preparation. Analyzing multiple titanite crystals per replicate yielded an average crystal composition, most likely averaging the effect of zoning.
Due to the difficulty of accurately separating clean groundmass samples, three of the seven groundmass replicates were prepared and analyzed three times, whereas the remaining four were prepared and analyzed only once. The replicates that were analyzed three times were from the Ammonia Tanks Member, Bonanza Tuff, and Peach Springs Tuff (inset, Fig. 5). Two of the replicates from each of the three samples were run during the same collection period, whereas another was analyzed separately. Standard deviations of the four groundmass samples that were analyzed only once were determined using a weighted average of the three replicates of the Ammonia Tanks Member, Bonanza Rhyolite and Peach Springs Tuff
deviations were typically greater than 50%. Despite the range in concentrations between replicates of the Ammonia Tanks Member, Bonanza Rhyolite and Peach Springs Tuff (inset, Fig. 5), the similarity of the shapes of the groundmass REE curves indicates that the shapes of the partitioning curves (Fig. 6) are robust.
Two main factors contribute to the large standard deviations of the groundmass samples. First, ICP-MS analyses are less accurate at lower concentrations. For example, analyses of the REEs in titanite had average relative standard deviations less than 20%. However, low-concentration elements like Sr and Ba had RSDs upwards of 80% for some samples. Despite dissolving large quantities of groundmass for analysis, after dilution for analysis, many of the elements were in the 1-10 ppb range, near the low end of ICP-MS detection.
38
Standard deviations of partitioning values for the multiple-groundmass replicate samples of the Ammonia Tanks Member, Bonanza Rhyolite and Peach Springs Tuff (Ct/Cg,
see discussion below) were determined using the error propagation formula:
(2)
where is the standard deviation, and Ctand Cg represent the concentrations of an element in titanite and groundmass, so that Ct/Cg is the partitioning value of that element. This method of error propagation relies on two assumptions. First, it must be assumed that the two variables (Ct and Cg) are uncorrelated. This assumption is being made because the small sample size makes accurately determining a correlation coefficient implausible. The second assumption is that the variance is normally distributed around the mean values of the
concentrations. Because of the small number of replicates, it is not possible to quantitatively determine whether the variance is normally distributed, so this assumption must be held as true.
A Monte Carlo simulation was used to estimate the partitioning values and standard deviations for those samples in which only one groundmass replicate was analyzed (Tiva Canyon Member, Pagosa Peak dacite, Fish Canyon Tuff and Wall Mountain tuff). For each element in a sample, a simulated set of titanite concentrations was created by generating a 4000-value vector of random numbers with a mean and standard deviation equal to the values observed in the titanite. To attain the partitioning values and standard deviations, this vector was divided by a vector of equal length for the groundmass, using the individual
40
IV. DISCUSSION
Understanding 1) the range of trace-element partitioning values for titanite in silicic magma systems, 2) the factors affecting trace element partitioning, and 3) differences
between trace element concentrations in titanite from varied petrologic settings are necessary for developing models for the formation of plutonic and volcanic rocks, and understanding the petrogenetic connections between plutonic and volcanic rocks. The following discussion aims to identify the factors that exert the greatest control on trace-element partitioning into titanite, and to provide explanations for the differences observed between plutonic and volcanic titanite.
Integrity of the Groundmass Data
There are two concerns regarding the integrity of the groundmass data reported in this study. First, the Peach Springs Tuff groundmass is visibly altered which distinguishes it from the other samples in this study. Alteration resulted in a low totals and anomalously low SiO2,
Na2O and K2O, and high Al2O3 for the Peach Springs Tuff. Consequently, the partitioning
42
contaminant phenocrysts could have been dissolved with the groundmass. The most obvious concern regarding contamination is with the Fish Canyon Tuff groundmass, which has a positive Eu anomaly (Fig. 5). Feldspars— which partition Eu2+ into their Ca site— are the most likely cause of contamination. Whereas SEM analysis of the Fish Canyon Tuff
groundmass indicated <10% microlytic minerals, feldspar crystals were similar in color and texture to the groundmass and could have been unwittingly added to the groundmass
separate.
A simple mass-balance model helps determine the amount of feldspar contamination needed to cause the Eu anomaly in the Fish Canyon Tuff groundmass and evaluate the possibility of significant contamination. Fish Canyon Tuff plagioclase REE concentrations from Bachmann (2005) were subtracted from the groundmass values in amounts ranging from 1-20 weight % (Fig. 8). The modeling indicates that approximately 15 weight %
44
the range of partitioning values determined for the Fish Canyon Tuff and all other samples (except the Peach Springs Tuff) are interpreted to be reflective of differences between the magmatic systems.
Trace Element Partitioning
Trace-element titanite/groundmass partitioning values in silicic volcanic systems measured in this study range over an order of magnitude and are likely affected by lattice strain, melt polymerization, the water content of the melt, temperature and pressure (Watson 1976, Hart and Davis 1978, Takahashi 1978, Mahood and Hildreth 1983, Blundy and Wood 1994, Prowatke and Klemme 2005). This study focuses on the impact of lattice strain and melt polymerization because water content was beyond the scope of the investigation, and temperature and pressure are demonstrated to have little impact on partitioning (Hart and Davis 1978, Takahashi 1978, Mahood and Hildreth 1983, Prowatke and Klemme 2005).
An increase in water content decreases melt polymerization, offers more ligands for trace metal complexing (Lipman 1971, Hildreth 1979, Mahood and Hildreth 1983) and decreases the temperature of crystallization. Although no quantitative data are available, the effects of varied water content might be recorded by the partitioning behavior of titanite. For example, the Fish Canyon Tuff magma system was wet (5 wt. % H2O), existed at relatively
low temperatures near 760 ˚C (Johnson and Rutherford 1989, Lipman 2007, Bachmann et al. 2008) and had low partitioning values. Conversely, the Ammonia Tanks Member was a relatively dry (1-2 wt% H2O) magma (Lipman 1966, Christiansen et al. 1977) that existed at
46
increasing pressures increased the partitioning of REEs into titanite. However, pressure— as noticed by Prowatke and Klemme (2005)— is unlikely to affect titanite in cooler, more silicic systems that crystallized at lower pressures.
Lattice Strain
The substitution of the smaller trivalent REEs into the divalent Ca site cannot occur at high concentrations without straining the titanite crystal lattice. The lattice strain model (LSM) proposed by Brice (1975) and Blundy and Wood (1994) can be used to evaluate the effect of lattice rigidity on the partitioning of elements into a specific crystallographic site. LSMs are displayed on graphs of ionic radius versus the log of partitioning values. The LSM fits a non-weighted non-linear least squares regression to the equation:
(3)
where Do and ro are the ideal partition coefficient and ionic radius (least strained radius, peak
of the curve), Di and ri are the partition coefficient and ionic radius of cation i, EM is the
Young’s modulus of the cation site, NA is Avogadro’s number, R is the gas constant and T is
48
The LSM (Table 7, Figure 10) returned consistent results between samples. The ideal ionic radius for most samples was near 100 pm, the ionic radius of Gd3+ in sevenfold
coordination. Several factors must be considered when determining the applicability of the LSM to the understanding of partitioning. If the supply of partitioning elements from the melt is limited (which is likely the case with titanite, where melt concentrations of REEs – as estimated from groundmass concentrations, are orders of magnitude lower than in titanite), diffusion is likely to play an important role in the transport of an element to the crystal-melt boundary. Also, the coupled substitution of the REEs with Al and Fe adds complexity to interpreting lattice strain effects, as differing proportions of Al and Fe into the crystal lattice will cause varying degrees of expansion and contraction of the Ca-site.
Ignoring Al and Fe substitution decreases the accuracy of estimating the Young’s modulus, which is done assuming that bond stress and strain are due only to the substitution of REEs into the Ca site. The magnitude of the Young’s modulus is an indication of the rigidity of the lattice site. The size of the Young’s moduli fitted to titanite in this study varied greatly from one sample to another (46.3-472.2 GPa), which may reflect the impact of ignoring the other substitutions. However, the average Young’s modulus suggests a rigid lattice site, and compares favorably to the modulus determined by Olin 2010 (approximately 200 GPa).
Melt Polymerization
Table 7: Results of Lattice Strain Modeling Ammonia Tanks Member Tiva Canyon Member Pagosa Peak Dacite Fish Canyon Tuff Bonanza Rhyolite Peach Springs Tuff Wall Mountain Tuff T
(°K)* 1093 1093 1033 1033 1067 1067 1033
Do 3310 795 1010 853 763 4880 486
ro
(pm) 100.9 99.0 99.9 100.3 100.2 100.1 99.5
EM
(GPa) 46.3 287.3 187.6 76.8 244.8 472.2 115.0
50
2006). Melt polymerization is a descriptor of the structure of a melt, as defined by the degree of connectivity between silicon tetrahedra. As the polymerization of melt increases, the activity of trace element cations increases which increases the likelihood of their incorporation into crystalline phases (Watson 1976).
The aluminum saturation index (ASI) is a simple and effective metric to describe melt polymerization (Prowatke and Klemme 2005). ASI is defined as the molar proportion:
(4)
Aluminum acts to help link silica tetrahedra, whereas metal cations act as network modifiers to decrease polymerization (Watson 1976, Mahood and Hildreth 1983).
The NBO/T is another useful descriptor of melt polymerization (Mysen 1983, Mysen 2004). NBO/T is a measure of the number of nonbridging oxygens compared to the number of tetrahedrally coordinated cations in a melt. NBO/T = 4 indicates a completely
depolymerized melt, whereas NBO/T = 0 is a completely polymerized melt. The NBO/T value was calculated using an equation:
(5)
modified from Jaeger and Drake (2000). For these calculations, the amount of Fe2O3 in the
melt is negligible at the oxygen fugacities of the systems of interest (Kress and Carmichael 1991).
Increasing ASI values (and decreasing NBO/T) indicate increasing melt
52
polymerization for our samples. There is no correlation between measures of melt polymerization and REE content (represented by plotting versus [Gd]; Fig. 11) for the samples in this study, probably because of the limited range of ASI. However, combining data from our study with the data from Prowatke and Klemme (2005) shows good agreement between the studies. Scatter in the data is likely due to differences in water pressure, volatile content, rates of cooling, melt composition, oxygen fugacity and temperature in the natural system that was not encountered in the controlled experimental studies of Prowatke and Klemme (2005).
Volcanic Versus Plutonic Titanite
Titanite crystals from plutonic and volcanic systems differ in their zoning, trace-element composition and trace-trace-element substitution mechanisms. Understanding the differences between plutonic and volcanic titanite is useful in identifying the connections between plutonic and volcanic rocks.
Differences in growth zoning between plutonic and volcanic titanite suggest different environments of formation. Whereas growth zoning is distinct and finely banded in volcanic titanite, plutonic titanite typically exhibits thicker less pronounced growth zones (Fig. 12). Oscillations that might reflect diffusion controlled zoning can clearly be seen in the
54
a near-solidus system. Dickinson (1996) and Johnson et al. (2010) describe a similar mechanism to explain Ba zoning in K-feldspar in plutonic rocks.
Plutonic and volcanic titanite crystals also display some clear differences in their trace element content—in particular the REEs (Fig. 13). With the exception of La, Ce, Eu, and Lu, plutonic titanite crystals generally have lower REE concentrations, and are most similar to Fish Canyon Tuff and Pagosa Peak dacite titanite crystals. The Fish Canyon Tuff and Pagosa Peak dacite are thought to be rejuvenated plutonic rocks (Bachmann et al., 2002), which may explain the similarity of their REE profiles to the plutonic titanite crystals,
whereas the other volcanic rocks sampled are thought to have formed through down-temperature crystallization from a largely liquid magma. Lower REE concentrations in plutonic, Fish Canyon Tuff, and Pagosa Peak dacite titanite crystals could also be explained by competition with other trace-element bearing phases such as zircon, allanite, and
amphibole. The similarity of trace-element concentrations of plutonic titanite and titanite from the Fish Canyon Tuff and Pagosa Peak dacite indicates that partitioning values of trace elements in the Fish Canyon magma system could be used for accurate plutonic
trace-element fractionation modeling.
Trace-element substitutions into titanite involve a coupled substitution with major elements, and differences in the substitutions between plutonic and volcanic titanite strengthen the idea that they formed under different conditions. The mechanisms of substitution differ depending on the environment in which titanite is crystallizing.
The titanite crystals studied here predominantly underwent the charge-balanced coupled substitution of Al3+ and Fe3+ for Ti4+, and REEs3+ and Y3+ for Ca2+, resulting in a negative correlation between molar Al + Fe versus molar Ti in titanite (Fig. 14). It is also evident from figure 14 that data for titanite from the Mount Princeton Batholith has a similar slope but lower Al+Fe relative to the volcanic titanite. This is most likely due to a greater concentration of Nb available during the crystallization of plutonic titanite. Niobium is a very incompatible element that fits well into the Ti site in titanite. In systems that contain titanite, it is the major Nb-bearing phase and may prefer Nb to Al and Fe (Frost et al. 2000, Vourinen and Halenius, 2005). Because Nb is incompatible in most mineral phases, late-stage
magmatic fluids are also enriched in Nb. Therefore, titanite that crystallizes from plutonic rocks where the melt-phase is more enriched in Nb will have greater concentrations of Nb than titanite that crystallizes from typical volcanic systems, decreasing the amount of Al and Fe required to charge compensate REE substitution.
where SmN, GdN and EuN are the chondrite-normalized values of titanite composition. Both titanite and groundmass from this study exhibit negative europium anomalies. Eu/Eu*of titanite is expected to decrease with increased fractionation and incompatible element enrichment of the melt. Figure 15 shows this trend, plotted as Eu/Eu* versus Yb concentration in titanite. In general, volcanic titanite crystals with larger negative Eu anomalies have higher concentrations of other REEs (in particular the HREEs), suggesting crystallization from a more fractionated melt. Conversely, there is no slope between Eu/Eu* and the REE content of plutonic titanite, despite differences in the formation of the Mount Princeton Batholith and Sierra Nevada Batholith titanite. This is likely due to the competition between titanite and other REE-bearing phases in plutonic rocks depleting the REEs in the melt phase. If plutonic titanite crystallized early from a high melt-fraction system as opposed to near-solidus conditions, a trend similar to that displayed by the volcanic titanite is
V. CONCLUSIONS
Titanite is confirmed as an important mineral in the trace-element evolution of felsic igneous systems. The principal new observations to come from this study include:
(1) Titanite in dacitic and rhyolitic systems partitions the REEs and Y over a wide range (e.g., Ce titanite/groundmass ratios range from 180 in the Wall Mountain Tuff to 570 in the Ammonia Tanks). The range of partitioning values is controlled by lattice strain (with an ideal cation radius near Gd) and melt polymerization, and is likely influenced by the water content of the melt. REE partitioning values are in good agreement with previous studies in volcanic systems (Bachmann, 2005), but vary markedly from experimental studies of different melt compositions. Strontium, Rb, and Pb are generally incompatible in titanite compared to groundmass concentrations, whereas Sc, Th, and U are compatible.
(2) Volcanic and plutonic titanite crystals exhibit distinct differences in their trace-element content, zoning and substitution mechanisms indicating formation from different magmatic environments. Volcanic titanite forms through down-T crystallization of high melt-fraction systems whereas plutonic titanite forms at near- or sub-solidus conditions.
(3) Each volcanic rock unit studied has unique titanite/groundmass partitioning behavior, demonstrating the sensitivity of titanite trace-element partitioning to crystallization
REFERENCES
Andersen DJ, Lindsley DH (1988) Internally consistent solution models for Fe-Mg-Mn-Ti oxides: Fe-Ti oxides. American Mineralogist 73: 714-726
Bachmann O, Dungan MA, Lipman PW (2002) The Fish Canyon magma body, San Juan volcanic field, Colorado: Rejuvenation and eruption of an upper crustal batholithic magma chamber. Journal of Petrology 43: 1469-1503
Bachmann O, Bergantz GW (2008) Rhyolites and their Source Mushes across Tectonic Settings. Journal of Petrology 49(12):2277-2285
Bachmann O, Dungan MA, Bussy F (2005) Insights into shallow magmatic processes in large silicic magma bodies: the trace element record in the Fish Canyon magma body, Colorado. Contributions to Mineralogy and Petrology 149:338-349
Bateman PC (1992) Plutonism in the central part of the Sierra Nevada Batholith, Calfornia. US Geological Survey, Professional Papers. 1483: 1-186
Bateman PC, Chappell BW (1979) Crystallization, fractionation, and solidification of the Tuolumne Intrusive Series, Yosemite national Park, California. Geological Society of America Bulletin 90(1):465-482
Bindeman IN, Schmitt AK, Valley, JW (2006) U-Pb zircon geochronology of silicic tuffs from the Timber Mountain/Oasis Valley caldera complex, Nevada: rapid generation of large volume magmas by shallow-level remelting. Contributions to Mineralogy and Petrology 152: 649-665
Belkin HE, De Vivo B, Lima A, Torok K (1996) Magmatic (silicates/saline/sulfur-rich/CO2) immiscibility and zirconium and rare-earth element enrichment from alkaline magma chamber margins: evidence from Ponza Island, Ponine Archipelago, Italy. European Journal of Mineralogy 8: 1401-20
Blundy J, Wood B (1994) Prediction of crystal-melt partition coefficients from elastic moduli. Nature 372:452-454
Brice JC (1975) Some thermodynamic aspects of the growth of strained crystals. Journal of Crystal Growth 28: 249-253
Browne B, Izbekov P, Eichelberger J, Churikova T (2010) Pre-eruptive storage conditions of the Holocene dacite erupted from Kizimen Volcano, Kamchatka. International Geology Review 52(1):95-110
Trends Within the Timber Mountain-Oasis Valley Caldera Complex, Nevada: Evidence for Multiple Cycles of Chemical Evolution in a Long-Lived
Silicic Magma System. Journal of Geophysical Research 94(B5):5961-5985
Broska I, Harlov D, Tropper P, Siman P (2007) Formation of magmatic titanite and titanite-ilmenite phase relations during granite alteration in the Tribec Mountains, Western Carpathians, Slovakia. Lithos 95: 58-71
Byers FM Jr., Carr WJ, Orkild PP, Quinlivan WD, Sargent KA (1976) Volcanic suites and related cauldrons of Timber Mountain-Oasis Valley caldera comple, southern Nevada. United States Geological Survey Professional Paper 919; 1-70
Carmichael ISE, Nicholls J (1967) Iron-titanium oxides and oxygen fugacities in volcanic rocks. Journal of Geophysical Research 72: 4665-4687.
Carmichael ISE (1991) The redox states of basic and silicic magmas: a reflection of their source regions? Contributions to Mineralogy and Petrology 106:129-141 Chapin CE, Lowell GR (1979) Primary and secondary flow structures in ash-flow
tuffs of the Gribbles Run paleovalley, central Colorado. InChapin CE, Elston WE (eds)Ash-flow Tuffs. Geological Society of America Special Paper 180: 137-154 Cherniak DJ (1995) Sr and Nd diffusion in titanite. Chemical Geology 125:219-
232
Christiansen RL, Lipman PW, Carr WJ, Byers FM Jr, Orkild PP, Sargent KA (1977) Timber Mountain-Oasis Valley caldera complex of southern Nevada. Geological Society of America Bulletin 88: 943-959
Davis JW (2010) Thermochronology and cooling histories of plutons: Implications for incremental pluton assembly. PhD Dissertation, University of North Carolina at Chapel Hill
64
Flood TP, Vogel TA, Schuraytz BC (1989) Chemical evolution of a magmatic system: The Paintbrush Tuff, Southwest Nevada Volcanic Field. Journal of Geophysical Research 94: 5943-5960
Foley EB (2010) Characteristics of modal layering in the Round Valley Peak Granodiorite, eastern Sierra Nevada, California. MS Thesis, University of North Carolina at Chapel Hill
Frost BR, Chamberlain KR, Schumacher JC (2000) Sphene (titanite): phase relations and role as a geochronometer. Chemical Geology 172:131-148
Gaschnig, AM (2005) Cause, timing, and significance f brittle deformation in Little Lakes Valley, eastern Siera Nevada, California. MS Thesis, University of North Carolina at Chapel Hill
Ghiorso MS, Sack RO (1991) Fe-Ti oxide geothermometry: thermodynamic formulation and the estimation of intensive variables in silicic magmas. Contributions to Mineralogy and Petrology 108:485-510
Giannetti B and Luhr JF (1983) The white trachytic tuff of Roccamonfina Volcano (Roman Region, Italy). Contributions to Mineralogy and Petrology 84: 235-252
Glazner AF (1988) Stratigraphy, structure, and potassic alteration of Miocene volcanic rocks in the Sleeping Beauty area, central Mojave Desert, California. Geological Society of America Bulletin 100:242-435
Glazner AF, Coleman DS, Bartley JM (2008) The tenuous connection between high-silica rhyolites and granodiorite plutons. Geology 36(2):183-186
Glazner AF, Nielson JE, Howard KA, Miller DM (1986) Correlation of the Peach Springs Tuff, a large-volume Miocene ignimbrite sheet in California and Arizona. Geology 14:840-843
Graham AL, Ringwood AE (1971) Lunar basalt genesis: The origin of the europium anomaly. Earth and Planetary Science Letters 13: 105-115
Green TH, Pearson NJ (1986) Rare-earth element partitioning between sphene and coexisting silicate liquid at high pressure and temperature. Chemical Geology 55:105-119
Gromet LP and Silver LT (1983) Rare earth element distributions amng minerals ina
granodiorite and their petrogenetic implications. Geochimica et Cosmochimica Acta 47: 925-939
Henderson P (1980) Rare Earth Element Partitioning Between Sphene, Apatite and Other Coexisting Minerals of the Kangerdlugssuaq Intrusion, E. Greenland. Contributions to Mineralogy and Petrology 72:81-85
Hildreth W (1979) The Bishop Tuff: Evidence for the origin of compositional zonation in silicic magma chambers. In: Chapin CE, Elston WE eds. Ash-Flow Tuffs, Geological Society of America Special Paper 180: 43-75
Hildreth W, Wilson CJN (2007) Compositional Zoning of the Bishop Tuff. Journal of Petrology 48(5):951-999
Irving AJ, Frey FA (1978) Distribution of trace elements between garnet megacrysts and host volcanic liquids of kimberlitic to rhyolitic composition. Geochimica et Cosmochimica Acta 42:771-787
Jaeger WL, Drake MJ (2000) Metal-silicate partitioning of Co, Ga, and W: Dependence on silicate melt composition. Geochimica et Cosmocimica Acta 64: 3887-3895
Johnson BR, Glazner AF (2010) Formation of K-feldspar megacrysts in granodioritic plutons by thermal cycling and late-stage textural coarsening. Contributions to Mineralogy and Petrology 159:599-619
Johnson MC, Rutherford, MJ (1989) Experimentally determined conditions in the Fish Canyon Tuff, Colorado, magma chamber. Journal of Petrology 30:711-737 Kratzmann DJ, Carey S, Scasso RA, Naranjo J-A (2010) Role of cryptic amphibole
crystallization in magma differentiation at Hudson volcano, Southern Volcanic Zone, Chile. Contributions to Mineralogy and Petrology 159:237-264
Kress VC, Carmichael SE (1991) The compressibility of silicate liquids containing Fe2O3 and the effect of composition, temperature, oxygen fugacity and pressure on their redox states. Contributions to Mineralogy and Petrology 108: 82-92
Kretz R (1983) Symbols for rock-forming minerals. American Mineralogist 68: 277-279 Liferovich RP, Mitchell RH (2005) Composition and paragenesis of Na-, Nb- and Zr-bearing
66
Lipman PW, Dungan M, Bachmann O (1997) Comagmatic granophyric granite in the Fish Canyon Tuff, Colorado: Implications for magma-chamber processes during a large ash-flow eruption. Geology 25: 915-918
Lipman PW (2007) Incremental assembly and prolonged consolidation of Cordilleran magma chambers: Evidence from the Southern Rocky Mountain volcanic field. Geosphere 3(1):42-70
Lipman PW and McIntosh WC (2008) Eruptive and noneruptive calderas, northeastern San Juan Mountains, Colorado: Where did the ignimbrites come from? Geological Society of America Bulletin 120: 771-795
Luhr JF, Carmichael ISE, Varekamp JC (1984) The 1982 eruptions of El Chichon volcano, Chiapas, Mexico: mineralogy and petrology of the anhydrite-bearing pumices. Journal of Volcanology and Geothermal Research 23:69-108
Mahood G, Hildreth W (1983) Large partition coefficients for trace elements in high-silica rhyolites. Geochimica et Cosmochimica Acta 47:11-30
Marks MAW, Coulson IM, Schilling J, Jacob DE, Schmitt AK, Markl G (2008) The effect of titanite and other HFSE-rich mineral (Ti-bearing andradite, zircon, eudialyte)
fractionation on the geochemical evolution of silicate melts. Chemical Geology 257:153-172
Maughan LL, Christiansen EH, Best MG, Gromme CS, Deino AL, Tingey DG (2002) The Oligocene Lund Tuff, Great Basin, USA: a very large volume monotonous
intermediate. Journal of Volcanology and Geothermal Research 113:129-157 McIntosh WC, Chapin CE (2004) Geochronology of the Central Colorado volcanic field,
Colorado. In Cather SM, McIntosh WC, Kelley SS (eds) Tectonics, geochronology, and volcanism in the Southern Rocky Mountains and Rio Grande Rift. New Mexico Bureau of Geology, Bulletin 160: 205-238
McLeod GW, Dempster TJ, Faithfull JW (2011) Deciphering magma-mixing processes using zoned titanite from the Ross of Mull Granite, Scotland. Journal of Petrology 52: 55-82
Mills JG, Jr., Saltoun BW, Vogel TA (1997) Magma batches in the Timber Mountain magmatic system, Southwest Nevada Volcanic Field, Nevada, USA. Journal of Volcanology and Geothermal Research 78: 185-208
Mysen BO (1983) The structure of silicate melts. Annual Review of Earth and Planetary Sciences 11:75-97
Nagasawa H, Schnetzler CC (1971) Partitioning of rare earth, alkali and alkaline earth
elements between phenocrysts and acidic magma. Geochimica et Cosmochimica Acta 35: 953-968
Nakada S (1991) Magmatic processes in titanite-bearing dacites, central Andes of Chile and Bolivia. American Mineralogist 76:548-560
Nielson JE, Lux DR, Dalrymple GB, Glazner AF (1990) Age of the Peach Springs Tuff, Southeastern California and Western Arizona. Journal of Geophysical Research 95(B1):571-580
Noyes HJ, Frey FA, Wones DR (1983). A tale of two plutons: geochemical evidence bearing on the origin and differentiation of the Red Lake and Eagle Peak plutons, Central Sierra Nevada, California. Journal of Geology 91:487-509
Oberti R, Smith DC, Rossi G, Caucia F (1991) The crystal-chemistry of high-aluminium titanites. European Journal of Mineralogy 3:777-792
Olin PH (2010) Partitioning of rare earth and high field strength elements between titanite and phonolitic liquid. Poster session presented at: Geological Society
Pallister JS, Thornber CR, Cashman KV, Clynne MA, Lowers HA, Mandeville CW, Brownfield IK, Meeker GP (2008) Petrology of the 2004-2006 Mount St. Helens Lava Dome- Implications for Magmatic Plubing and Eruption Triggering. In: Sherrod DR, Scott WE, Stauffer PH (eds) A volcano Rekindled: The Renewed Eruption of Mount St. Helens, 2004-2008, vol U.S. Geological Survey Professional Paper 1750. pp 647-702
Pamukcu AS (2010) The evolution of the Peach Springs Tuff magmatic system as revealed by accessory mineral textures and compositions. MS Thesis, Vanderbilt University Paterson BA, Stephens WE (1992) Kinetically induced compositional zoning in titanite:
implications for accessory-phase/melt partitioning of trace elements. Contributions to Mineralogy and Petrology 109:373-385
68
Ribbe PH (1982) Titanite (sphene). In: Ribbe PH (ed) Orthosilicates, vol 5.
Shannon RD (1976) Revised effective ionic radii and systematic studies of interatomic distances in halides and chalcogenides. Acta Crystallographica A32:751-767 Shore M, Fowler AD (1996) Oscillatory zoning in minerals: a common phenomenon. The
Canadian Mineralogist 34: 1111-1126
Simmons EC, Hedge CE (1978) Minor-element and Sr-isotope geochemistry of Tertiary stocks, Colorado mineral belt. Contributions to Mineralogy and Petrology 67: 379-396
Stimac J, Hickmott D, Abell R, Larocque ACL, Broxton D, Gardner J, Chipera S, Wolff J, Gauerke E (1996) Redistribution of Pb and other volatile trace metals during
eruption, devitrification, and vapor-phase crystallization of the Bandelier Tuff, New Mexico. Journal of Volcanology and Geothermal Research 73:245-266
Stormer JC, Jr. (1983) The effects of recalculation on estimates of temperature and oxygen fugacity from analyses of multicomponent iron-titanium oxides. American
Mineralogist 68:586-594
Sun SS, McDonough WF (1989) Chemical and isotopic systematics of oceanic basalts: implications for mantle composition and prcesses. In: Saunders AD, Nory MJ (eds) Magmatism in ocean basins. Geological Society [London] Special Publication 42: 313-345
Takahashi E (1978) Partitioning of Ni2+, Co2+, Fe2+, Mn2+ and Mg2+ between olivine and silicate melts: compositional dependence of partition coefficient. Geochimica et Cosmochimica Acta 42: 1829-1844
Varga R, Smith B (1984) Evolution of the Early Oligocene Bonanza Caldera, northeast San Juan Volcanic Field, Colorado. Journal of Geophysical Research 89: 8679-8694 Venezky DY, Rutherford MJ (1997) Preeruption conditions and timing of dacite-andesite
magma mixing in the 2.2 ka eruption at Mount Rainier. Journal of Geophysical Research 102(B9):20069-20086
Verhoogen J (1962) Distribution of titanium between silicates and oxides in igneous rocks. American Journal of Science 260:211-220