Contents lists available atScienceDirect
European Journal of Pharmaceutical Sciences
journal homepage:www.elsevier.com/locate/ejps
Multivariate pharmacokinetic/pharmacodynamic (PKPD) analysis with
metabolomics shows multiple e
ff
ects of remoxipride in rats
W.J. van den Brink
a, J. Elassaiss-Schaap
a,b, B. Gonzalez-Amoros
a, A.C. Harms
a,
P.H. van der Graaf
a,c, T. Hankemeier
a, E.C.M. de Lange
a,⁎aSystems Pharmacology, Division of Pharmacology, Leiden Academic Center for Drug Research, Leiden University, Leiden, The Netherlands bPD-value, Houten, The Netherlands
cCertara QSP, Canterbury Innovation House, Canterbury, United Kingdom
A R T I C L E I N F O
Keywords:
Systems pharmacology PK/PD modeling Pharmacometabolomics Biomarkers
CNS drugs D2R antagonists
A B S T R A C T
The study of central nervous system (CNS) pharmacology is limited by a lack of drug effect biomarkers. Pharmacometabolomics is a promising new tool to identify multiple molecular responses upon drug treatment. However, the pharmacodynamics is typically not evaluated in metabolomics studies, although being important properties of biomarkers.
In this study we integrated pharmacometabolomics with pharmacokinetic/pharmacodynamic (PKPD) mod-eling to identify and quantify the multiple endogenous metabolite dose-response relations for the dopamine D2 antagonist remoxipride.
Remoxipride (vehicle, 0.7 or 3.5 mg/kg) was administered to rats. Endogenous metabolites were analyzed in plasma using a biogenic amine platform and PKPD models were derived for each single metabolite. These models were clustered on basis of proximity between their PKPD parameter estimates, and PKPD models were subse-quentlyfitted for the individual clusters. Finally, the metabolites were evaluated for being significantly affected by remoxipride.
In total 44 metabolites were detected in plasma, many of them showing a dose dependent decrease from baseline. We identified 6 different clusters with different time and dose dependent responses and 18 metabolites were revealed as potential biomarker. The glycine, serine and threonine pathway was associated with remox-ipride pharmacology, as well as the brain uptake of the dopamine and serotonin precursors.
This is thefirst time that pharmacometabolomics and PKPD modeling were integrated. The resulting PKPD cluster model described diverse pharmacometabolomics responses and provided a further understanding of remoxipride pharmacodynamics. Future research should focus on the simultaneous pharmacometabolomics analysis in brain and plasma to increase the interpretability of these responses.
1. Introduction
Central nervous system (CNS) drug development is difficult and attrition rates are high (Kola and Landis, 2004). While important pro-gress has been made in the insight into human brain pharmacokinetics (PK) in response to plasma PK, insights into the relation to the time dependent CNS drug effects are limited (de Lange, 2013;de Lange and Hammarlund-Udenaes, 2015; Yamamoto et al., 2016). It is therefore
essential to utilize biomarkers that provide proof of pharmacology and dosing guidance for early clinical drug development (Danhof et al., 2005; de Lange, 2013; de Lange and Hammarlund-Udenaes, 2015; Hurko, 2009; Hurko and Ryan, 2005; Morgan et al., 2012; Soares, 2010). Preferably, these biomarkers are measured in the blood, since blood can be easily obtained from humans.
Biomarker discovery is increasingly driven by (pharmaco)metabo-lomics (Burt and Nandal, 2016;Van Der Greef and Mcburney, 2005;
http://dx.doi.org/10.1016/j.ejps.2017.08.031
Received 5 July 2017; Received in revised form 25 August 2017; Accepted 28 August 2017
⁎Corresponding author at: PO box 9502, 2300 RA Leiden, The Netherlands.
E-mail address:ecmdelange@lacdr.leidenuniv.nl(E.C.M. de Lange).
Abbreviations:AAAD, aromatic amino acid decarboxylase; AQC, 6-aminoquinolyl-N-hydroxysuccinimidyl carbamate; ASCA, ANOVA Simultaneous Component Analysis; BCAA, branched chain amino acids; brainECF, brain extracellularfluid; CNS, central nervous system; D2R, dopamine D2 receptor; DOPAC, 3,4-dihydroxyphenylacetic acid; FWER, family wise
error rate; HVA, homovanillic acid; L-DOPA,L-3,4-dihydroxyphenylalanine; MeOH, methanol; MS, mass spectrometry; NMDA,N-methyl-D-aspartate; OFV, objective function value; PCA, principal component analysis; PD, pharmacodynamics; PK, pharmacokinetics; PLS-DA, partial least squares discriminant analysis; QC, quality control; RSD, relative standard deviation; RSE, relative standard error; RV, residual variability; SRM, Selective Reaction Monitoring; TCEP, tris(2-carboxyethyl)phosphine; UPLC, ultra high performance liquid chromatography; VIP, Variable Importance in Projection; WCSS, Within Cluster Sum of Squares
Available online 04 September 2017
0928-0987/ © 2017 The Author(s). Published by Elsevier B.V. This is an open access article under the CC BY license (http://creativecommons.org/licenses/BY/4.0/).
Hayes et al., 2009;Kaddurah-Daouk et al., 2015, 2008;van der Greef et al., 2006). It measures the end-products of cellular biochemical re-actions under a drug-perturbed, disease or control condition, and is as such a phenotypic measure, sometimes referred to as the“metabotype” (Semmar, 2012). As an example, a pharmacometabolomics approach has been successfully applied in CNS drug research for identification of serum biomarkers of antipsychotic drug efficacy (Xuan et al., 2011) or toxicity (Kaddurah-Daouk et al., 2007).
An important limitation so far has been that pharmacometabolomic studies are often performed at single time points while many biological processes change with time. A single time point evaluation thus limits the ability to accurately quantify the extent and duration of drug ef-fects. Whereas for single time point studies multivariate data analysis mostly is performed using principal component analysis (PCA) and partial least squares discriminant analysis (PLS-DA) (Bartel et al., 2013), more advanced methods are needed, and have been developed, to evaluate time-dependent effects in metabolomics data. For example, an extension of PCA was developed called ANOVA Simultaneous Component Analysis (ASCA), allowing for multivariate evaluation in multiple dimensions (e.g. dose, time and response) (Smilde et al., 2005). Still, a remaining limitation with this method is that the vari-ables are treated as categorical data, while factors as dose and time typically are continuous variables. Furthermore, longitudinal clustering approaches are promising for the evaluation of multivariate long-itudinal data, although its application until now has been mainly on gene expression data (Bar-Joseph et al., 2003; de Hoon et al., 2002; Déjean et al., 2007;Jin et al., 2003).
Not only the time course of the effect biomarker is important for the understanding of drug effects, but also the causal relation between drug dose and biomarker response (Danhof et al., 2005). This relation is governed by processes of drug distribution to the target site (de Lange, 2013;Westerhout et al., 2012), receptor binding (de Witte et al., 2016) and activation (Ramakrishnan et al., 2002), signal transduction (Jin et al., 2003; Ramakrishnan et al., 2002) and homeostatic feedback (Stevens et al., 2012). These processes are typically non-linear, which increases the complexity from a data analysis perspective. Quantitative insights in drug effects are obtained by a combination of studies that measure biomarkers at different causal levels in a time-dependent manner and pharmacokinetic/pharmacodynamic (PKPD) modeling (Danhof et al., 2007, 2005; de Lange, 2013; de Lange et al., 2005; Derendorf and Meibohm, 1999).
In this study we integrated pharmacometabolomics with PKPD modeling to identify and quantify multiple endogenous metabolite dose-response relations for the paradigm compound remoxipride. Rats received remoxipride in different dose levels and we obtained serial plasma samples for analysis of multiple endogenous metabolites. PKPD models were subsequently developed to fit the longitudinal dose-re-sponse data of each single metabolite. Biomarker clusters were
identi-fied on basis of the PKPD parameters to derive a PKPD model thatfitted the cluster responses. Potential biomarkers and putative pharmacolo-gical pathways of remoxipride effect were identified using this ap-proach; we obtained comprehensive insight in its differential effects on the endogenous metabolism.
2. Methods
2.1. Animal studies
Animal studies were performed in agreement with the Dutch Law of Animal Experimentation and approved by the Animal Ethics Committee in Leiden, the Netherlands (study protocol DEC13186). Male Wistar rats (n = 28, 278 +/−15 g, Charles River, The Netherlands) were housed in groups for 6–9 days until surgery (Animal Facilities Gorlaeus Laboratories, Leiden, The Netherlands). Animals were held under standard environmental conditions while artificial daylight was pro-vided from 7:30 AM to 7:30 PM. They had ad libitum access to food
(Laboratory chow, Hope Farms, Woerden, The Netherlands) and acid-ified (to prevent infection) water.
2.2. Surgery and experiment
Surgery was done according to previously reported procedures (Westerhout et al., 2012). In brief, animals received 2% isoflurane an-esthesia while undergoing surgery. Cannulas were placed in the femoral artery for serial blood sampling and the femoral vein for drug admin-istration. Microdialysis guides (CMA 12 Elite PAES, Schoonebeek, The Netherlands) were placed in caudate putamen (AP −1.0; L 3.0; V −3.4, relative to bregma) and replaced by microdialysis probes (CMA 12 Elite PAES, 4 mm polycarbonate membrane, cut-off 20 kDA, Schoonebeek, The Netherlands) before the experiment. For 7 days, animals were individually held in Makrolon type 3 cages to recover from surgery. The start of the experiments was between 8:00 AM and 8:30 AM and rats were randomly assigned receiving 0 mg/kg (n = 5), 0.7 mg/kg (n = 8), or 3.5 mg/kg (n = 9) remoxipride by i.v. bolus (2 min infusion) at the start of experiment (t = 0 min). Microdialysis was performed using buffered perfusionfluid and aflow rate of 1μl/ min. Blood samples of 200μl were collected in heparin-coated eppen-dorf tubes at−15, 2, 10, 22, 30, 40, 60, 100, 180 and 240 min, after which animals received 200μl saline to compensate for the lost blood volume. Plasma was separated by centrifuging (1000g, 10 min) and was stored at 4 °C during the experiment and at−20 °C after the experi-ment until analysis.
2.3. Metabolomics analysis
Metabolomics analysis in the plasma samples was performed using an amine platform, according to a previously described method (Noga et al., 2012). The amine platform covers amino acids and biogenic amines employing an Accq-tag derivatization strategy adapted from the protocol supplied by Waters (Etten-Leur, The Netherlands). 5μl plasma was spiked with an internal standard solution and reduced with TCEP (tris(2-carboxyethyl)phosphine) followed by deproteination by addi-tion of MeOH. After centrifuging (9400 ×g, 10 min, 10 °C), the su-pernatant was transferred to a deactivated autosampler vial (Waters) and dried under N2. The residue was reconstituted in borate buffer (pH 8.5) with 6-aminoquinolyl-N-hydroxysuccinimidyl carbamate (AQC) derivatization reagent (Waters). Microdialysate samples under-went the same procedure, but without deproteination. After reaction, the vials were transferred to an autosampler tray and cooled to 10 °C until the injection (1.0μl) of the reaction mixture into the UPLC-MS/MS system. This consisted of an ACQUITY UPLC system with autosampler (Waters) coupled online with a Xevo Tandem Quadrupole mass spec-trometer (Waters), and operated using Masslynx data acquisition soft-ware (version 4.1; Waters). The samples were analyzed by UPLC-MS/ MS using an Accq-Tag Ultra column (Waters). The Xevo TQ was used in the positive-ion electrospray mode and all metabolites were monitored in Selective Reaction Monitoring (SRM) using nominal mass resolution. Acquired data were evaluated using Quanlynx software (Waters), by integration of assigned SRM peaks and normalization using proper in-ternal standards. For analysis of amino acids their 13C15N-labeled analogs were used. For other amines, the closest-eluting internal stan-dard was employed. Blank samples were used to correct for back-ground, and in-house developed algorithms were applied using the pooled QC samples to compensate for drift in the sensitivity of the mass spectrometer with and over different batches (Van Der Kloet et al., 2009). Quality assurance of metabolite measurements was performed only reporting compounds with a QC relative standard deviation (RSDQC) under 15%.
2.4. Data exploration, PKPD modeling and clustering
(1)) (Tukey, 1977), by comparing concentrations to the range:
− ∗ − + ∗ −
Q Q Q Q Q Q
[ 1 3 ( 3 1), 3 3 ( 3 1)], (1)
in whichQ1andQ3are the lower and upper quartiles per metabolite, respectively.
1.3% of the data points were designated as outlier, and replaced by the median of the metabolite concentration of the dose group in which the data point existed. Most of the outliers came from one specific sample in the vehicle group (see Fig. S1). Sequential PKPD modeling approach was applied on the non-scaled metabolite concentrations, using NONMEM® version 7.3.0 with subroutine ADVAN13. Posthoc parameter estimates of a previously developed PK model were used as input for the PKPD model (van den Brink et al., 2016). This model provided remoxipride concentrations both in plasma and brain extra-cellularfluid (brainECF).
A proportional error model was used in which the residual varia-bility (RV, εijk) follows a normal distribution with zero mean and an estimated variance (Eq.(2)).
= ∗ +
Robs ij, Rpred ij, (1 εijk) (2)
Criteria for model evaluation were the drop in objective function value (OFV) calculated as −2loglikelihood ratio (> 3.84,p< 0.05,
df= 1), the precision of the parameter estimates (relative standard error (RSE) < 30%) and the visual evaluation of the goodness-of-fit. 44 models were developed linking the remoxipride brainECF con-centrations to the metabolite responses. The drug effect was described by anEMAXequation (Eq.(3)), which was coupled to the metabolite
production rate (kIN) in a turnover model (Eq.(4)) as follows:
= +
∗ Drugeffect DE E C
EC C ( ) [ ] [ ], MAX REM REM 50 (3) ∂ ∂ = − − ∗ ∗ R
t kIN (1 DE) kOUTR, (4)
in whichCREMis the remoxipride concentration in brainECF,EMAXis the
maximal inhibition,EC50is the concentration at half maximal effect,kIN
is the metabolite production rate (which is derived from the metabolite baseline *kOUT),kOUTis the metabolite elimination rate, andRis the
metabolite concentration in plasma.
We identified clusters in the scaled parametersEMAX,EC50andkOUT
using the k-means method, with scaling performed according to Eq.(5). K-means clustering aims to minimize the Within Cluster Sum of Squares (WCSS), which may reach a local minimum, depending on the chosen initial cluster means. Therefore, the algorithm was repeated 5000 times, and the model with the lowest WCSS was selected.
= −
∼
P P P
sd log( ) log( )
,
ij
ij i
P
log( )i (5)
in whichPijis parameter valueifor metabolitej.
A range of 4–10 clusters of metabolites was obtained on basis of an elbow plot (Fig. S2). For each candidate clustering, a PKPD model was developed estimating a single EMAX,EC50andkOUTper cluster and a
separate baseline and RV per metabolite. The best model was selected on basis ofΔOFV < 16.27 (p< 0.001,df= 3), as compared with the next candidate cluster model.
Parameter estimates forEMAX,EC50andkOUTappeared similar
be-tween some clusters and allowed model simplification by sharing parameters among different clusters. The initial sharing was based on similarity of parameter estimates. The reduction was performed in a stepwise approach. Thefirst step consisted of reducing three separate models each sharing onlyEMAX, EC50orkOUT. In a second step, dual
combinations of these models were evaluated. The third and last step consisted of testing a shared value for all three parameters. In all three steps, the reduced models were rejected if they were significantly dif-ferent from the non-reduced model (p< 0.05).
Finally, the best model was compared to a baseline model that did
not include a drug effect component (i.e.DE= 0 in Eq.(5)). AΔOFV significance threshold was calculated to be 16.00 for each single me-tabolite, taking into account the family wise error rate (FWER) using Bonferroni correction. The results were compared to a partial least squares discriminant analysis (PLS-DA) on the data pooled per dose group, using the R-package mixOmics (Cao et al., 2016) after log-transformation and autoscaling of the data (excluding t = 0). A Vari-able Importance in Projection (VIP) on thefirst principal component was calculated for each metabolite. Metabolites with a VIP score > 1 were reported as contributing significantly to a dose response relation for remoxipride and compared to those selected from the PKPD clus-tering approach. The methods were compared by a weighted Cohen's kappa-analysis.
3. Results
3.1. PKPD models of remoxipride effect on individual metabolites
The biogenic amine analysis detected 44 metabolites in plasma with good reproducibility (RSDQC≤15%). Unfortunately, due to metabolite degradation and detection limits, the biogenic amines could not reliably be measured in microdialysate samples. The plasma metabolites showed a general dose dependent decrease from baseline (t = 0 h) in the treatment groups (Fig. 1) with different longitudinal patterns, some of them showing a slow and others a more rapid return to baseline (Fig. 1). The placebo group showed an increase from baseline for many metabolites, which we initially attempted to describe by the mathe-matical Bateman function that previously has been used to describe such placebo response (Shang et al., 2009). This, however, did not re-sult in an improved description of the data as compared to a model without a placebo effect included (Bonferroni correctedp > 0.05).
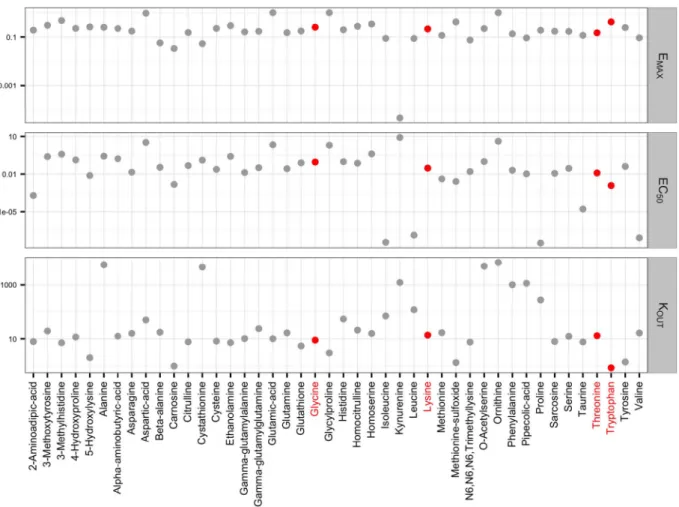
Since the metabolite responses were decreasing after treatment, the effect of remoxipride was mathematically described as an inhibition of the metabolite production rates (Eqs. (4) & (5)) for each individual metabolite, in a turnover model. TheEMAX for the metabolite
kynur-enine approached zero, indicating that remoxipride had no effect on this metabolite (Fig. 2). Furthermore, some metabolites showed a si-milar parameter pattern (e.g. glycine versus lysine), whereas others exhibited different characteristics (e.g. threonine versus tryptophan) (Fig. 2, indicated in pink). Particularly, the EC50andkOUTestimates
were different for some metabolites (Figs. 2, S3).
3.2. PKPD models of remoxipride effect on clusters of endogenous metabolites
Metabolite clusters were identified on basis of the parameter esti-mates forEMAX,EC50andKOUT. Using the multi-model k-means
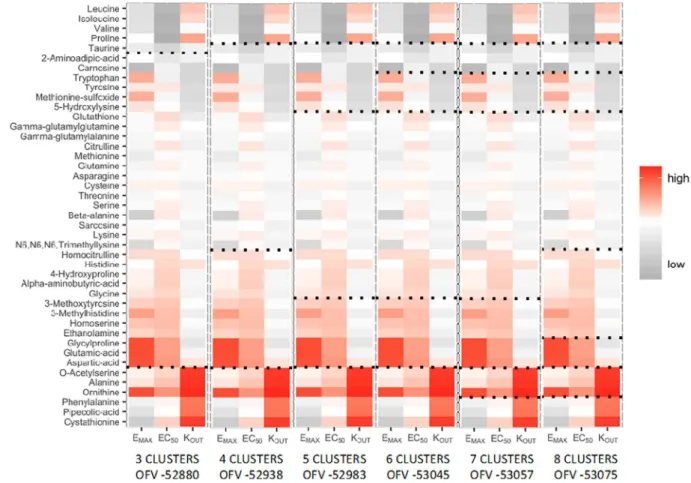
clus-tering approach and subsequent cluster-based turnover model devel-opment (seeMethodssection), the model with 6 clusters was found to bestfit the data (Fig. 3). This model was significantly different from the 5-cluster model (ΔOFV > 16.27,p < 0.001,df= 3), but not from the 7-cluster model (ΔOFV < 16.27,p> 0.001,df= 3).
Parameter sharing led to a further simplification of the model with 6 less parameters. The more complex model was not significantly dif-ferent from the simplified model (ΔOFV < 12.59,p> 0.05,df= 6) and the parameter estimates were highly similar (Fig. 4). We identified four differentEMAX, four differentEC50, and four differentkOUT
except for theEC50in cluster 3 (RSE > 50%). The predicted centroids (i.e. the time and dose dependent average cluster response) showed good agreement with the observed centroids (Fig. 5). Ornithine (cluster 2) was excluded from this graph, since the effect on ornithine was in the positive direction. The single metabolite responses for ornithine and the other metabolites were reasonably to well predicted (Fig. S5).
3.3. Identification of potential plasma biomarkers for remoxipride effect
As indicated inFig. 6and Table SI, the model including the drug effect significantly outperformed the model without drug effect for 18 metabolites (ΔOFV > 16.00,adjusted p < 0.05,df= 3).
3 metabolites (cluster 3) showed a high impact of remoxipride (EMAX/EC50= 122), 13 metabolites (clusters 2 and 6) a medium impact (EMAX/EC50= 5–8), whereas 2 metabolites (cluster 4) showed a low impact (EMAX/EC50= 2). The turnover rate was high (9.9/h) for clus-ters 2, 4 and 6, and low (0.96/h) for cluster 3.
The PLS-DA revealed 18 metabolites with a VIP score > 1 with 13 metabolites overlapping and a Cohen's kappa of 0.38, suggesting a fair agreement between the two methods (Table 2).
4. Discussion
This study showed how the integration of pharmacometabolomics and PKPD modeling led to identification and significant description of 4 clusters of pharmacodynamic patterns. The model predicts the diverse longitudinal effects of remoxipride on endogenous metabolites in
plasma using a clustering approach. We propose 18 metabolites as potential biomarkers of remoxipride pharmacology.
Earlier clustering approaches have been dedicated to cluster time dependent multivariate responses. As a next step, the current method deals with the complex non-linear (concentration-effect relations are typically sigmoidal), time dependent (biological processes differ in their rates of change upon pharmacological treatment) and multivariate dose response data by step-wise integration of PKPD modeling and clus-tering. The model is therefore suited for predicting the multivariate dose-response relation for remoxipride with time and dose. Moreover, the model provides pharmacological meaning with the parameters that determine the concentration-effect relation (EMAX,EC50) and the
long-itudinal behavior of the response (kOUT).
Many metabolites identified by the PKPD clustering method were also obtained by PLS-DA (Table 2), although PLS-DA assumes linear dose-response relations, and does not account for the time dependent response behavior. Other metabolites were only identified by one of the methods. This raises the question under which conditions the methods are in agreement and when they contradict each other. As an illus-trative example, homoserine shows a longitudinal dose-dependent re-sponse, which was captured by the PKPD clustering, despite the high variability. The dose-dependency was not visible if the serial data is pooled per dose group for PLS-DA analysis (Fig. S4, A1 vs. A2). On the other hand, glycylproline was only identified by PLS-DA. This is ex-plained by a decrease with 3.5 mg/kg remoxipride relative to the other dose levels when pooling the data per dose group, which does not ap-pear as a dose dependent decrease from baseline (Fig. S4, B1 vs. B2).
Random variation in the data interfered thus both for homoserine and glycylproline with the pooled dose response analysis (Fig. S4 - A2, B2, C2), and thus with PLS-DA. This suggests that the PKPD clustering method outperforms PLS-DA if random variation dominates the re-sponse. In contrast to homoserine and glycylproline, tyrosine showed a clear dose response, also as a longitudinal decrease from baseline, and was only identified by PLS-DA (Fig. S4, C1 vs. C2). Whereas the PKPD clustering method failed to identify tyrosine, it showed a significant response in the single metabolite model (ΔOFV = 31.19). The clus-tering thus negatively affected thefitting of the tyrosine response, while overall the 6-cluster model was identified as the best model. It is con-cluded that the clustering could not identify the cluster for the unique tyrosine response pattern. Further investigation did not show other cases in which the single metabolite model outperformed the cluster model.
There are clusters associated with metabolic pathways, providing a biological context of the clustering results. The branched chain amino acids (BCAA) are clustered into cluster 1, although this cluster showed no significant effect of remoxipride (Fig. 6). Cluster 6 is associated with the glycine, serine and threonine metabolism. Others have also found an association of D2R antagonism with this pathway, for example a decrease of glycine in plasma (Xuan et al., 2011), a decrease of glycine and serine (Baruah et al., 1993) as well as an increase of homoserine in brain tissue (McClay et al., 2015). Serine is actively transported into the brain, where it is converted to glycine and phosphatidylcholine, both implicated in memory function (Woronczak et al., 1995). Serine and glycine both modulate NMDA receptors, which play a main role in the glutamate pathway in the brain. Although plasma glutamate itself was not changed by remoxipride, such interaction may exist in the brain. This would not be surprising, since dopamine and glutamate systems in
the brain are highly interrelated (Javitt, 2007). Furthermore, cluster 3 included tyrosine and tryptophan, the precursors of dopamine and serotonin, respectively. Dopamine levels are increased in different brain regions after treatment with D2R antagonists (Tanda et al., 2015). Furthermore, both tyrosine and tryptophan are converted to their neurotransmitters by the aromatic amino acid decarboxylase (AAAD) enzyme, of which the activity was increased after remoxipride and other D2R antagonist's treatment (Hadjiconstantinou and Neff, 2008). The decreased tyrosine and tryptophan levels in plasma may therefore be explained by the increased uptake into the brain to refill their brain stores after increased conversion to dopamine and serotonin. These connections to pathways show how remoxipride has a potential inter-action with multiple biological pathways. Further studies to these in-teractions should confirm the hypotheses that are generated by this study.
The different time and concentration dependent patterns in our data suggest a multilevel interaction between remoxipride and the metabolic system. It is not deducible what the exact origin of these differences is, but there are possible explanations. It might be partly caused by on-target versus off-target effects, considering the large differences in
EMAX/EC50ratio between the clusters (Table SI). Although remoxipride is very selective compared to other dopamine D2R antagonists, it also has affinity for other receptors, for example theσ-receptors (Köhler et al., 1990). The differential patterns might also be explained by re-moxipride having a potential effect in multiple tissues. The dopamine D2 receptor is not only expressed in the brain, but also in many other tissues (Uhlén et al., 2015). Different tissues may have different re-ceptor concentrations affectingEMAXandEC50, and different drug
Fig. 3.K-means clustering results for 3–8 candidate clusters. Black dotted lines indicate the cluster separation. OFV values are shown for each candidate PKPD cluster model.
Fig. 4.The effect of parameter reduction on the parameter estimates ofEMAX,EC50andkOUTwere evaluated for each cluster, comparing the estimates before (black bars) and after (grey
Typically, enzymatic conversion rates of biogenic amines are > 1000/h (BRENDA Enzyme Database, 2017), while their BBB transport rates are in the range of 0.1–10/h (Pardridge, 1977), similar to thekOUTvalues
that we identified. Finally, even when bound to the same receptor in the same tissue, multiple downstream pathways might have been affected with differential time and concentration dependent patterns. This idea
is clearly illustrated by the differential gene expression patterns in the liver after antagonism of the glucocorticoid receptor (Jin et al., 2003). We are aware of limitations that are to be addressed in future stu-dies. Unfortunately, the information on the dopaminergic pathway was limited because the analytical reproducibility was not sufficient for dopamine and its metabolite 3-methoxytyrosine. Moreover, dopamine metabolites 3,4-dihydroxyphenylacetic acid (DOPAC) and homovanillic acid (HVA), as well as the dopamine precursor L -3,4-dihydrox-yphenylalanine (L-DOPA) were not measurable by the current analy-tical platform. Activity of the dopamine pathway in the current ex-periment is nevertheless illustrated by significant response of tyrosine in the single metabolite model.
Furthermore, data that we obtained on metabolite concentrations in brainECFcould not be used because of assay limitations. The relation between metabolite concentrations in plasma and the brain (or CSF) is not straightforward; they do not always correlate (Curzon and Knott, 1974; Jimhez-jimcnez et al., 1996; Lewitt et al., 2017; Mans et al., 1979). Good insight into this relation is crucial for the application of blood-based biomarkers in CNS pharmacology. Simultaneous analysis of biomarker-data in brain and blood would be highly valuable in translational CNS drug development because the brain provides in-formation on drug effects at the site of action, while blood is better accessible in humans. Moreover, such analysis would enable the se-paration of effects in the brain from those in the periphery. Further work should improve the application of metabolomics on micro-dialysate samples to enable the identification of the longitudinal bio-marker response in brain and plasma simultaneously.
Taking into consideration these discussions, our analysis framework that we developed on preclinical data is also promising in a clinical
Table 1
Parameter estimates for the PKPD cluster model describing the multiple metabolite re-sponses in 6 different response clusters.
Parameter Estimate (RSE%)
Cluster 1 (4 metabolites)
EMAX 0.093 (7)
EC50(μM) ~ 0 (fix)
kOUT(h−1) 39 (182)
Cluster 2 (6 metabolites)
EMAX 0.093 (7)
EC50(μM) 0.019 (19)
kOUT(h−1) 9.9 (15)
Cluster 3 (4 metabolites)
EMAX 0.33 (19)
EC50(μM) 0.0027 (72)
kOUT(h−1) 0.96 (23)
Cluster 4 (7 metabolites)
EMAX 0.22 (23)
EC50(μM) 0.12 (43)
kOUT(h−1) 9.9 (15)
Cluster 5 (3 metabolites)
EMAX 0.093 (7)
EC50(μM) ~ 0 (fix)
kOUT(h−1) 1.3 (51)
Cluster 6 (19 metabolites)
EMAX 0.16 (6)
EC50(μM) 0.019 (19)
kOUT(h−1) 9.9 (15)
Note: cluster 0 is not included since it represented the metabolite (kynurenine) that was not affected by remoxipride.
context. Pharmacometabolomics is increasingly used to provide insights into between-subject variability in drug response (Kaddurah-Daouk et al., 2015). It is similarly important, or perhaps even more so, to identify the particular causes of variable drug responses when ana-lyzing larger and typically more variable clinical datasets. Application of PKPD based multivariate data analysis is envisioned to increase un-derstanding of inter-individual variability of pharmacometabolomics responses. Additionally, the current framework provides the basis for interspecies translation of pharmacometabolomics responses. Applying the principles of allometric scaling can be used to scale the clearances and rate constants, while physiological information with regard to re-ceptor functionality can be implemented to scale theEMAXand theEC50 parameters (Danhof et al., 2008;Mager et al., 2009). Interestingly, the metabotype is highly conserved among mammalian species (van der Greef et al., 2006). It is therefore anticipated that the combination of PKPD based multivariate data analysis and interspecies scaling will improve the dose selection in early clinical development.
In conclusion, we have laid out the basis for the integration of pharmacometabolomics and PKPD modeling. The developed PKPD cluster model predicts the different biochemical responses in plasma for a range of remoxipride doses and provided comprehensive insights in its drug effects. The study design with multiple dose levels and time serial sampling, together with an analytical method that measured a large number of metabolites enabled this model-based approach that mathematically linked the PK and the multiple PD responses. Remoxipride showed 6 differential response patterns, indicating a multilevel interaction between the drug and the biochemical system. In particular, the glycine, serine and threonine pathway, as well as the
Fig. 6.ΔOFV for each metabolite between the baseline model with no drug effect component and the best model with drug effect component. The light grey line indicates the significance threshold with no Bonferroni correction (α= 0.05), whereas the dark grey line indicates the sig-nificance threshold with Bonferroni correction (α= 0.05/ 44). Clusters are indicated by the different symbols.
Table 2
Metabolites identified to show a significant dose response with PLS-DA and PKPD based clustering.
Metabolite PLS-DAa PKPD based clusteringb
3-Methylhistidine X
4-Hydroxyproline X
5-Hydroxylysine X X
Asparagine X X
Beta-alanine X
Citrulline X
Cysteine X X
Ethanolamine X
Gamma-glutamylalanine X X
Glutamine X X
Glycylproline X
Glycine X X
Histidine X X
Homocitrulline X
Homoserine X
Lysine X X
Methionine X
Methionine-sulfoxide X X
Phenylalanine X
Sarcosine X
Serine X X
Threonine X X
Tryptophan X
Tyrosine X
Total 17 18
aMetabolites with a VIP score > 1.
precursors of dopamine and serotonin, were influenced by remoxipride. It is envisioned that PKPD clustering could serve as an initial framework for the development of mechanistic systems pharmacology models.
Supplementary data to this article can be found online athttp://dx. doi.org/10.1016/j.ejps.2017.08.031.
Acknowledgements
We thank Robin Hartman and Matthijs de Bruin for performing the surgeries and experiments and Dirk-Jan van den Berg for performing the remoxipride analysis. We thank Nelus Schoeman for the valuable discussion on the potential biological pathways involved in remoxipride pharmacology.
Authorship contributions
Participated in research design: Van den Brink, De Lange.
Conducted experiments: Van den Brink, Gonzalez-Amoros.
Performed data analysis: Van den Brink, Elassaiss-Schaap.
Wrote or contributed to the writing of the manuscript: Van den Brink, Elassaiss-Schaap, Harms, Van der Graaf, Hankemeier, De Lange.
Conflicts of interest
The authors have no conflicts of interest to declare.
Funding sources
This research did not receive any specific grant from funding agencies in the public, commercial, or not-for-profit sectors.
References
Bar-Joseph, Z., Gerber, G., Simon, I., Gifford, D.K., Jaakkola, T.S., 2003. Comparing the continuous representation of time-series expression profiles to identify differentially expressed genes. Proc. Natl. Acad. Sci. U. S. A. 100, 10146–10151.http://dx.doi.org/ 10.1073/pnas.1732547100.
Bartel, J., Krumsiek, J., Theis, F.J., 2013. Statistical methods for the analysis of high-throughput metabolomics data. Comput. Struct. Biotechnol. J. 4, e201301009. http://dx.doi.org/10.5936/csbj.201301009.
Baruah, S., Waziri, R., Sherman, A., 1993. Neuroleptic effects on serine and glycine metabolism. Biol. Psychiatry 34, 544–550. http://dx.doi.org/10.1016/0006-3223(93)90197-L.
BRENDA Enzyme Database, 2017. [WWW Document]. URL.www.brenda-enzymes.org, Accessed date: 19 May 2017.
Burt, T., Nandal, S., 2016. Pharmacometabolomics in early-phase clinical development. Clin. Transl. Sci. 9, 128–138.http://dx.doi.org/10.1111/cts.12396.
Cao, K.-A. Le, Rohart, F., Gonzalez, I., Dejean, S., 2016. mixOmics: Omics Data Integration Project. R Package Version 6.1.1.https://CRAN.R-project.org/package= mixOmics.
Curzon, G., Knott, P.J., 1974. Effects on Plasma and Brain Tryptophan in the Rat of Drugs and Hormones That Influence the Concentration of Unesterified Fatty Acid in the Plasma. pp. 197–204.
Danhof, M., Alvan, G., Dahl, S.G., Kuhlmann, J., Paintaud, G., 2005. Mechanism-based pharmacokinetic-pharmacodynamic modeling-a new classification of biomarkers. Pharm. Res. 22, 1432–1437.http://dx.doi.org/10.1007/s11095-005-5882-3. Danhof, M., de Jongh, J., De Lange, E.C.M., Della Pasqua, O., Ploeger, B. a, Voskuyl, R. a,
2007. Mechanism-based pharmacokinetic-pharmacodynamic modeling: biophase distribution, receptor theory, and dynamical systems analysis. Annu. Rev. Pharmacol. Toxicol. 47, 357–400.http://dx.doi.org/10.1146/annurev.pharmtox.47.120505. 105154.
Danhof, M., de Lange, E.C.M., Della Pasqua, O.E., Ploeger, B.a., Voskuyl, R.a., 2008. Mechanism-based pharmacokinetic-pharmacodynamic (PK-PD) modeling in transla-tional drug research. Trends Pharmacol. Sci. 29, 186–191.http://dx.doi.org/10. 1016/j.tips.2008.01.007.
de Hoon, M., Imoto, S., Miyano, S., 2002. Statistical analysis of a small set of time-ordered gene expression data using linear splines. Bioinformatics 18, 1477–1485. de Lange, E.C., 2013. The mastermind approach to CNS drug therapy: translational
prediction of human brain distribution, target site kinetics, and therapeutic effects. Fluids Barriers CNS 10, 12.http://dx.doi.org/10.1186/2045-8118-10-12. de Lange, E.C.M., Hammarlund-Udenaes, M., 2015. Translational aspects of blood-brain
barrier transport and central nervous system effects of drugs: from discovery to pa-tients. Clin. Pharmacol. Ther. 97, 380–394.http://dx.doi.org/10.1002/cpt.76. de Lange, E.C.M., Ravenstijn, P.G.M., Groenendaal, D., van Steeg, T.J., 2005. Toward the
prediction of CNS drug-effect profiles in physiological and pathological conditions
using microdialysis and mechanism-based pharmacokinetic-pharmacodynamic modeling. AAPS J. 7, E532–E543.http://dx.doi.org/10.1208/aapsj070354. de Witte, W.E.A., Danhof, M., van der Graaf, P.H., de Lange, E.C.M., 2016. In vivo target
residence time and kinetic selectivity: the association rate constant as determinant. Trends Pharmacol. Sci. 37, 831–842.http://dx.doi.org/10.1016/j.tips.2016.06.008. Déjean, S., Martin, P.G.P., Baccini, A., Besse, P., 2007. Clustering time-series gene
ex-pression data using smoothing spline derivatives. EURASIP J. Bioinforma. Syst. Biol. 2007, 1–10.http://dx.doi.org/10.1155/2007/70561.
Derendorf, H., Meibohm, B., 1999. Modeling of pharmacokinetic/pharmacodynamic (PK/ PD) relationships: concepts and perspectives. Pharm. Res.http://dx.doi.org/10. 1023/A:1011907920641.
Hadjiconstantinou, M., Neff, N.H., 2008. Enhancing aromaticL-amino acid decarboxylase
activity: implications for L-DOPA treatment in Parkinson's disease. CNS Neurosci. Ther. 14, 340–351.http://dx.doi.org/10.1111/j.1755-5949.2008.00058.x. Hayes, R.L., Robinson, G., Muller, U., Wang, K.K.W., 2009. Translation of neurological
biomarkers to clinically relevant platforms. Methods Mol. Biol. 566, 303–313.http:// dx.doi.org/10.1007/978-1-59745-562-6.
Hurko, O., 2009. The uses of biomarkers in drug development. Ann. N. Y. Acad. Sci. 1180, 1–10.http://dx.doi.org/10.1111/j.1749-6632.2009.04946.x.
Hurko, O., Ryan, J.L., 2005. Translational research in central nervous system drug dis-covery. NeuroRx 2, 671–682.http://dx.doi.org/10.1602/neurorx.2.4.671. Javitt, D.C., 2007. Glutamate and schizophrenia: phencyclidine,N-methyl-D-aspartate
receptors, and dopamine-glutamate interactions. Int. Rev. Neurobiol. 78, 69–108. http://dx.doi.org/10.1016/S0074-7742(06)78003-5.
Jimhez-jimcnez, F.J., Molina, A., Vargas, C., Gmez, P., Navarro, A., Benito-leh, J., Orti-pareja, M., Gasalla, T., Cisneros, E., Arenas, J., 1996. Neurotransmitter Amino Acids in Cerebrospinal Fluid of Patients With Parkinson's Disease. 141. pp. 39–44. Jin, J.Y., Almon, R.R., DuBois, D.C., Jusko, W.J., 2003. Modeling of corticosteroid
pharmacogenomics in rat liver using gene microarrays. J. Pharmacol. Exp. Ther. 307, 93–109.http://dx.doi.org/10.1124/jpet.103.053256.
Kaddurah-Daouk, R., McEvoy, J., Baillie, R. a, Lee, D., Yao, J.K., Doraiswamy, P.M., Krishnan, K.R.R., 2007. Metabolomic mapping of atypical antipsychotic effects in schizophrenia. Mol. Psychiatry 12, 934–945.http://dx.doi.org/10.1038/sj.mp. 4002000.
Kaddurah-Daouk, R., Kristal, B.S., Weinshilboum, R.M., 2008. Metabolomics: a global biochemical approach to drug response and disease. Annu. Rev. Pharmacol. Toxicol. 48, 653–683.http://dx.doi.org/10.1146/annurev.pharmtox.48.113006.094715. Kaddurah-Daouk, R., Weinshilboum, R., Pharmacometabolomics Research Network,
2015. Metabolomic signatures for drug response phenotypes: pharmacometabolomics enables precision medicine. Clin. Pharmacol. Ther. 98, 71–75.http://dx.doi.org/10. 1002/cpt.134.
Köhler, C., Hall, H., Magnusson, O., Lewander, T., Gustafsson, K., 1990. Biochemical pharmacology of the atypical neuroleptic remoxipride. Acta Psychiatr. Scand. Suppl. 358, 27–36.
Kola, I., Landis, J., 2004. Can the pharmaceutical industry reduce attrition rates? Nat. Rev. Drug Discov. 3, 711–715.http://dx.doi.org/10.1038/nrd1470.
Lewitt, P.A., Lu, M., Auinger, P., 2017. Metabolomic Biomarkers as Strong Correlates of Parkinson Disease Progression.
Mager, D.E., Woo, S., Jusko, W.J., 2009. Scaling pharmacodynamics from in vitro and preclinical animal studies to humans. Drug Metab. Pharmacokinet. 24, 16–24.http:// dx.doi.org/10.1016/j.str.2010.08.012.Structure.
Mans, A.M., Saunders, S.J., Kirsch, R.E., Biebuyck, J.F., 1979. Correlation of plasma and brain amino acid and putative neurotransmitter alterations during acute hepatic coma in the rat. J. Neurochem. 32, 285–292.
McClay, J.L., Vunck, S.A., Batman, A.M., Crowley, J.J., Vann, R.E., Beardsley, P.M., van den Oord, E.J., 2015. Neurochemical metabolomics reveals disruption to sphingo-lipid metabolism following chronic haloperidol administration. J. NeuroImmune Pharmacol. 10, 425–434.http://dx.doi.org/10.1038/ja.2013.113.Venturicidin. Morgan, P., Van Der Graaf, P.H., Arrowsmith, J., Feltner, D.E., Drummond, K.S., Wegner,
C.D., Street, S.D. a, 2012. Can theflow of medicines be improved? Fundamental pharmacokinetic and pharmacological principles toward improving phase II survival. Drug Discov. Today 17, 419–424.http://dx.doi.org/10.1016/j.drudis.2011.12.020. Noga, M.J., Dane, A., Shi, S., Attali, A., van Aken, H., Suidgeest, E., Tuinstra, T., Muilwijk,
B., Coulier, L., Luider, T., Reijmers, T.H., Vreeken, R.J., Hankemeier, T., 2012. Metabolomics of cerebrospinalfluid reveals changes in the central nervous system metabolism in a rat model of multiple sclerosis. Metabolomics 8, 253–263.http://dx. doi.org/10.1007/s11306-011-0306-3.
Pardridge, W.M., 1977. Kinetics of competitive inhibition of neutral amino acid transport across the blood-brain barrier. J. Neurochem. 28, 103–108.
Ramakrishnan, R., DuBois, D.C., Almon, R.R., Pyszczynski, N.A., Jusko, W.J., 2002. Fifth-generation model for corticosteroid pharmacodynamics: application to steady-state receptor down-regulation and enzyme induction patterns during seven-day con-tinuous infusion of methylprednisolone in rats. J. Pharmacokinet. Pharmacodyn. 29, 1–24.http://dx.doi.org/10.1016/j.pestbp.2011.02.012.Investigations.
Semmar, N., 2012. Metabotype concept:flexibility, usefulness and meaning in different biological populations. Metabolomics 131–166.http://dx.doi.org/10.5772/33303. Shang, E.Y., Gibbs, M.A., Landen, J.W., Krams, M., Russell, T., Denman, N.G., Mould,
D.R., 2009. Evaluation of structural models to describe the effect of placebo upon the time course of major depressive disorder. J. Pharmacokinet. Pharmacodyn. 36, 63–80.http://dx.doi.org/10.1007/s10928-009-9110-3.
Smilde, A.K., Jansen, J.J., Hoefsloot, H.C.J., Lamers, R.J. a N., van der Greef, J., Timmerman, M.E., 2005. ANOVA-simultaneous component analysis (ASCA): a new tool for analyzing designed metabolomics data. Bioinformatics 21, 3043–3048. http://dx.doi.org/10.1093/bioinformatics/bti476.
Stevens, J., Ploeger, B.A., Hammarlund-Udenaes, M., Osswald, G., Van Der Graaf, P.H., Danhof, M., De Lange, E.C.M., 2012. Mechanism-based PK-PD model for the prolactin biological system response following an acute dopamine inhibition challenge: quantitative extrapolation to humans. J. Pharmacokinet. Pharmacodyn. 39, 463–477. http://dx.doi.org/10.1007/s10928-012-9262-4.
Tanda, G., Valentini, V., De Luca, M.A., Perra, V., Serra, G. Pietro, Di Chiara, G., 2015. A systematic microdialysis study of dopamine transmission in the accumbens shell/core and prefrontal cortex after acute antipsychotics. Psychopharmacology 232, 1427–1440.http://dx.doi.org/10.1007/s00213-014-3780-2.
Tukey, J.W., 1977. Exploratory Data Analysis. Addison-Wesley.
Uhlén, M., Fagerberg, L., Hallström, B.M., Lindskog, C., Oksvold, P., Mardinoglu, A., Sivertsson, Å., Kampf, C., Sjöstedt, E., Asplund, A., Olsson, I., Edlund, K., Lundberg, E., Navani, S., Szigyarto, C.A., Odeberg, J., Djureinovic, D., Takanen, J.O., Hober, S., Alm, T., Edqvist, P., Berling, H., Tegel, H., Mulder, J., Rockberg, J., Nilsson, P., Schwenk, J.M., Hamsten, M., Von Feilitzen, K., Forsberg, M., Persson, L., Johansson, F., Zwahlen, M., Heijne, G. Von, Nielsen, J., Pontén, F., 2015. Tissue-based map of the human proteome. Science 347 (6220).http://dx.doi.org/10.1126/science.1260419. van den Brink, W.J., Wong, Y.C., Gülave, B., van der Graaf, P.H., de Lange, E.C.M., 2016.
Revealing the neuroendocrine response after remoxipride treatment using multi-biomarker discovery and quantifying it by PK/PD modeling. AAPS J.http://dx.doi. org/10.1208/s12248-016-0002-3.
Van Der Greef, J., Mcburney, R.N., 2005. Rescuing drug discovery: in vivo systems pa-thology and systems pharmacology. Nat. Rev. Drug Discov. 4, 961–968.
van der Greef, J., Adourian, A., Muntendam, P., McBurney, R.N., 2006. Lost in transla-tion? Role of metabolomics in solving translational problems in drug discovery and development. Drug Discov. Today Technol. 3, 205–211.http://dx.doi.org/10.1016/j. ddtec.2006.05.003.
Van Der Kloet, F.M., Bobeldijk, I., Verheij, E.R., Jellema, R.H., 2009. Analytical error reduction using single point calibration for accurate and precise metabolomic phe-notyping. J. Proteome Res. 8, 5132–5141.http://dx.doi.org/10.1021/pr900499r. Westerhout, J., Ploeger, B., Smeets, J., Danhof, M., Lange, E.C.M., 2012. Physiologically
based pharmacokinetic modeling to investigate regional brain distribution kinetics in rats. AAPS J. 14, 543–553.http://dx.doi.org/10.1208/s12248-012-9366-1. Woronczak, J.P., Siucińska, E., Kossut, M., Barańska, J., 1995. Temporal dynamics and
regional distribution of [14C]serine uptake into mouse brain. Acta Neurobiol. Exp. (Wars) 55, 233–241.
Xuan, J., Pan, G., Qiu, Y., Yang, L., Su, M., Liu, Y., Chen, J., Feng, G., Fang, Y., Jia, W., Xing, Q., He, L., 2011. Metabolomic profiling to identify potential serum biomarkers for schizophrenia and risperidone action. J. Proteome Res. 10, 5433–5443.http://dx. doi.org/10.1021/pr2006796.