© The Author 2016. Published by Oxford University Press on behalf of The Gerontological Society of America. All rights reserved. For permissions, please e-mail: [email protected].
cite as: J Gerontol A Biol Sci Med Sci,2017, Vol. 72, No. 8, 1130–1136 doi:10.1093/gerona/glw200 Advance Access publication November 3, 2016
Research Article
The Importance of Mid-to-Late-Life Body Mass Index
Trajectories on Late-Life Gait Speed
B. Gwen Windham,
1Michael E. Griswold,
2Wanmei Wang,
2Anna Kucharska-Newton,
3Ellen W. Demerath,
4Kelley Pettee Gabriel,
5Lisa A. Pompeii,
6Kenneth Butler,
1Lynne Wagenknecht,
7Stephen Kritchevsky,
8and Thomas H. Mosley Jr
11Department of Medicine/Geriatrics and 2Department of Data Science, University of Mississippi Medical Center, Jackson. 3Department of Epidemiology, University of North Carolina at Chapel Hill. 4Division of Epidemiology and Community Health, University of Minnesota School of Public Health, Minneapolis. 5University of Texas School of Public Health in Austin, Department of Epidemiology, Human Genetics, and Environmental Sciences. 6University of Texas School of Public Health, Department of Epidemiology, Human Genetics, and Environmental Sciences. 7Center on Diabetes, Obesity, and Metabolism; Wake Forest School of Medicine, Winston-Salem, North Carolina. 8Sticht Center on Aging; Wake Forest School of Medicine, Winston-Salem, North Carolina.
Address correspondence to B. Gwen Windham, MD MHS, Department of Medicine/Geriatrics, University of Mississippi Medical Center, 2500 North State Street, Jackson, MS 39216. E-mail: [email protected]
Received April 14, 2016; Accepted September 21, 2016 Decision Editor: James Goodwin, MD
Abstract
Background: Prior studies suggest being overweight may be protective against poor functional outcomes in older adults.
Methods: Body mass index (BMI, kg/m2) was measured over 25 years across five visits (1987–2011) among Atherosclerosis Risk in Communities
Study participants (baseline Visit 1 n = 15,720, aged 45–64 years). Gait speed was measured at Visit 5 (“late-life”, aged ≥65 years, n = 6,229). BMI trajectories were examined using clinical cutpoints and continuous mixed models to estimate effects of patterns of BMI change on gait speed, adjusting for demographics and comorbidities.
Results: Mid-life BMI (baseline visit; 55% women; 27% black) was associated with late-life gait speed 25 years later; gait speeds were 94.3, 89.6, and 82.1 cm/s for participants with baseline normal BMI (<25), overweight (25 ≤ BMI < 30), and obese (BMI ≥ 30) (p < .001). In longitudinal analyses, late-life gait speeds were 96.9, 88.8, and 81.3 cm/s for participants who maintained normal, overweight, and obese weight status, respectively, across 25 years (p < .01). Increasing BMI over 25 years was associated with poorer late-life gait speeds; a 1%/year BMI increase for a participant with a baseline BMI of 22.5 (final BMI 28.5) was associated with a 4.6-cm/s (95% confidence interval: −7.0, −1.8) slower late-life gait speed than a participant who maintained a baseline BMI of 22.5.
Conclusion: Being overweight in older age was not protective of mobility function. Maintaining a normal BMI in mid- and late-life may help preserve late-life mobility.
Keywords: Mobility—Overweight—Longitudinal
Poor mobility leads to disability, institutionalization, increased health care expenditures, and mortality in older adults (1–5). Obesity is a modifiable risk factor and therefore a feasible target for interventions. Growing numbers of overweight and obese persons combined with growing numbers of older adults in the population could result in dra-matic increases in mobility and functionally impaired older persons (6). Recognizing and intervening upon early, modifiable contributors to dis-ability could substantially reduce the associated public health burden.
However, the relationship between obesity and mobility in older adults is complex. Poor mobility and functional status have been associated with low body mass index (BMI) and with weight loss in older adults (7–10), and also with higher mid-life adiposity (11–16). It has been suggested that overweight is potentially protective in older adults (17). Clarity regarding the effects of body weight on mobility in older adults is needed to identify at-risk individuals and to develop interventions targeting risk factors, for example, excess
weight, weight loss, or underlying conditions. An older adult with a normal BMI could be at risk for functional impairment if underly-ing conditions are contributunderly-ing to unintentional weight loss, whereas another with the same BMI that has been maintained across the life span could have excellent function and minimal risk. Thus, failure to consider effects of historical changes in adiposity in addition to current weight may result in inaccurate risk assessments of adiposity on functional outcomes.
Furthermore, despite a higher prevalence of physical disability and mobility impairments in blacks compared with whites (18) and evidence that obesity exposures may differentially affect function in whites and non-whites (19), most studies of mobility lack substantial representation by non-white populations (15–17,20,21). This study examined the relationship of mid-life BMI and changes in BMI from mid- to late-life with late-life gait speed in a large, biracial prospec-tive cohort study.
Methods
Population
The Atherosclerosis Risk in Communities (ARIC) Study is a lon-gitudinal study of cardiovascular disease in community-dwelling, middle-aged adults (baseline: 1987–1989, n = 15,792, 45–64 years) selected through probability sampling from four U.S. communi-ties: Forsyth County, NC; Jackson, MS (exclusively black partici-pants); Minneapolis, MN; and Washington County, MD. The cohort underwent four triennial examinations and a fifth examination in 2011–2013 (Visit 5, n = 6,538). Due to small numbers, blacks at MN and MD (n = 24) and non-black, non-white participants (n = 48) were excluded. Another 25 did not have baseline BMI data, leaving 15,695 with Visit 1 BMI data, of whom 6,229 had Visit 5 gait speed measured. All participants provided informed consent, and institu-tional review boards of each field center approved protocols.
Gait Speed Assessment
At Visit 5, gait speed (cm/s), the preferred measure of mobility and a crucial vital sign of health in older adults (1,22), was measured using a standardized protocol (2,3) across sites. Participants were timed walking 4 m at their usual pace. The faster of the two trials was used. Walking aids were allowed if participants felt unsafe without them. A 10-cm/s slower gait speed is associated with a 12% higher mortality in older adults (5), and 4–5 cm/s is considered a meaning-ful change (23).
Obesity Assessment
Height to the nearest centimeter, and weight, using a beam bal-ance scale, was measured with participants wearing light clothes and no shoes. BMI (kg/m2) was classified using clinical cutpoints:
<25 = Normal; 25 to <30 = Overweight; and ≥30 = Obese.
Covariates
Potential confounders included self-reported age, race/ethnicity, sex, education (<high school, high school graduate, or ≥college), smoking status, and alcohol use. Variables were constructed to define race-site and antihypertensive medication use, diabetes, coronary heart dis-ease (CHD), and systolic and diastolic blood pressure. Diabetes was defined as self-reported use of hypoglycemic medications or fasting glucose ≥140 mg/dL. CHD was defined as self-report of myocardial infarction, cardiac bypass surgery or angioplasty, and adjudication of clinical findings (24) based on electrocardiograms, annual surveillance, medical records, annual telephone follow-up, and death certificates.
Statistical Analysis
Fisher’s exact and Kruskal–Wallis tests were used for categorical and continuous characteristic bivariate associations with BMI categories at Visit 5.
Cross-temporal associations of BMI with gait
Associations of gait speed with BMI categories at each visit were examined. Nonlinear relationships with continuous BMI at each visit were modeled using piecewise linear splines with knots at 25 and 30 kg/m2; coefficients represent the difference in gait speed per
5-unit increase in BMI within a BMI category. Models were adjusted for age, sex, race-site, education, systolic and diastolic blood pres-sure, diabetes, antihypertensive medications, smoking, alcohol use, and CHD; covariate sets were updated at each visit.
Longitudinal BMI trajectory associations with gait
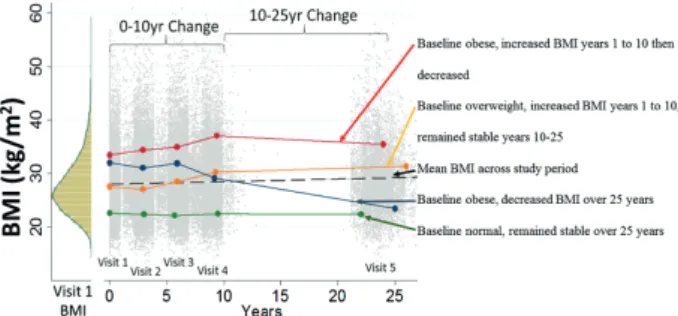
Up to five BMI measures across 25 years were available for each partici-pant (Figure 1). A two-phase analytic framework was used with linear mixed models for longitudinal BMI trajectories in Phase 1; resulting subject-specific empirical-Bayes estimates were associated with univari-ate gait speed using linear regression models in Phase 2. Three BMI trajectory effects were identified: (i) baseline BMI, (ii) 0–10 year %BMI change (Visit 1 to Visit 4), and (iii) 10–25 year %BMI change (Visit 4 to Visit 5). BMI change groups were defined using a 5% window compared with the previous BMI. A 5% change in BMI approximates a clinically important 5% weight change in older adults (25), and ±2.5% approximates the ±3% BMI definition of weight maintenance (26). Longitudinal BMI trajectory groups were defined using the baseline BMI group, 0- to 10-year BMI change (maintained/increased/decreased) and 10- to 25-year BMI change (maintained/increased/decreased), resulting in 27 (3 × 3 × 3) trajectory groups. Linear models were used to assess associations of BMI trajectory groups with gait speed. Additionally, nonlinear relationships with continuous BMI trajectories were mod-eled using three-way interactions of fractional polynomial functions of the primary BMI effects (Baseline BMI, 0- to 10-year %-change, 10- to 25-year %-change), using identical adjustment variables in all models. (See additional details and sensitivity analyses with visit-specific inverse proportional weights to account for deaths and dropouts, full joint modeling and bootstrap approaches in Supplementary Material.)
Results
Obese Visit 5 participants tended to be younger, had poorer health profiles, and were more likely to report black race and lower educa-tion compared with those with normal BMI (Table 1). Exceptions
Figure 1. Visit 1 histogram of body mass index (BMI) (left) and distribution of BMI at each visit. The dashed line is the mean BMI across the study period. Solid lines depict four exemplary individual BMI trajectories from Visit 1 to Visit 5.
were higher total and LDL cholesterol in the normal BMI group, although more obese participants used statin medications. Gait speed was good (≥100 cm/s) (22) in 38% and poor (<60 cm/s) in 7% of the participants (Supplementary Table 1). Those with slower gait speeds were older, had lower education, and were more likely to be women and of black race. Compared with participants who died before Visit 5, Visit 5 participants were younger at the baseline visit, had lower BMI and blood pressure, were more likely to be white, and were less likely to have diabetes or hypertension (Supplementary Table 1).
Cross-Temporal Relationships of BMI and Late-Life Gait Speed
Higher mid-life BMI was associated with slower late-life gait speeds, even at the earliest visit (approximately 25 years earlier) (Table 2). Compared with participants with normal baseline BMI, gait speed was 12 cm/s slower in the baseline obese group (94.3 vs 82.0 cm/s, differ-ence = −12.3 [95% CI: −14.1, −10.5]) and nearly 5 cm/s slower among the overweight group (94.3 vs 89.6 cm/s, difference = −4.7 [95% CI: −6.1, −3.3]). Differences in gait speeds across Visit 5 BMI categories were attenuated but remained statistically significant for the over-weight (β = −2.7 cm/s [95% CI: −4.0, −1.4]) and obese (β = −9.8 cm/s [95% CI: −11.2, −8.3]) groups compared with those with normal BMI.
Nonlinear cross-sectional associations of continuous BMI with gait speed were most apparent at Visit 5 (Supplementary Figure 1) and are reported as the slopes in Table 2 from linear spline models at each visit. Gait speed in late-life was approximately 5 cm/s slower per 5-unit increase in BMI among those with normal (β = −5.4 [95% CI: −8.1,
−2.8]) and overweight BMI (β = −4.6 [95% CI: −6.7, −2.5]) at baseline (mid-life), and nearly 7 cm/s slower among baseline obese participants (β = −6.9 [95% CI: −8.5, −5.2]). Late-life gait speed was also negatively associated with higher late-life BMI in the overweight BMI and obese BMI groups. The association of gait speed with late-life BMI (Visit 5) within the normal BMI group was markedly attenuated and no longer clinically or statistically significant (β = −0.7 [95% CI: −1.6, 3.0]).
Relationships of BMI Trajectories From Mid-Life With Late-Life Gait Speed
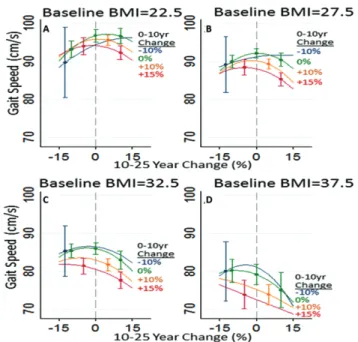
BMI distributions at each visit, the mean population BMI trajec-tory, and four individual trajectories are illustrated in Figure 1. Most BMI changes were within ±15% and were primarily increases (Supplementary Figure 2). Participants whose BMI increased in Years 0–10 and again in Years 10–25 included 49% of those with normal baseline BMI, 45% of baseline overweight participants, and 37% with baseline obese BMI. Table 3 depicts expected gait speeds for the longi-tudinal BMI trajectory classes, illustrating the impact of mid-life BMI on late-life gait speed. The impacts of baseline BMI and trajectories of BMI on gait speed are further illustrated in Figure 2. Trajectories over Years 0–10 are represented by colored lines representing specific percent changes in BMI. BMI changes in Years 10–25 are shown on the x-axis. Both maintaining higher BMI and increasing BMI were associated with poorer gait speed compared with maintaining BMI, especially a normal BMI. For example, compared with maintaining a BMI of 22.5 across all years, the same baseline BMI with increases of 10% in Years 0–10 and another 10% in Years 10–25 was associated with slower late-life Table 1. Visit 5 Population Characteristics by Visit 5 Body Mass Index Category
Visit 5 BMI (kg/m2) Category
V5 Characteristics Total (N = 6,229)
BMI < 25 25 ≤ BMI < 30 BMI ≥ 30
p Value
n = 1,621 (26%) n = 2,449 (39%) n = 2,159 (35%)
Age (years) 75.6 (5.2) 76.4 (5.4) 75.9 (5.3) 74.6 (4.7) <.001
Women 3,647 (59%) 1,040 (64%) 1,299 (53%) 1,308 (61%) <.001
Black 1,473 (24%) 276 (17%) 521 (21%) 676 (31%) <.001
Site-race
Forsyth-Black 97 (2%) 18 (1%) 39 (2%) 40 (2%) <.001
Jackson-Black 1,376 (22%) 258 (16%) 482 (20%) 636 (29%)
Forsyth-White 1,292 (21%) 441 (27%) 523 (21%) 328 (15%)
Minneapolis-White 1,829 (29%) 518 (32%) 750 (31%) 561 (26%)
Washington-White 1,635 (26%) 386 (24%) 655 (27%) 594 (28%)
Education
<High school 913 (15%) 174 (11%) 357 (15%) 382 (18%)
High school 2,577 (41%) 658 (41%) 1,003 (41%) 916 (43%) <.001
College 2,728 (44%) 786 (49%) 1,085 (44%) 857 (40%)
Hypertension 4,595 (75%) 1,006 (63%) 1,804 (74%) 1,785 (83%) <.001
Diabetes 2,000 (33%) 269 (17%) 737 (31%) 994 (47%) <.001
Systolic blood pressure (mmHg) 131 (18.4) 131 (19) 131 (18.0) 130 (18.4) .512 Diastolic blood pressure (mmHg) 67 (10.7) 65 (10.8) 67 (10.5) 68 (10.7) <.001 Total cholesterol (mg/dL) 181.4 (42.0) 189.9 (41.0) 181.0 (42.8) 175.5 (40.7) <.001 HDL cholesterol (mg/dL) 52.2 (14.0) 59.0 (15.6) 51.3 (13.2) 48.1 (11.4) <.001 LDL cholesterol (mg/dL) 104.2 (34.7) 109.3 (33.5) 104.5 (35.5) 100.0 (34.3) <.001
Statin use 3,183 (51%) 671 (42%) 1,338 (55%) 1,174 (55%) <.001
Current smoker 357 (6%) 145 (9%) 124 (5%) 88 (4%) <.001
Drinking status
Current 2,928 (49%) 820 (53%) 1,223 (52%) 885 (43%)
Former 1,755 (29%) 390 (25%) 653 (28%) 712 (34%) <.001
Never 1,292 (22%) 327 (21%) 484 (21%) 481 (23%)
Coronary heart disease 901 (15%) 206 (13%) 405 (17%) 290 (14%) .001
Note: BMI = body mass index.
Table 2.
Adjusted Cross-temporal R
elationships of Body Mass Index at Eac
h
Visit with
Visit 5 Gait Speed
Gait Speed (cm/s) at
V
isit 5 (2011–2013)
BMI (kg/m
2)
N
(%) [Range]
V
isit 5 Gait Speed
Difference (95% CI),
p
V
alue
Slope
W
ithin BMI Group (
β
per 5 kg/m
2 BMI)
Category Across V
isits
Mean (
SE
)
V
isit 1 BMI (1987–1989)
Normal (<25)
n
= 5,187 (33%) [14.2–24.9]
94.3 (0.6) Reference −5.4 (−8.0, −2.8), p < .001 Overweight (25–30) n
= 6,172 (39%) [25.0–29.9]
89.6 (0.5) −4.7 (−6.1, −3.3), p < .001 −4.6 (−6.7, −2.5), p < .001 Obese (>30) n
= 4,336 (28%) [30.0–65.9]
82.1 (0.7) −12.2 (−14.1, −10.4), p < .001 −6.9 (−8.5, −5.2), p < .001 V
isit 2 BMI (1990–1992)
Normal (<25)
n
= 4,441 (31%) [13.7–24.9]
94.7 (0.6) Reference −4.3 (−7.0, −1.7), p = .001 Overweight (25–30) n
= 5,674 (40%) [25.0–29.9]
89.8 (0.5) −4.9 (−6.3, −3.5), p < .001 −4.8 (−6.8, −2.8), p < .001 Obese (>30) n
= 4,139 (29%) [30.0–67.3]
83.3 (0.7) −11.5 (−13.2, −9.7), p < .001 −6.4 (−7.7, −5.1), p < .001 V
isit 3 BMI (1993–1995)
Normal (<25)
n
= 3,520 (27%) [13.3–24.9]
95.3 (0.6) Reference −4.1 (−6.9, −1.3), p = .004 Overweight (25–30) n
= 5,038 (39%) [25.0–29.9]
91.3 (0.5) −4.0 (−5.4, −2.6), p < .001 −5.4 (−7.3, −3.4), p < .001 Obese (>30) n
= 4,249 (33%) [30.0–62.0]
83.3 (0.6) −12.0 (−13.6, −10.4), p < .001 −5.7 (−7.0, −4.5), p < .001 V
isit 4 BMI (1996–1998)
Normal (<25)
n
= 2,930 (25%) [13.5–24.9]
95.7 (0.6) Reference −3.3 (−6. 3, −0.3), p = .031 Overweight (25–30) n
= 4,572 (40%) [25.0–29.9]
91.6 (0.5) −4.0 (−5.5, −2.5), p < .001 −4.8 (−6.7, −2.9), p < .001 Obese (>30) n
= 4,063 (35%) [30.0–59.2]
85.1 (0.5) −10.6 (−12.2, −9.0), p < .001 −5.6 (−6.7, −4.4), p < .001 V
isit 5 BMI (2011–2013)
Normal (<25)
n
= 1,621 (26%) [13.4–24.9]
98.0 (0.6) Reference 0.7 (−1.6, 3.0), p = .543 Overweight (25–30) n
= 2,449 (39%) [25.0–29.9]
95.3 (0.4) −2.7 (−4.0, −1.4), p < .001 −5.1 (−6.7, −3.5), p < .001 Obese (>30) n
= 2,159 (35%) [30.0–76.1]
88.2 (0.5) −9.8 (−11.2, −8.3), p < .001 −5.7 (−6.6, −4.9), p < .001 Note: BMI =
body mass index; CI
=
confidence interval; SE
=
standard error
. All models were adjusted for age,
sex,
site-race,
education,
diabetes,
systolic and diastolic blood pressure,
antihypertensive medication use,
smoking,
drinking status,
and coronary heart disease.
gait speeds (final BMI = 22.5 vs 27.2: 96.8 vs 94.9 cm/s, p < .0001) (Figure 2A). The difference in gait speed was greater and more clini-cally meaningful comparing a maintained BMI of 22.5 to maintaining a BMI of 27.5 (96.8 vs 92.2 cm/s, p < .0001) (Figure 2B). Maintaining an obese BMI, for example, 32.5 across all Years 0–25 (Figure 2C) was associated with a 10.8-cm/s difference in gait speed (96.8 vs 86.0 cm/s, p < .0001). BMI increases were associated with additive effects on gait speed; maintaining a BMI of 27.5 across all years was associated with a nearly 5-cm/s faster gait speed compared with a mid-life BMI of 27.5 with a 10% increase in Years 0–10 and 10% increase in Years 10–25, that is, a late-life BMI of 33.2 (92.2 vs 87.4 cm/s, p < .0001).
We examined potential lasting effects of mid-life obesity, inde-pendent of subsequent weight loss, using conservative weight loss percentages. Compared with maintaining a BMI of 22.5, a par-ticipant with a mid-life BMI of 27.5 and a 10% decrease during Years 0–10 followed by maintenance (BMI = 24.6) in Years 10–25 had slower gait speeds (96.8 vs 91.2 cm/s, p = .03). A similar pat-tern of greater magnitude was observed for baseline obese partici-pants (BMI = 32.5) who experienced a 10% decrease in BMI in Years 0–10 followed by maintenance of BMI in Years 10–25 (96.8 vs 83.7 cm/s, p < .0001). Comparing maintenance of obese BMI with temporary increases in BMI followed by decreases suggested modest, lasting effects of BMI increases on late-life gait speed; for example, gait speeds were better among those maintaining a BMI of 32.5 compared with those with the same baseline BMI and 10% increases in Years 0–10 then 10% decreases in Years 10–25, despite having the same late-life BMI (86.0 vs 83.3 cm/s, p = .02). Similar effects were seen comparing maintenance of an overweight BMI of
27.5 to a baseline BMI of 27.5 followed by a 10% increase then 10% decrease in BMI (92.2 vs 89.0 cm/s, p = .006).
Small numbers of participants experienced BMI decreases, par-ticularly in Years 0–10, limiting precision of estimates for those with 10% BMI decreases in Years 0–10 (Figure 2 and Supplementary Figure 2). Decreases in late-life BMI (Years 10–25) were more com-mon, but were not generally associated with better gait speed. For example, a 10% BMI decrease in late-life for a participant who maintained a baseline BMI of 27.5 through Years 0–10 was asso-ciated with statistically but not clinically worse gait speed than a participant who maintained a BMI of 27.5 across all years (90.0 vs 92.2 cm/s, p = .002). Interactions between adiposity and race or sex were not strongly supported; there was less support among black men which may have been due to small numbers and lack of power.
Sensitivity analyses excluding underweight participants (BMI < 18.5: Visit 1: n = 141; Visit 2, n = 131; Visit 3, n = 106; Visit 4, n = 90; and Visit 5, n = 70) yielded similar estimates with the same substan-tive interpretation (Supplementary Table 2). Adjudicated stroke data were not available at Visit 1 or 5; sensitivity analyses adjusting for stroke at Visits 2–4 also showed similar or larger effect sizes and did not change the substantive interpretation (Supplementary Table 3).
Discussion
These findings dispute suggestions that being overweight in older age is protective of mobility. In this study, an older adult who maintained a nor-mal BMI from mid-life would have a nearly 5-cm/s faster gait speed than an older adult who maintained an overweight BMI and nearly 11 cm/s Table 3. Gait Speed Estimates for BMI and Difference in Gait Speed by 25-Year Trajectory Groups Compared With the Group that Main-tained Normal BMI
25-Year BMI Trajectory Group Visit 5 Gait Speed Adjusted Differences
Group Baseline BMI 0–10 Years 10–25 Years Estimate 95% CI p Value
1 “Normal” < 25 kg/m2
n = 5,187 (33%)
Loss > 2.5% Loss > 2.5% 90.0 −6.93 −15.49, 1.62 .112
2 Maintain 93.0 −3.89 −14.33, 6.54 .465
3 Gain > 2.5% 94.4 −2.46 −11.19, 6.27 .581
4 Maintain Loss > 2.5% 95.1 −1.82 −7.58, 3.93 .535
5 Maintain 96.9 Reference
6 Gain > 2.5% 95.2 −1.74 −7.55, 4.08 .559
7 Gain > 2.5% Loss > 2.5% 93.5 −3.38 −8.51, 1.76 .197
8 Maintain 94.6 −2.35 −7.52, 2.81 .372
9 Gain > 2.5% 94.1 −2.83 −7.80, 2.13 .263
10 “Overweight” 25–30 kg/m2
n = 6,172 (39%)
Loss > 2.5% Loss > 2.5% 88.4 −8.49 −16.44, −0.53 .037
11 Maintain 92.9 −3.99 −11.31, 3.33 .285
12 Gain > 2.5% 88.2 −8.67 −17.09, −0.26 .043
13 Maintain Loss > 2.5% 89.7 −7.19 −12.93, −1.45 .014
14 Maintain 88.5 −8.44 −14.33, −2.54 .005
15 Gain > 2.5% 89.5 −7.44 −13.06, −1.82 .009
16 Gain > 2.5% Loss > 2.5% 90.6 −6.32 −11.32, −1.32 .013
17 Maintain 89.2 −7.73 −12.79, −2.68 .003
18 Gain > 2.5% 89.2 −7.66 −12.59, −2.73 .002
19 “Obese” ≥ 30 kg/m2
n = 4,336 (28%)
Loss > 2.5% Loss > 2.5% 83.3 −13.62 −21.10, −6.14 <.001
20 Maintain 90.6 −6.32 −14.85, 2.20 .146
21 Gain > 2.5% 80.8 −16.12 −27.92, −4.32 .007
22 Maintain Loss > 2.5% 82.5 −14.43 −20.49, −8.37 <.001
23 Maintain 81.4 −15.53 −22.66, −8.40 <.001
24 Gain > 2.5% 82.6 −14.27 −21.42, −7.12 <.001
25 Gain > 2.5% Loss > 2.5% 81.5 −15.36 −20.68, −10.05 <.001
26 Maintain 83.4 −13.47 −19.08, −7.86 <.001
27 Gain > 2.5% 80.6 −16.26 −21.77, −10.74 <.001
Note: BMI = body mass index; CI = confidence interval. Values in bold represent participants who maintained a BMI within 2.5% of the previous BMI.
faster than an older adult who maintained an obese BMI. The effects of adiposity were clinically meaningful and were greater with higher and longer periods of exposures, and mid-life exposures appeared to have lasting adverse effects on mobility that were exacerbated by weight gain.
Weight loss, low adiposity, and even normal adiposity are cited risk factors for poor functional status and mortality in older adults (17), contributing to speculation that overweight is protective in older age (17,27). Although the current findings did not support associations of weight loss in late-life with better mobility, weight loss in observational studies combines effects of intentional and unintentional weight loss (28) despite the two having differential associations with mortality (29). Unintentional weight loss can occur due to underlying disease such as cancer, heart and lung disease, and dementia which are associated with poor functional outcomes and mortality (30,31). Intentional weight loss through lifestyle interven-tions in older adults leads to better physical function measures (32). Our finding of statistically different and slower gait speeds associ-ated with late-life BMI decreases is not clinically meaningful and likely represents the aggregate of negative effects of unintentional with beneficial effects of intentional weight loss.
Our findings expand upon studies that relied on recall of mid-life weights (12–16,33) by using repeated anthropometric measurements across 25 years, reflecting the mid- to late-life transition, as well as objective mobility measures that many prior studies lacked. Objective measures improve obesity and physical function classification due to underreporting of weight, overreporting height (34), and overestimation of function (35). Our findings align with two studies that incorporated historical adiposity measures; one reported a deleterious relationship of measured mid-life adiposity and late-life physical function (16) and the other reported that sustained overweight at two time points 36 years apart in men was associated with risk for disability (36). Men who
maintained normal weight or gained weight had similar disability, frailty, and mortality outcomes. Together these and our study support a need for early, ongoing weight management to help preserve late-life function.
Self-reported weight loss from mid-life to older age among persons of normal weight in mid-life has been associated with increased risk for disability in late-life, although not after accounting for comorbidities (8). Weight loss in a prior ARIC study using self-recalled weights was also not associated with self-reported mid-life functional status (13). In the National Health and Nutrition Examination Survey, mid-life BMI more than 27 was associated with self-reported mobility disabil-ity in white women, but weight loss was only associated with mobildisabil-ity disability among the oldest (mean age 80 years) (9). Inconsistencies of our findings with prior studies could be explained by the younger age of the ARIC cohort in the earlier study and more sensitive measures of weight and mobility in the current study (3,34,35).
Proposed mechanisms whereby adiposity could affect mobility include mechanical effects on joints, intermuscular fatty infiltra-tion (24), weakness (21), and associated conditions such as diabetes (37). Excess adipose also results in dysregulated adipocytes, meta-bolic derangements, and inflammation that could affect nerves and muscles (38). By contributing to diabetes and hypertension, obesity could lead to ischemic brain changes that impair central control of mobility. However, our findings were robust to adjustments for dia-betes and other comorbidities and when participants with a cancer diagnosis at Visit 5 were excluded.
Some limitations include a lack of information on arthritis, a probable mediator in the obesity–mobility relationship. Mediators should attenuate relationships but would not diminish the impor-tance of our findings. Unintentional weight loss history was not available. However, weight loss in a large observational study of older adults was most often unintentional (28), which is associated with risk for adverse outcomes and likely negates beneficial influ-ences of intentional weight loss on mobility. Muscle strength could negate effects of adiposity (21), and higher than expected muscle mass could misclassify obesity using BMI. We conducted additional analyses that adjusted for grip strength, which was only available at Visit 5, with similar results. Lastly, a single mobility assessment has been conducted in ARIC, limiting analyses to persons who returned for the exam. Those who did not return had higher baseline BMI, so current findings likely underestimate relationships.
Maintaining a normal BMI from mid- to late-life is associated with better mobility in older age, challenging the view that being overweight in old age has protective influences on mobility. Our findings make clear that assessment of adiposity risk in older age should incorporate prior weight histories and that prevention of mobility impairments in older adults may be most effective if imple-mented and maintained in mid-life, and perhaps earlier.
Supplementary Material
Supplementary data are available at The Journals of Gerontology, Series A: Biological Sciences and Medical Sciences online.
Funding
The Atherosclerosis Risk in Communities Study is carried out as a collaborative study supported by the National Heart, Lung, and Blood Institute contracts (HHSN268201100005C, HSN268201100006C, HHSN268201100007C, HHSN268201100008C, HHSN268201100009C, HHSN268201100010C, HHSN268201100011C, and HHSN268201100012C).
Figure 2. Model estimates of Visit 5 gait speeds (y-axis) for participants with different baseline body mass index (BMI) values, by BMI changes in Years 0–10 and BMI changes in Years 10–25. Years 10–25 BMI changes (%) are shown on the x-axis. Colored lines represent BMI changes (%) in Years 0–10: 10% decrease (black line (blue line online)), 0% change (gray line (green line online)), 10% increase (light gray line (orange line online)), and 15% increase (red line). (A) Baseline BMI = 22.5 kg/m2, (B) Baseline BMI = 27.5 kg/
m2, (C) Baseline BMI = 32.5 kg/m2, and (D) Baseline BMI = 37.5 kg/m2.
Acknowledgment
The authors thank the staff and participants of the ARIC study for their important contributions.
References
1. Cummings SR, Studenski S, Ferrucci L. A diagnosis of dismobility-giving mobility clinical visibility: a mobility working group recommendation. JAMA. 2014;311:2061–2062. doi:10.1001/jama.2014.3033
2. Guralnik JM, Ferrucci L, Simonsick EM, Salive ME, Wallace RB. Lower-extremity function in persons over the age of 70 years as a predictor of subsequent disability. N Engl J Med. 1995;332:556–562.
3. Guralnik JM, Simonsick EM, Ferrucci L, et al. A short physical perfor-mance battery assessing lower extremity function: association with self-reported disability and prediction of mortality and nursing home admis-sion. J Gerontol. 1994;49:M85–M94.
4. Kehusmaa S, Autti-Ramo I, Helenius H, Hinkka K, Valaste M, Rissanen P. Factors associated with the utilization and costs of health and social services in frail elderly patients. BMC Health Serv Res. 2012;12:204. doi:10.1186/1472-6963-12-204
5. Studenski S, Perera S, Patel K, et al. Gait speed and survival in older adults. JAMA. 2011;305:50–58. doi:10.1001/jama.2010.1923
6. Alley DE, Chang VW. The changing relationship of obesity and disability, 1988-2004. JAMA. 2007;298:2020–2027. doi:10.1001/jama.298.17.2020 7. Bannerman E, Miller MD, Daniels LA, et al. Anthropometric indices
predict physical function and mobility in older Australians: the Austral-ian Longitudinal Study of Ageing. Public Health Nutr. 2002;5:655–662. doi:10.1079/PHN2002336
8. Busetto L, Romanato G, Zambon S, et al. The effects of weight changes after middle age on the rate of disability in an elderly population sam-ple. J Am Geriatr Soc. 2009;57:1015–1021. doi:10.1111/j.1532-5415.2009.02273.x
9. Launer LJ, Harris T, Rumpel C, Madans J. Body mass index, weight change, and risk of mobility disability in middle-aged and older women. The epi-demiologic follow-up study of NHANES I. JAMA. 1994;271:1093–1098. 10. Ritchie CS, Locher JL, Roth DL, McVie T, Sawyer P, Allman R. Uninten-tional weight loss predicts decline in activities of daily living function and life-space mobility over 4 years among community-dwelling older adults. J Gerontol A Biol Sci Med Sci. 2008;63:67–75.
11. Angleman SB, Harris TB, Melzer D. The role of waist circumference in predicting disability in periretirement age adults. Int J Obes (Lond). 2006;30:364–373. doi:10.1038/sj.ijo.0803130
12. Houston DK, Ding J, Nicklas BJ, et al. Overweight and obesity over the adult life course and incident mobility limitation in older adults: the health, aging and body composition study. Am J Epidemiol. 2009;169:927–936. doi:10.1093/aje/kwp007
13. Houston DK, Stevens J, Cai J, Morey MC. Role of weight history on func-tional limitations and disability in late adulthood: the ARIC study. Obes Res. 2005;13:1793–1802. doi:10.1038/oby.2005.218
14. Peterson MD, Al Snih S, Stoddard J, Shekar A, Hurvitz EA. Obesity mis-classification and the metabolic syndrome in adults with functional mobil-ity impairments: Nutrition Examination Survey 2003-2006. Prev Med. 2014;60:71–76. doi:10.1016/j.ypmed.2013.12.014
15. Stenholm S, Rantanen T, Alanen E, Reunanen A, Sainio P, Koskinen S. Obesity history as a predictor of walking limitation at old age. Obesity (Silver Spring). 2007;15:929–938. doi:10.1038/oby.2007.583
16. Stenholm S, Sainio P, Rantanen T, et al. High body mass index and physi-cal impairments as predictors of walking limitation 22 years later in adult Finns. J Gerontol A Biol Sci Med Sci. 2007;62:859–865.
17. Marsh AP, Rejeski WJ, Espeland MA, et al. Muscle strength and BMI as predictors of major mobility disability in the Lifestyle Interventions and Independence for Elders pilot (LIFE-P). J Gerontol A Biol Sci Med Sci. 2011;66:1376–1383. doi:10.1093/gerona/glr158
18. Mendes de Leon CF, Barnes LL, Bienias JL, Skarupski KA, Evans DA. Racial disparities in disability: recent evidence from self-reported and
per-formance-based disability measures in a population-based study of older adults. J Gerontol B Psychol Sci Soc Sci. 2005;60:S263–S271.
19. Xu B, Houston DK, Gropper SS, Zizza CA. Race/Ethnicity differences in the relationship between obesity and gait speed among older Americans. J Nutr Elder. 2009;28:372–385. doi:10.1080/01639360903393515 20. Miller DK, Wolinsky FD, Andresen EM, Malmstrom TK, Miller JP.
Adverse outcomes and correlates of change in the Short Physical Perfor-mance Battery over 36 months in the African American health project. J Gerontol A Biol Sci Med Sci. 2008;63:487–494.
21. Stenholm S, Alley D, Bandinelli S, et al. The effect of obesity combined with low muscle strength on decline in mobility in older persons: results from the InCHIANTI study. Int J Obes (Lond). 2009;33:635–644. doi:10.1038/ ijo.2009.62
22. Fritz S, Lusardi M. White paper: “walking speed: the sixth vital sign”. J Geriatr Phys Ther. 2009;32:46–49.
23. Perera S, Mody SH, Woodman RC, Studenski SA. Meaningful change and responsiveness in common physical performance measures in older adults. J Am Geriatr Soc. 2006;54:743–749. doi:10.1111/j.1532-5415.2006.00701.x
24. Beavers KM, Beavers DP, Houston DK, et al. Associations between body composition and gait-speed decline: results from the Health, Aging, and Body Composition study. Am J Clin Nutr. 2013;97:552–560. doi:10.3945/ ajcn.112.047860
25. Wallace JI, Schwartz RS. Epidemiology of weight loss in humans with spe-cial reference to wasting in the elderly. Int J Cardiol. 2002;85:15–21. 26. Stevens J, Truesdale KP, McClain JE, Cai J. The definition of weight
main-tenance. Int J Obes (Lond). 2006;30:391–399. doi:10.1038/sj.ijo.0803175 27. Decaria JE, Sharp C, Petrella RJ. Scoping review report: obesity in older
adults. Int J Obes (Lond). 2012;36:1141–1150. doi:10.1038/ijo.2012.29 28. Lee JS, Kritchevsky SB, Harris TB, Tylavsky F, Rubin SM, Newman AB.
Short-term weight changes in community-dwelling older adults: the Health, Aging, and Body Composition Weight Change Substudy. Am J Clin Nutr. 2005;82:644–650.
29. Meltzer AA, Everhart JE. Unintentional weight loss in the United States. Am J Epidemiol. 1995;142:1039–1046.
30. Cheng Y, Borrego ME, Frost FJ, Petersen H, Raisch DW. Predictors for mortality in hospitalized patients with chronic obstructive pulmonary dis-ease. SpringerPlus. 2014;3:359. doi:10.1186/2193-1801-3-359 31. Metalidis C, Knockaert DC, Bobbaers H, Vanderschueren S.
Involun-tary weight loss. Does a negative baseline evaluation provide adequate reassurance? Eur J Intern Med. 2008;19:345–349. doi:10.1016/j. ejim.2007.09.019
32. Anton SD, Manini TM, Milsom VA, et al. Effects of a weight loss plus exercise program on physical function in overweight, older women: a ran-domized controlled trial. Clin Interv Aging. 2011;6:141–149. doi:10.2147/ CIA.S17001
33. Beavers KM, Hsu FC, Houston DK, et al. The role of metabolic syndrome, adiposity, and inflammation in physical performance in the Health ABC Study. J Gerontol A Biol Sci Med Sci. 2013;68:617–623. doi:10.1093/ gerona/gls213
34. Merrill RM, Richardson JS. Validity of self-reported height, weight, and body mass index: findings from the National Health and Nutrition Exami-nation Survey, 2001-2006. Prev Chronic Dis. 2009;6:A121.
35. Simonsick EM, Newman AB, Visser M, et al. Mobility limitation in self-described well-functioning older adults: importance of endurance walk testing. J Gerontol A Biol Sci Med Sci. 2008;63:841–847.
36. Strandberg TE, Stenholm S, Strandberg AY, Salomaa VV, Pitkälä KH, Tilvis RS. The “obesity paradox,” frailty, disability, and mortality in older men: a prospective, longitudinal cohort study. Am J Epidemiol. 2013;178:1452–1460. doi:10.1093/aje/kwt157
37. Pinsky JL, Branch LG, Jette AM, et al. Framingham Disability Study: rela-tionship of disability to cardiovascular risk factors among persons free of diagnosed cardiovascular disease. Am J Epidemiol. 1985;122:644–656. 38. Greenberg AS, Obin MS. Obesity and the role of adipose tissue in
inflam-mation and metabolism. Am J Clin Nutr. 2006;83:S461–S465.
![Table 2. Adjusted Cross-temporal Relationships of Body Mass Index at Each Visit with Visit 5 Gait Speed Gait Speed (cm/s) at Visit 5 (2011–2013) BMI (kg/m2) N (%) [Range]](https://thumb-us.123doks.com/thumbv2/123dok_us/8248751.2185730/4.892.276.600.149.1089/table-adjusted-temporal-relationships-visit-speed-visit-range.webp)