The effect of noise fluctuation and spectral bandwidth
on gap detection
Joseph W.Hall III,1,a)EmilyBuss,1Erol J.Ozmeral,2and John H.Grose1
1
Department of Otolaryngology—Head & Neck Surgery, University of North Carolina at Chapel Hill, 170 Manning Drive, Chapel Hill, North Carolina 27599-7070, USA
2
Department of Communication Sciences and Disorders, University of South Florida, Tampa, Florida 33620, USA
(Received 25 August 2015; revised 10 March 2016; accepted 18 March 2016; published online 5 April 2016)
Experiment 1 investigated gap detection for random and low-fluctuation noise (LFN) markers as a function of bandwidth (25–1600 Hz), level [40 or 75 dB sound pressure level (SPL)], and center fre-quency (500–4000 Hz). Gap thresholds for random noise improved as bandwidth increased from 25 to 1600 Hz, but there were only minor effects related to center frequency and level. For narrow bandwidths, thresholds were lower for LFN than random markers; this difference extended to higher bandwidths at the higher center frequencies and was particularly large at high stimulus level. Effects of frequency and level were broadly consistent with the idea that peripheral filtering can increase fluctuation in the encoded LFN stimulus. Experiment 2 tested gap detection for 200-Hz-wide noise bands centered on 2000 Hz, using high-pass maskers to examine spread of excitation effects. Such effects were absent or minor for random noise markers and the 40-dB-SPL LFN markers. In contrast, some high-pass maskers substantially worsened performance for the 75-dB-SPL LFN markers. These results were consistent with an interpretation that relatively acute gap detection for the high-level LFN gap markers resulted from spread of excitation to higher-frequency auditory filters where the magnitude and phase characteristics of the LFN stimuli are better preserved.VC 2016 Acoustical Society of America. [http://dx.doi.org/10.1121/1.4945095]
[FJG] Pages: 1601–1610
I. INTRODUCTION
This study investigated gap detection for noise markers as a function of the noise bandwidth in normal-hearing adults. Both random noise and low-fluctuation noise (LFN) were examined; previous studies with narrowband stimuli indicate that gaps are easier to detect in LFN than random noise (Glasberg and Moore, 1992). The question of main in-terest was the role of peripheral auditory filters in the pattern of results as the noise bandwidth was increased. Gap detec-tion for random noise markers improves as noise bandwidth increases up to and beyond a critical band (Shailer and Moore, 1985; Groseet al., 1989;Eddinset al., 1992; Snell
et al., 1994). However, it is unclear how gap detection for LFN is affected by bandwidth. One general prediction is that the advantage of LFN over random noise should drop as the bandwidth increases up to and beyond a critical band. This prediction is based on the observation that the relatively flat envelope of LFN noise depends crucially on the relative magnitudes and phases of the component tones, features that will be increasingly altered in their internal representation as the bandwidth of the stimulus widens relative to a critical band.
One factor that could limit gap detection for both ran-dom noise and LFN bands is the maximum fluctuation rate that can be carried at a given noise bandwidth. For very nar-row bandwidths, the upper limit of fluctuation rate is low
(Rice, 1954), and therefore the duration of an externally imposed gap that does not result in a spectral cue is rela-tively long. Another factor limiting gap detection, particu-larly in random noise, is that the ongoing noise fluctuations could be confused with an externally imposed gap, blunting an observer’s gap detection sensitivity (e.g., Shailer and Moore, 1983;Green, 1985;Shailer and Moore, 1985;Eddins and Green, 1995). Mooreet al. (Shailer and Moore, 1985; Moore, 2012) suggested that this confusion effect is most problematic for narrow random noise bandwidths, for which the fluctuations are slow and perceptually salient. These fac-tors pertain to improving performance with increasing band-width withinan auditory filter, but the increase in envelope fluctuation rate with increasing noise bandwidth is limited by the frequency resolution of the auditory system; increas-ing bandwidth beyond an auditory filter introduces more channels of information, but does not change the effective modulation in the channel at the center frequency of the noise band.
If the effective envelope fluctuation were the dominant factor in gap detection performance, it might be expected that the beneficial effects of increasing noise bandwidth would be greater as the center frequency of the noise mark-ing the gap is increased, in line with the increase in the audi-tory filter bandwidth as frequency increases (Fletcher, 1940; Patterson and Moore, 1986). However, previous gap detec-tion results with random noise have not met this expectadetec-tion. A study byEddinset al.(1992)indicated that when the abso-lute noise bandwidth was varied, the improvement in gap a)
detection with increasing bandwidth was similar across dif-ferent frequency regions, with no obvious impact related to the difference in frequency selectivity across frequency. An electrophysiological study using electrodes sited in the infe-rior colliculus and auditory cortex of the guinea pig (Wang
et al., 2006) was also consistent with similar sensitivity to gaps in different frequency regions when the noise band-width was similar. A parallel finding has been reported for the detection of sinusoidal amplitude modulation of a noise band carrier of variable bandwidth (Eddins, 1999). Snell
et al.(1994)noted that more complex gap detection data pat-terns can occur. In their study, they varied both the upper cutoff frequency and the absolute bandwidth of noise gap markers. Although they found that the gap detection thresh-old generally decreased as the noise bandwidth increased, they also found that when the noise bandwidth was at least one-half the upper cutoff frequency of the noise band, “then upper cutoff frequency and not bandwidth determined gap sensitivity.” Nevertheless, looking across studies, there is lit-tle or no stimulus center frequency effect over a large range of bandwidths when gap detection is compared across equal noise marker bandwidths. One interpretation of such result is that the beneficial effects due to increased noise bandwidth within an auditory filter are similar in magnitude to effects due to integrating information across multiple auditory filters.
Although previous studies have not measured gap detection as a function of the bandwidth of LFN, studies using a narrowband (25-Hz-wide) LFN stimulus reported gap detection thresholds that were substantially lower than for random noise (Grose et al., 2008; Buss et al., 2014). This result is in accord with other studies indicating that gap detection performance is limited by inherent fluctua-tions of the noise, and is also consistent with the concept of modulation masking (e.g.,Houtgast, 1989;Glasberg and Moore, 1992; Moore et al., 1993). Bandwidth effects for LFN were investigated by Hartmann and Pumplin (1988) in an experiment measuring 1000-Hz pure-tone signal detection in a noise band centered on 1000 Hz. When the noise bandwidth was 100 Hz, less than the equivalent rec-tangular bandwidth (ERB) of the auditory filter at 1000 Hz (approximately 133 Hz; Glasberg and Moore, 1990), Hartmann and Pumplin found that detection thresholds were lower in LFN than in random noise. This finding was consistent with the idea that pure-tone-detection in noise is impeded by the power fluctuations associated with a ran-dom, narrowband noise masker (Bos and de Boer, 1966). However, when the bandwidth of the LFN noise masker was 300 Hz (wider than the ERB at 1000 Hz), the LFN was no longer associated with a detection advantage. Hartmann and Pumplin reasoned that although the 300-Hz-wide LFN had low fluctuation at the input to the auditory filter cen-tered on the signal frequency, the filtering process intro-duced fluctuations at the filter output. Kohlrausch et al.
(1997) also reported pure-tone masking results that were consistent with this interpretation. The present study inves-tigated whether a related bandwidth effect occurs in gap detection.
We evaluated gap detection for noise marker band-widths from 25 Hz to as high as 1600 Hz, and center frequen-cies at octave intervals from 500 to 4000 Hz. Thus one way that the auditory filter width varied in this study was via center frequency, with auditory filter width increasing with center frequency (Fletcher, 1940). For random noise, the ex-pectation was for gap detection to improve with increasing marker bandwidth, with little or no effect associated with center frequency, as observed previously. For LFN gap detection, thresholds were expected to be lower than for random noise thresholds at relatively narrow bandwidths, but to become more similar to random noise thresholds when the marker bandwidth exceeded the auditory filter width. Because the auditory filter width increases with increasing center frequency, the LFN gap thresholds were expected to remain lower than the random noise thresholds at wider bandwidths as center frequency increased. We also presented stimuli at two different levels [40 and 75 dB sound pressure level (SPL)] so that we would be able to observe possible effects related to the broadening of peripheral filters at higher stimulus levels (e.g.,Weber, 1977).
Besides level and center frequency, another factor that could relate to the role of the auditory filter in gap detection for LFN is the auditory filter phase curvature (e.g., Kohlrausch and Sander, 1995; Ruggeroet al., 1997; Carney et al., 1999; Lentz and Leek, 2001; Oxenham and Dau, 2001). Phase curvature is relevant for LFN gap detec-tion because the low-fluctuadetec-tion nature of the envelope depends upon the phase relation among the constituent components (Hartmann and Pumplin, 1988). The possible role of phase curvature in the LFN results of this study is considered in Sec.IV.
II. EXPERIMENT 1: EFFECTS OF CENTER FREQUENCY, BANDWIDTH, AND MARKER TYPE
A. Methods
1. Observers
The observers were four normal-hearing adults, with pure-tone detection thresholds of 20 dB hearing level or less at octave frequencies 250–8000 Hz (ANSI S3.6-2010, 2010). Although the inclusion of only four observers can be seen as a limitation of this study, a strength is that the observers tested here all had extensive previous psycho-acoustic listening experience (>100 h), including gap detection for bandpass noise. Observers ranged in age from 34 to 57 yrs.
2. Stimuli
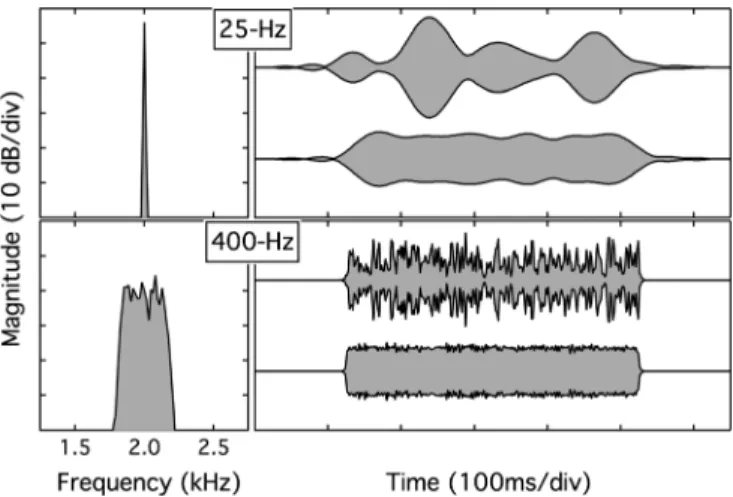
random noise condition, a sample of LFN was first generated as just described. This LFN was then transformed into the frequency domain, the component phases were randomized (0–2p radians), and the result was transformed back into the time domain. This procedure ensured that the low-fluctuation and random noise bands had the same average long-term magnitude spectra. For the FIR filters, the number of taps was adjusted according to bandwidth, such that the passband was five times the frequency span associated with one bin, i.e., the frequency resolution of the filter was a con-stant proportion of the bandwidth. As a consequence, the spectral shape was proportionally consistent across band-widths. This is illustrated in the left panels of Fig. 1, which show the magnitude spectra for exemplars with bandwidths of 25 and 400 Hz. The right panel shows the associated time waveforms, both low-fluctuation and random.
Stimulus gating was accomplished by passing stimuli with abrupt transitions through the FIR filter used to generate the stimulus band. This filtering smoothed the temporal en-velope proportionally to the filter bandwidth, such that gat-ing was more gradual for narrower bandwidths. Examples of this can be seen in the onsets and offsets of the markers shown in the right panels of Fig. 1. The onset/offset ramps bounding the gaps shared this temporal characteristic. Each stimulus was 400 ms in duration, measured from the half-rise point of the onset and offset ramps. The gap, when present, began between 100 and 150 ms after stimulus onset, deter-mined based upon draws from a uniform distribution. Stimuli were presented at either 40 or 75 dB SPL.
Because the gap ramps became steeper as the marker bandwidth increased, one factor that could affect gap detec-tion across the bandwidth condidetec-tions was the duradetec-tion of ramps at the beginning and end of the gap. In order to deter-mine the limits that rise/fall might impose on the LFN gap detection thresholds of this experiment, control conditions were run in which the gap marker was a pure tone positioned at the center frequency of each of the four frequency regions examined. For each frequency region, the tonal marker was passed through one of the seven FIR filters (25 to 1600 Hz
bandwidths) used in the main conditions, which had the effect of smoothing abrupt stimulus onsets and offsets, as well as transitions into and out of the gap. The duration of the tonal stimuli and the timing of the gap placement were the same as in the main conditions, and the level was 75 dB SPL.
3. Procedures
Stimuli were generated in MATLAB (Mathworks, Inc.,
Natick, MA), with novel random noise draws on each listen-ing interval. These arrays were played out of a real-time processor at 12 207 Hz and presented over a single insert ear-phone to the observer’s left ear (ER-2, Etymotic, Elk Grove Village, IL). There were three 400-ms intervals in each trial, separated by a 450-ms inter-stimulus interval. One of these intervals, selected at random, contained a gap. The three intervals were marked visually with lights on a hand-held response box. These lights also provided feedback after each observer response, indicating the interval containing the gap. Thresholds were measured using a 3-down, 1-up track-ing procedure, which estimates the gap duration that is de-tectable on 79% of trials. Adjustments in gap duration were made using a factor of 1.41 at the outset of each track, and this was reduced to 1.19 after the second track reversal. A track continued until eight reversals had been obtained. The threshold associated with each track was the geometric mean of the gap durations at the last six reversals.
Thresholds were blocked by condition. Observers com-pleted data collection at one frequency before moving on to the next frequency, and the order in which observers heard each of the four frequencies was randomized across observ-ers. Within a frequency, the order of conditions (bandwidths, levels, and noise type) was randomized. All data with the noise markers were collected prior to those for the tone markers. All observers provided at least three replicate thresholds per condition. At the end of the experiment the data were examined for consistency. Additional blocks of data were collected in cases of excessive variability, com-prising approximately 5% of the data. Excessive variability was defined as replicate thresholds within an observer and stimulus condition differing by a factor of 2 or more, or thresholds across observers in a condition differing by a fac-tor of 4 or more. In most cases the outlier gap detection thresholds were relatively high and were the earliest data points collected, consistent with practice effects.
B. Results and discussion
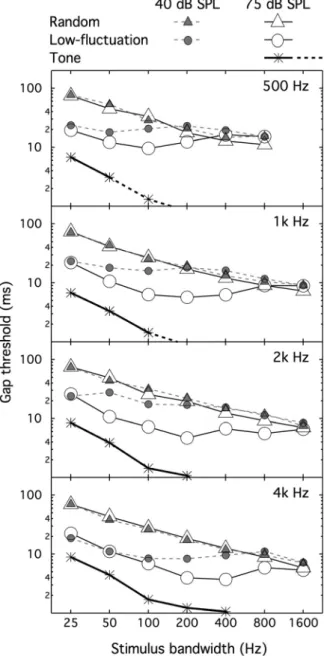
The data functions of the individual observers were sim-ilar in form, so the mean data for all conditions are shown in Fig. 2, one panel for each frequency region. Gap detection thresholds are plotted as a function of stimulus bandwidth. Triangles represent random noise data, and circles represent LFN data. The open, larger symbols represent conditions where the level was 75 dB SPL, and the filled, smaller sym-bols represent conditions where the level was 40 dB SPL. The asterisks connected by solid and dashed lines represent data for the pure-tone stimuli.
In order to avoid clutter, the inter-observer variability is not shown in Fig. 2. Variability was characterized in terms FIG. 1. Example stimuli from experiment 1, with no gap. The left column of
of the max/min ratio of gap detection thresholds across observers in the individual conditions. For random noise, the max/min ratios were similar across the two levels and noise marker bandwidths, with most values falling between 1.2 and 1.5. The max/min ratios were more variable and tended to be higher for the LFN. At the 40 dB SPL level, most val-ues for the LFN fell between 1.2 and 2.0. At the 75 dB SPL level, most values for the LFN fell between 1.2 and 2.5. For LFN, the largest max/min ratios usually occurred for bandwidths of 50–200 Hz at 40-dB SPL, and 200–800 Hz at 75-dB SPL.
1. Random noise
A general feature of the random noise gap detection thresholds was a steady improvement in performance as the
noise bandwidth increased, a pattern found at each of the four frequency regions. Another general feature was that data were similar across the two stimulus levels (the open and closed triangles were relatively close together). To explore the random noise results in detail, a repeated meas-ures analyses of variance (rmANOVA) was performed. An alevel of 0.05 was adopted for significance, and all analyses were performed on log-transformed gap thresholds. Recall that the data for the 500-Hz region were obtained only up to the 800-Hz bandwidth, so the 1600-Hz bandwidth was excluded from this analysis. There were 4 frequency regions (500 to 4000 Hz), 6 bandwidths (25 to 800 Hz), and 2 stimu-lus levels (40 and 75 dB SPL). This analysis showed signifi-cant effects of bandwidth (F5,15¼1379.12; p<0.001; g2
G ¼0.97) and frequency region (F3,9¼6.08; p¼0.015; g2
G ¼0.19). The effect of bandwidth can be seen clearly in Fig. 2, with gap threshold decreasing monotonically with increasing bandwidth. The effect of frequency is less obvious and was non-monotonic, with estimated marginal means of 27.1, 23.8, 25.8, and 23.3 ms for 500, 1000, 2000, and 4000 Hz, respectively. Frequency pairwise comparisons with Bonferroni adjustment indicated no significant differen-ces between any of the frequencies. Thus, overall, the fre-quency effect did not show consistent support for an auditory filter mechanism, wherein monotonic improvement with increases in frequency region would be expected. The only significant interaction was between level and bandwidth (F5,15¼6.10;p¼0.003;g2
G¼0.085). Simple effects testing
(Kirk, 1968) indicated that this interaction was due to lower gap thresholds at the higher level at two of the six band-widths: 200 Hz (p¼0.007) and 800 Hz (p¼0.048). The av-erage gap thresholds at the two levels differed by a factor of 1.08 at the 200-Hz bandwidth and by a factor of 1.22 at the 800-Hz bandwidth. The trend for lower gap detection thresh-olds at the higher level is generally consistent with the idea that increased level is associated with a broader auditory filter.
2. LFN
The bandwidth functions for the LFN were plainly differ-ent from one another at the differdiffer-ent frequency regions and stimulus presentation levels (see Fig.2). An rmANOVA was performed on the LFN data across the 4 frequency regions (500 to 4000 Hz), 6 bandwidths (25 to 800 Hz), and the 2 stim-ulus levels (40 and 75 dB SPL). This analysis showed signifi-cant effects of frequency region (F3,9¼28.75;p<0.001;g2
G ¼0.91), level (F1,3¼30.73;p¼0.012;g2
G¼0.91), and
band-width (F5,15¼99.94; p<0.001; g2
G¼0.97). Furthermore,
all of the interactions were significant: frequency region
level (F3,9¼5.01;p¼0.026;g2
G¼0.62); frequency region bandwidth (F15,45¼11.18; p<0.001; g2
G¼0.78), level bandwidth (F5,15¼33.44; p<0.001; g2
G¼0.92), and
fre-quency regionlevelbandwidth (F15,45¼4.74;p<0.001; g2
G¼0.61). Because of the significant three-way interaction,
all significant main effects and the other interactions should be interpreted with caution.
The three-way interaction can be interpreted through visual inspection of the data patterns apparent in Fig. 2. As FIG. 2. Group data are plotted as a function of stimulus bandwidth, shown
can be seen at the left of each panel, the LFN results at the two stimulus levels overlapped at the 25-Hz bandwidth. The functions associated with the 40 - and 75-dB-SPL pre-sentation levels diverged at intermediate bandwidths and then converged again at higher bandwidths. The particular bandwidths associated with this divergence and subsequent convergence depended on stimulus frequency region. This non-monotonic effect of bandwidth was more apparent for the 75-dB-SPL presentation level.
At the 40-dB level (small filled circles), the functions were relatively flat as bandwidth increased at the lower fre-quency regions, before turning down in a way that then fol-lowed the functions for the random noise conditions; at the highest frequency region, the function fell slightly with increasing bandwidth up to about the 100-Hz bandwidth before flattening out, and did not approach the random noise function until a bandwidth of 400 Hz. At the 75-dB-SPL level (large, open circles), the bandwidth corresponding to best performance increased as a function of increasing fre-quency, from 100 Hz at the 500-Hz center frequency to 400 Hz at the 4000-Hz center frequency.
3. Pure-tone stimuli
Recall that gap detection thresholds for pure-tone stim-uli were obtained to help determine whether gap detection thresholds for the noise markers were limited by the rise/fall ramps imposed by digital filtering (see Fig. 1). The pure-tone results are shown in Fig.2as asterisks connected with a thick line. This line becomes dashed at bandwidths more than 10% of the center frequency to denote the possibility that a spectral splatter cue may play a role in performance; the assumption of no spectral cue for bandwidths at and below 10% of the center frequency is bolstered by the obser-vation that gap threshold functions for the tones are parallel across frequency for that subset of data. The pure-tone markers were associated with lower gap detection thresholds than those for the random and LFN noise markers. This is consistent with an interpretation that gap detection perform-ance for the noise markers was not limited by the stimulus rise/fall times, even for the LFN stimuli. It is possible that the primary limitation on gap detection performance for the noise markers was the ongoing fluctuation in the stimuli. As can be seen in Fig. 1, even the LFN stimulus is not com-pletely free of envelope fluctuation.
4. Differences between random noise and LFN functions and their implications
The present results for the random noise stimuli are gen-erally consistent with previous data for similar center fre-quencies and noise bandwidths; that is, gap detection improved with increasing stimulus bandwidth in a way that was grossly similar across a range of center frequencies. Although there was a significant main effect of frequency region, the tendency for lower gap thresholds at higher marker frequencies was not monotonic, and frequency dif-ferences were not significant after Bonferroni adjustment. Thus, the present random noise data do not provide consist-ent support for an auditory filter bandwidth effect related to
stimulus frequency. These data also failed to provide support for a main effect of presentation level. However, there was a significant interaction between level and bandwidth, due to lower gap thresholds at the higher level at the 200 and 800 Hz bandwidths, and this might be interpreted as provid-ing some support for an auditory filter effect for the random noise data. This possibility is undermined, however, by the fact that the associated effect sizes are small, and an effect of auditory filter width would not be restricted to 200 and 800 Hz bandwidths.
The main purpose of the present study was to determine whether relatively large effects related to peripheral filtering would be evident in the results of gap detection conditions using LFN. There were indeed LFN gap detection results that were qualitatively consistent with peripheral filtering effects. First, as the bandwidth of the LFN widened, the advantage over random noise disappeared at some point (see Fig. 2). This is consistent with the idea that peripheral filtering introduced fluctuations that limited gap detection performance once the noise bandwidth exceeded some value. Furthermore, specific effects of frequency region and presen-tation level were broadly consistent with an association between auditory filter width and the ability to benefit from LFN. For example, there was a trend for the low fluctuation and random noise functions to converge at a broader band-width with increasing frequency region. At the 40-dB level, the LFN function converged with the random noise function between 100 and 200 Hz for the 500-Hz frequency region, but not until 400–800 Hz for the 4000-Hz frequency region. At the 75-dB level, the LFN function converged with the random noise function between 200 and 400 Hz for the 500-Hz frequency region, but not until the widest bandwidth of 1600 Hz at the 4000-Hz frequency region. In general, there was a trend for the low-fluctuation advantage to persist out to wider bandwidths for the 75-dB level than for the 40- dB level (see Fig. 2). This result is consistent with the higher stimulus level being associated with a wider auditory filter.
in level of the LFN stimulus invites consideration of possi-bilities other than changes in auditory filter width for the level effect apparent in the data. Because increased spread of excitation is an obvious consequence of increasing the gap marker level, the second experiment focused on the possible role of upward spread of excitation on the relatively good performance observed for LFN at the 75-dB-SPL level.
III. EXPERIMENT 2: EFFECT OF SPREAD OF EXCITATION IN THE LFN BENEFIT
This experiment examined the possibility that spread of excitation might support better gap detection for LFN but not for random noise. We explored this possibility by placing a 1000-Hz wide, 75-dB-SPL band of masking noise at a fre-quency above the gap marker, and parametrically varying the frequency separation between the gap marker and this high-frequency masking band. If cues related to spread of excitation contributed strongly to the results, the expectation was that performance with the masking band present would result in higher gap detection thresholds than obtained with-out the masking band. The change in performance as the sep-aration between the gap marker and masking band increased would provide an indication of the frequency region over which spread of excitation cues contributed to gap detection performance. We took measurements for a gap marker band-width of 200 Hz centered at 2000 Hz, a stimulus for which the observed level effect was robust. In Sec. IV, below, we consider two possible qualitative mechanisms whereby spread of excitation could have a beneficial effect on gap detection for high-level LFN gap markers: multiple looks across a wide frequency range, and better representation of the low-fluctuation stimulus at the outputs of auditory filters above the center frequency of the stimulus. A reviewer of a previous version of this manuscript pointed out that another way that the high-frequency noise band might affect gap detection performance is via downward spread of masking, such that the high-frequency masker interferes with on-frequency processing of the gap stimulus. We therefore included further conditions that addressed this possibility.
A. Methods
1. Observers
The observers were the same four normal-hearing adults who participated in experiment 1.
2. Stimuli and procedures
The methods of stimulus generation, presentation, and threshold estimating procedure were the same as used in experiment 1. The gap marker was a 200-Hz wide band of noise centered on 2000. This stimulus was either random noise or LFN, presented at either 40 or 75 dB SPL. The high-frequency masker was a 1000-Hz wide band of noise that was presented continuously at 75 dB SPL. The spectral posi-tion of the masker was varied parametrically, with the lower edge of the masker taking on values of 2.2, 2.4, 2.8, 3.6, 5.2, or 8.4 kHz. Thresholds were also re-tested in quiet. Testing with the 40-dB-SPL marker was not performed for the two
lowest masker edge frequencies (2.2 and 2.4 kHz), due to the fact that presence of the masker made the low-level stimulus inaudible or barely audible.
Further conditions were run in order to examine the pos-sibility that the high-frequency masking band may have affected gap detection performance via downward spread of masking of the gap marker. Only the 75-dB marker level was examined because results consistent with a spread of ex-citation effect were found only at this level. Gap detection thresholds were determined for LFN and random gap markers. In these conditions, the gap markers were 200-Hz-wide bands of noise centered on 2000 Hz. The masker was again a 1000-Hz-wide noise band, but in these conditions, the band was always centered on the same frequency as the gap marker, 2000 Hz. Gap detection was determined for dif-ferent levels of this on-frequency masker, ranging from 40 to 75 dB SPL. The gap thresholds obtained for the different on-frequency masker levels were intended to reveal the approxi-mate masker level at which gap thresholds increased with respect to the gap threshold in quiet. That level could then be compared with the expected magnitude of downward spread of masking associated with the high-frequency maskers, with lower edges from 2.2 to 8.4 kHz. This allowed us to make inferences about whether the effects of high-frequency maskers were due to downward spread of masking of the gap marker or to masking of upward spread of excita-tion associated with the gap marker.
B. Results
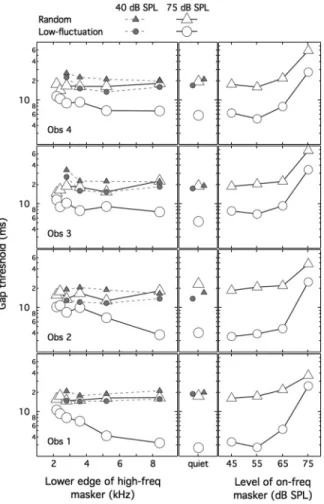
The results of experiment 2 are shown in Fig.3. Because there were some differences in the data patterns among the four observers, the individual data are displayed. The masking functions associated with the on- and off-frequency maskers are shown in the left- and right-most panels, respectively, and the thresholds in quiet are shown in the middle panels. The thresholds in quiet were consistent with those obtained in the associated conditions of experiment 1; mean thresholds across observers improved by 0%–12% in the four “quiet con-ditions” common to both experiments. Data for individual listeners are arranged vertically based on LFN thresholds in quiet for the 75-dB SPL level, with the lowest threshold in the bottom row (Obs 1, 2.7 ms) and the highest threshold in the top row (Obs 4, 5.8 ms). Intra-observer variability across the four threshold estimates obtained in each condition was quantified as the ratio between the highest and lowest thresh-old for a particular observer in a particular condition; these ratios ranged from 1.0 to 1.9, with a median value of 1.3.
The gap thresholds obtained with the high-frequency masker (left-most panel) tended to improve with increasing marker/masker separation for the LFN gap marker at 75 dB SPL (large, open circles), with little or no effect of marker/ masker separation for the 40 dB-SPL LFN marker (small, filled circles), or for either stimulation level with the random noise gap marker (triangles).
energetic masking wherein the masker to some extent “filled in” the marker gap via downward spread of masking. Since evidence of downward spread of masking was not seen above the 2.8-Hz frequency in the 40-dB-SPL data, it is unlikely that downward spread played a role in the 75-dB-SPL data for bands at and above this lower edge frequency.
The possible role of downward spread of masking in the 75-dB-SPL LFN data was further evaluated by assessing sus-ceptibility to on-frequency masking (right-most panels of Fig. 3) and computing excitation associated with off-frequency maskers. Although there were some individual differences in the on-frequency masker data functions, one commonality is that masked gap detection thresholds closely resembled thresholds in quiet for the 45 and 55 dB SPL lev-els; masking effects were observed at or above 65 dB SPL. In order to relate this finding to the off-frequency masking results we computed the target-to-masker ratio in excitation, using the nonlinear excitation model ofChenet al. (2011). We first determined the excitation patterns for the 55-dB-SPL on-frequency masker alone and then again for the gap marker (the target) plus masker. This level was selected as a
conservative estimate of the maximum level associated with little or no threshold elevation. The target-to-masker ratio in excitation for the 55-dB-SPL on- frequency masker was 8.0 dB. This analysis of excitation was repeated for the off-frequency maskers, which were all 75 dB SPL. The target-to-masker ratio was only 4.0 dB at 2.0-kHz for the lowest off-frequency masker (with a low edge at 2.2 kHz). However, the target-to-masker ratio was larger than 8.0 dB for all of the other off-frequency maskers. Repeating this analysis using the linear excitation model of Glasberg and Moore (1990) produced different values of the target-to-masker ratio, but supported the same general conclusion as the nonlinear model. These results support the idea that downward spread of masking could not account for the detri-mental effects of the off-frequency masker on gap thresholds in the 75-dB-SPL LFN stimuli.
Given the above considerations, the findings of the pres-ent experimpres-ent provide support for the idea that spread of excitation of the marker stimulus played a role in some of the results of experiment 1. Specifically, spread of excitation was likely to have contributed to the relatively low gap detection thresholds in the LFN, 75-dB-SPL conditions. In contrast, the results of experiment 2 provided no support for the idea that spread of excitation benefited gap detection in experiment 1 for either the 40-dB-SPL LFN conditions, or for the random noise conditions at either presentation level.
IV. GENERAL DISCUSSION
The random noise results of this study indicate that gap detection for noise bandwidths of 25 to 1600 Hz is grossly comparable across center frequencies from 500 to 4000 Hz. This result is similar to many of the data reported in previous studies using similar bandwidths (Eddinset al., 1992; Snell
et al., 1994;Eddins, 1999). Furthermore, the present random noise results showed very similar functions at the two levels of stimulus presentation. Despite the similarities across stim-ulus frequency and presentation level apparent in Fig. 2, statistical analysis indicated that there were small but signifi-cant effects related to center frequency and an interaction between level and bandwidth, in the direction of lower gap detection thresholds for stimulus parameters associated with wider auditory filters (higher frequency and higher level). These results are consistent with an interpretation that the influence of the auditory filter is relatively minor for random noise stimuli investigated here, but that there may be a slight benefit of wider auditory filters.
In contrast to the findings for random noise, frequency and level effects were obvious for the LFN data. These effects were broadly consistent with the idea that the benefit of LFN gap detection markers over random noise markers decreases as the noise bandwidth approaches and exceeds the auditory filter bandwidth. Analogous findings have been reported (Hartmann and Pumplin, 1988; Kohlrausch et al., 1997) for tone detection in LFN. The relatively large presen-tation level effect found for the LFN prompted experiment 2, which examined whether spread of excitation could have contributed to the large effect of presentation level. The results of experiment 2 supported the presence of a strong FIG. 3. Panels in the left column show gap detection thresholds for a
spread of excitation effect, occurring for the higher-level LFN condition only.
We note two ways that spread of excitation to cochlear regions corresponding to frequencies higher than the marker frequencies could have improved performance for the 75-dB-SPL LFN marker. These possibilities are not mutually exclusive. One is the integration of multiple looks from a number of auditory frequency channels stimulated by the higher-level LFN stimulus. Assuming that the internal noise associated with the multiple filters is uncorrelated, signifi-cant benefit could accrue via across-channel integration (e.g., Viemeister and Wakefield, 1991; Breebaart et al., 2001). While we do not rule out a multiple looks effect, a weakness of this idea is that there is some degree of level variation in the LFN stimuli, and it is possible that this “external noise” constitutes the limit for performance. This possibility receives support from the observation that gap detection for a pure-tone marker is better than for a LFN marker. In such a case, multiple looks might not be any more effective for the 75-dB-SPL LFN stimulus than for the other stimuli investigated. The other possibility is that the higher-level LFN stimulus resulted in spread of excitation to relatively high-frequency auditory filters whose properties result in a more faithful representation of the LFN stimulus envelope than is available at the outputs of “on-frequency” auditory filters. The low-frequency tail of a high-frequency auditory filter would attenuate the representation of the stim-ulus in the associated high-frequency channel, but it would do so relatively uniformly, such that the magnitude spectrum would closely resemble that of the original stimulus.1 A related factor concerns the phase curvature of auditory filters arising from the dispersion of the traveling wave in the inner ear (Kohlrausch and Sander, 1995; Ruggero et al., 1997; Carney et al., 1999; Lentz and Leek, 2001; Oxenham and Dau, 2001;Summerset al., 2003).
Previous physiological and psychoacoustical research suggests negative cochlear phase curvature, particularly at characteristic frequencies above approximately 1000 Hz (Carneyet al., 1999;Oxenham and Dau, 2001;Shera, 2001). In human psychoacoustical experiments, phase curvature has been inferred from the masking effects of multiple-harmonic, Schroeder-phase stimuli (Schroeder, 1970; Kohlrausch and Sander, 1995; Lentz and Leek, 2001; Oxenham and Dau, 2001;Oxenham and Ewert, 2005;Shen and Lentz, 2009). In many cases, positive Schroeder-phase complexes cause less masking than negative Schroeder-phase complexes, despite the fact that the two stimuli have identical magnitude spectra and relatively flat temporal envelopes. Better performance in the positive Schroeder case has been attributed to a nega-tive cochlear phase curvature, which results in a highly modu-lated envelope in the internal representation of the positive Schroeder-phase masker (similar to the modulation apparent in the physical stimulus when components are in sine phase). These modulations allow improved glimpses of the signal in masker modulation minima (Buus, 1985). Given that the amplitude and phase characteristics of a LFN are essential to its low-fluctuation quality, the phase curvature associated with the passband of an auditory filter should act to increase fluctuation in the internal representation of a LFN stimulus.
Relevant to the present findings, physiological and psycho-physical data indicate that the negative phase curvature near the characteristic frequency (CF) of an auditory filter is reduced (i.e., flatter) in the low-frequency tail of that filter (Shera, 2001;Oxenham and Ewert, 2005). Thus the good per-formance obtained for the 75-dB SPL LFN stimuli of experi-ments 1 and 2 could arise from spread of excitation, with off-frequency listening more faithfully representing the phase spectrum of the LFN gap marker and, as previously noted, the amplitude spectrum.Oxenham and Ewert (2005)reported psychoacoustical Schroeder-phase masker effects that are consistent with the above interpretation. For a masker having components from 1400 to 2600 Hz, they found that a 2000-Hz tonal signal had the lowest threshold for a negative phase curvature across masker components. However, for a masker comprising components from 200 to 1400 Hz (well below the signal frequency), they found that the 2000-Hz tonal signal had the lowest threshold near zero phase curvature (sine phase).
As noted in Sec.II Bof experiment 1, an unexpected fea-ture of the 40-dB-SPL LFN functions was that their shapes for bandwidths from 25 to 200 Hz varied only slightly across center frequencies from 500 to 2000 Hz, even though the au-ditory filter bandwidth increases a by a factor of approxi-mately 4 over this range (Moore and Glasberg, 1987). It is of interest to consider whether this result might also be related to auditory filter phase curvature. Oxenham and Dau (2001) noted that phase curvature estimated from their Schroeder-phase masking data indicated relatively slight Schroeder-phase curvature at CFs below 1000 Hz, a finding consistent with physiological data (Shera, 2001). With regard to the present 40-dB-SPL LFN findings, a relatively modest phase curvature at 500 Hz should be associated with relatively low gap detection thresh-olds at that frequency, perhaps making it less likely to find even lower thresholds at higher frequencies. This could con-tribute to the finding that function shapes were similar across center frequency for our 40-dB-SPL LFN stimuli. However, another factor associated with phase curvature would support the idea that the small variation in function shape for the cen-ter frequencies of 1000 and 2000 Hz is inconsistent with influence of phase curvature. The results ofShera (2001) indi-cated that phase curvature scales above 1000 Hz. Thus, for example, the phase curvature over a 100-Hz LFN bandwidth at 1000 Hz would be greater than for that same bandwidth when presented at 2000 Hz. Therefore, lower gap detection thresholds would be expected for the 100-Hz bandwidth pre-sented at 2000 Hz, in contrast to the null effect in the present results. A caveat is that, although there was some evidence of phase curvature scaling in the Schroeder-phase masking results of Oxenham and Dau (2001), their findings did not clearly indicate scaling between 1000 and 2000 Hz. Overall, we remain unable to account fully for the similar 40-dB-SPL LFN function shapes across center frequencies from 500 to 2000 Hz in the present data.
Dau, 2001; Oxenham and Ewert, 2005; Shen and Lentz, 2009) and are not entirely in agreement. For example, the studies by Oxenham and Dau (2001) and Shen and Lentz (2009)differed on the effects of stimulus level. Furthermore, these investigators have noted the inherent difficulty in using psychoacoustical techniques to make inferences about human cochlear processing. It is possible that phase manipu-lation of LFN stimuli could be used as an additional psycho-acoustical tool to gain leverage on the question of human cochlear phase curvature. The present results suggest that controlling spread of excitation cues would be important in any such work.
V. SUMMARY AND CONCLUSION
In the random noise conditions of experiment 1, there were small effects related to gap marker frequency and an interaction between level and bandwidth that were consist-ent with a benefit associated with wider peripheral filters (due to higher frequency and/or higher level). However, as can be seen in Fig. 2, these effects were small, and gap detection results for random noise markers were generally similar across frequency region and level for random noise stimuli of identical bandwidth. These results are similar to those of previous investigations using similar noise band-widths (e.g.,Eddinset al., 1992;Snellet al., 1994). In con-trast, the LFN results of experiment 1 showed some clear gap detection advantages for higher frequency regions, with this effect being accentuated at the higher stimulus level. The advantage due to increased level was disproportion-ately greater than that for increased frequency region when considered in terms of the associated increase in auditory filter width.
The LFN findings of experiment 2 were consistent with an interpretation that spread of excitation can aid gap detec-tion performance when the stimulus level is relatively high. This advantage could be related to the integration of gap information across auditory channels and/or the stimulation of higher-frequency auditory filters; stimuli passed by the low-frequency tails of these high-frequency filters could more closely represent the original stimulus features, due to relatively flat magnitude and/or phase response in the tail. Experiment 2 showed no spread of excitation advantage for random noise. The lack of a level effect for random noise is consistent with an interpretation that, regardless of auditory filter bandwidth or extent of auditory filter phase curvature, performance will be dominated by the relatively large enve-lope variability of the random noise stimulus.
ACKNOWLEDGMENTS
We are grateful for the helpful comments of two anonymous reviewers and the associate editor, Erick Gallun. This work was supported by the National Institutes of Health, Grant No. NIDCD: R01 DC000418 (J.W.H.).
1
It should be pointed out that the encoded stimulus envelope corresponding to upward spread of excitation should be more linear (less compressed) than that corresponding to excitation at the CF (e.g.,Ruggeroet al., 1997). Therefore, noise envelope fluctuations would be accentuated for the upward spread of excitation compared to the envelope fluctuations at CF.
However, because this situation also applies to the salience of the imposed gap, it is not clear that differences in compression for on-frequency versus off-frequency listening would be an important factor in the present results.
ANSI S3.6-2010. (2010). American National Standard Specification for Audiometers(American National Standards Institute, New York). Bos, C. E., and de Boer, E. (1966). “Masking and discrimination,”
J. Acoust. Soc. Am.39, 708–715.
Breebaart, J., van de Par, S., and Kohlrausch, A. (2001). “Binaural process-ing model based on contralateral inhibition. II. Dependence on spectral parameters,”J. Acoust. Soc. Am.110, 1089–1104.
Buss, E., Hall, J. W. III, Porter, H., and Grose, J. H. (2014). “Gap detection in school-age children and adults: Effects of inherent envelope modulation and the availability of cues across frequency,”J. Speech Lang. Hear. Res.
57, 1098–1107.
Buus, S. (1985). “Release from masking caused by envelope fluctuations,”
J. Acoust. Soc. Am.78, 1958–1965.
Carney, L. H., McDuffy, M. J., and Shekhter, I. (1999). “Frequency glides in the impulse responses of auditory-nerve fibers,” J. Acoust. Soc. Am.
105, 2384–2391.
Chen, Z., Hu, G., Glasberg, B. R., and Moore, B. C. (2011). “A new method of calculating auditory excitation patterns and loudness for steady sounds,”Hear. Res.282, 204–215.
Eddins, D. A. (1999). “Amplitude-modulation detection at low- and high-audio frequencies,”J. Acoust. Soc. Am.105, 829–837.
Eddins, D. A., and Green, D. M. (1995). “Temporal integration and temporal resolution,” inHearing, edited by B. C. J. Moore (Academic Press, New York), pp. 207–242.
Eddins, D. A., Hall, J. W., and Grose, J. H. (1992). “The detection of tempo-ral gaps as a function of frequency region and absolute noise bandwidth,”
J. Acoust. Soc. Am.91, 1069–1077.
Fletcher, H. (1940). “Auditory patterns,”Rev. Mod. Phys.12, 47–65. Glasberg, B. R., and Moore, B. C. J. (1990). “Derivation of auditory filter
shapes from notched- noise data,”Hear. Res.47, 103–138.
Glasberg, B. R., and Moore, B. C. J. (1992). “Effects of envelope fluctua-tions on gap detection,”Hear. Res.64, 81–92.
Green, D. M. (1985). “Temporal factors in psychoacoustics,” in Time Resolution in Auditory Systems, edited by A. Michelsen (Springer-Verlag, New York).
Grose, J. H., Buss, E., and Hall, J. W. (2008). “Gap detection in modulated noise: Across-frequency facilitation and interference,” J. Acoust. Soc. Am.123, 998–1007.
Grose, J. H., Eddins, D. A., and Hall, J. W. (1989). “Gap detection as a func-tion of stimulus bandwidth with fixed high-frequency cutoff in normal-hearing and normal-hearing-impaired listeners,” J. Acoust. Soc. Am. 86, 1747–1755.
Hartmann, W. M., and Pumplin, J. (1988). “Noise power fluctuations and the masking of sine signals,”J. Acoust. Soc. Am.83, 2277–2289. Houtgast, T. (1989). “Frequency selectivity in amplitude-modulation
detection,”J. Acoust. Soc. Am.85, 1676–1680.
Kirk, R. E. (1968). Experimental Design: Procedures for the Behavioral Sciences(Wadsworth, Belmont, CA).
Kohlrausch, A., Fassel, R., van der Heijden, M., Kortekaas, S., van de Par, S., and Oxenham, A. J. (1997). “Detection of tones in low-noise noise: Further evidence for the role of envelope fluctuations,” Acta Acust.83, 659–669.
Kohlrausch, A., and Sander, A. (1995). “Phase effects in masking related to dispersion in the inner ear. II. Masking period patterns of short targets,”
J. Acoust. Soc. Am.97, 1817–1829.
Lentz, J. J., and Leek, M. R. (2001). “Psychophysical estimates of cochlear phase response: Masking by harmonic complexes,” J. Assoc. Res. Otolaryngol.2, 408–422.
Moore, B. C., Peters, R. W., and Glasberg, B. R. (1993). “Detection of tem-poral gaps in sinusoids: Effects of frequency and level,”J. Acoust. Soc. Am.93, 1563–1570.
Moore, B. C. J. (2012).An Introduction to the Psychology of Hearing, 6th ed. (Brill, Leiden).
Moore, B. C. J., and Glasberg, B. R. (1987). “Formulae describing fre-quency selectivity as a function of frefre-quency and level, and their use in calculating excitation patterns,”Hear. Res.28, 209–225.
Oxenham, A. J., and Ewert, S. D. (2005). “Estimates of auditory filter phase response at and below characteristic frequency,”J. Acoust. Soc. Am.117, 1713–1716.
Patterson, R. D., and Moore, B. C. J. (1986). “Auditory filters and excitation patterns as representations of frequency resolution,” in Frequency Selectivity in Hearing, edited by B. C. J. Moore (Academic, London), pp. 123–177.
Rice, S. O. (1954). “Mathematical analysis of random noise,” inSelected Papers on Noise and Stochastic Processes, edited by N. Wax (Dover, New York).
Ruggero, M. A., Rich, N. C., Recio, A., Narayan, S. S., and Robles, L. (1997). “Basilar-membrane responses to tones at the base of the chinchilla cochlea,”J. Acoust. Soc. Am.101, 2151–2163.
Schroeder, M. R. (1970). “Synthesis of low peak-factor signals and binary sequences with low autocorrelation,”IEEE Trans. Inf. Theory16, 85–89. Shailer, M. J., and Moore, B. C. J. (1983). “Gap detection as a function of
frequency, bandwidth and level,”J. Acoust. Soc. Am.74, 467–473. Shailer, M. J., and Moore, B. C. J. (1985). “Detection of temporal gaps in
bandlimited noise: Effects of variations in bandwidth and signal-to-masker ratio,”J. Acoust. Soc. Am.77, 635–639.
Shen, Y., and Lentz, J. J. (2009). “Level dependence in behavioral measure-ments of auditory-filter phase characteristics,”J. Acoust. Soc. Am.126, 2501–2510.
Shera, C. A. (2001). “Frequency glides in click responses of the bas-ilar membrane and auditory nerve: Their scaling behavior and ori-gin in traveling-wave dispersion,” J. Acoust. Soc. Am. 109, 2023–2034.
Snell, K. B., Ison, J. R., and Frisina, D. R. (1994). “The effects of signal fre-quency and absolute bandwidth on gap detection in noise,”J. Acoust. Soc. Am.96, 1458–1464.
Summers, V., de Boer, E., and Nuttall, A. L. (2003). “Basilar-membrane responses to multicomponent (Schroeder-phase) signals: Understanding intensity effects,”J. Acoust. Soc. Am.114, 294–306.
Viemeister, N. F., and Wakefield, G. H. (1991). “Temporal integration and multiple looks,”J. Acoust. Soc. Am.90, 858–865.
Wang, J., Feng, Y. M., and Yin, S. K. (2006). “The effect of gap-marker spectrum on gap-evoked auditory response from the inferior colliculus and auditory cortex of guinea pigs,”Int. J. Audiol.45, 521–527.