Gold Nanoparticles as Absolute Nanothermometers
Aquiles Carattino, Mart
í
n Caldarola, and Michel Orrit
*
Huygens-Kamerlingh Onnes Lab, 2300RA Leiden, The Netherlands
*
S Supporting InformationABSTRACT: Nanothermometry is a challenging field that
can open the door to intriguing questions ranging from biology and medicine to material sciences. Gold nanorods are excellent candidates to act as nanoprobes because they are reasonably bright emitters upon excitation with a mono-chromatic source. Gold nanoparticles are commonly used in photothermal therapy as efficient transducers of electro-magnetic radiation into heat. In this work we use the spectrum of the anti-Stokes emission from gold nanorods irradiated in resonance to measure the absolute temperature of the
nanoparticles and their surrounding medium without the need for a previous calibration. We show a 4 K accuracy in the determination of the temperature of the medium with spectral measurements of 180 s integration time. This procedure can be easily implemented in any microscope capable of acquiring emission spectra, and it is not limited to any specific shape of nanoparticles.
KEYWORDS: Gold nanorods, plasmon, anti-Stokes, sensing, temperature
M
ost physical, chemical, and biological processes depend on temperature. Together with the miniaturization of devices and the advent of nanotechnology, the need for measuring temperature with high spatial accuracy started to emerge. Notably in biology1,2 and medicine3 measuring and controlling temperature at a subcellular scale are the challenges that must be overcome to achieve better understanding and control of new therapies such as photothermal tumor ablation4 or controlled drug delivery.5,6Nanometer-size probes with distinctive spectral features are ideal candidates for temperature measurements since they provide high spatial accuracy while far-field optics allow a noncontact readout. Some of the proposed strategies include structures that undergo a conformational change upon an increase in temperature,7 thus inducing variations in fluorescence intensity of a dye molecule embedded in them.
Also cleverly designed lanthanide-basedfluorescent probes in which the ratio of particular emission peaks depends on temperature provide a high accuracy and can be used as nanothermometers8 even in biological samples.9 Photobleach-ing is often an important limitation of these approaches. Recently, surface enhanced Raman spectroscopy (SERS) allowed to measure spectral changes induced by temperature down to single molecules,10 but a careful calibration of the measurements is crucial.
Gold nanoparticles continue to receive a fair amount of attention because of their unique optical properties.11 The collective oscillation of conduction electrons, also known as surface plasmon, shows a resonance in the visible to near-infrared wavelengths. This resonance can be tuned by changing the shape of the particles12 and is responsible for a large absorption and scattering cross section at the resonance
wavelength. These cross sections can be calculated by solving the Maxwell equations numerically employing different computer packages,13−15providing a good agreement between calculations and what is experimentally achievable.
Thanks to their high absorption and scattering cross section (several times higher than their geometrical cross section), it is relatively simple to detect nanoparticles in a dark-field scattering configuration16 or via photothermal imaging.17,18 Alternatively, detecting gold nanoparticles through their luminescence19is also possible; their low quantum yield,20−23 around 10−6, is compensated by the enhanced cross section at
the surface plasmon resonance (SPR). The luminescence signal is stable over time; gold nanoparticles do not blink nor bleach and therefore are useful labeling agents for processes that require extended periods of observation.24
Different metallic nano-objects are being introduced as agents for photothermal therapy5,25or drug delivery.26One of the advantages of gold nanoparticles is the possibility of tuning their resonance to the near-infrared range, where the penetration of light into tissues can be of several centimeters.3−5,25,27,28 Moreover, the particles can be used not only for treatment, but also for imaging.5,29In the case of photothermal therapy, nanoparticles are used as heat sources4,27 to locally increase the temperature in order to induce the death of specific cells in a tissue.5,25However, the temperatures reached30can only be estimated from models29or from an ad-hoc calibration. Therefore, a method to
Received: September 26, 2017
Revised: December 21, 2017
Published: December 22, 2017
Letter
pubs.acs.org/NanoLett Cite This:Nano Lett.2018, 18, 874−880
© 2017 American Chemical Society 874 DOI:10.1021/acs.nanolett.7b04145
Derivative Works (CC-BY-NC-ND) Attribution License, which permits copying and
redistribution of the article, and creation of adaptations, all for non-commercial purposes.
Downloaded via LEIDEN UNIV on July 24, 2018 at 12:29:49 (UTC).
simultaneously increase and monitor the local temperature will be of great interest in a broad range offields.
Luminescence of metallic nanoparticles has been the subject of extensive study in recent years. Since thefirst observation of luminescence from bulk gold,31different groups have tried to quantitatively describe the observed properties,32−36such as the quantum yield20−23,37 and the emission spectrum.38 In particular, gold nanorods present two distinct resonance energies, namely, the transverse and the longitudinal plasmon resonances. These particles can therefore be excited efficiently at one of those energies; the transverse resonance corresponds to a wavelength of about 530 nm and will give rise to a broad luminescence emission with a peak at the longitudinal plasmon energy. Conversely, it is possible to excite the particles with a wavelength matching the longitudinal plasmon resonance. In this case, the excitation benefits from an enhanced absorption cross section, but the emission that overlaps the plasmon resonance will be mostly blocked by the filters needed to prevent direct excitation light from reaching the detectors.
In this work, we call “photoluminescence” any secondary light emission39at energies different from the excitation laser energy,ℏωL. After absorption (we do not specify whether the absorption is real or virtual) of an excitation photon, the excited electronic state31,37may interact and exchange energy with the phonon bath or, in the case of metals, with the bath of thermally excited charge carriers around the Fermi level. After a number of interactions, the excited electronic state will re-emit a photon, which can possess a lower or higher energy than that of the excitation photon.40−42For a nonresonant excitation, the probability of more than one interaction is negligible, and the main contribution to secondary emission is Raman scattering.34 This is the case, for example, of insulators excited well below their electronic absorption edge. For resonant excitation, a relatively long-lived excited state is prepared. It will have enough time to interact repeatedly with thermal baths, particularly with phonons. This is the case of organic dye molecules or semiconductors in which relaxed fluorescence is observed. We also note thatfluorescence always presents hot bands on the anti-Stokes side of the excitation laser. In most fluorescence detection schemes, however, these hot bands are ignored, but they are far from negligible in heavily doped samples.43
Metal nanoparticles fall between those two extremes because the excited electronic state, an electron−hole pair, relaxes very rapidly by interacting with other charge carriers and with phonons. The photoluminescence lifetimes are on the order of tens of femtoseconds,44and therefore, there is not enough time to obtain a fully relaxed luminescence. In other words, the photoluminescence is always “hot”. It is worth noting that Raman scattering, corresponding to the lowest order of interaction with baths, will be an important contribution to photoluminescence.34,36 However, second and higher orders may also contribute significantly. Because all these processes obey a Boltzmann-type relationship between anti-Stokes and Stokes emission, they cannot be easily distinguished from each other on the basis of their temperature dependence.
The anti-Stokes emission is highly sensitive to temperature, and thus, it can be used for thermometry.45In this Letter, we present a simple procedure to extract the absolute temperature from the anti-Stokes photoluminescence spectrum of individual gold nanorods without the need of any previous temperature calibration. We show that we can determine the particle temperaturein situwith an accuracy of 6% by recording a single
anti-Stokes spectrum (with an acquisition time of 3 min). Moreover, by performing this measurement at different excitation powers we can obtain the temperature of the surrounding medium with an accuracy better than 2%.
Phenomenological Model for the Luminescence Emission. In a nutshell, we consider the luminescence emission as radiative recombination of electron−hole pairs created by the decay of the plasmon, after their interaction with thermal baths. Before the recombination, carriers may interact with the baths one or more times, leading to secondary light emission with an energy different from the initial internal energy of the pair. The anti-Stokes spectral contribution arises from interactions that increase the energy of the pair, whereas the Stokes emission corresponds to a decrease in energy. The emission process will be enhanced by the surface plasmon; therefore, the luminescence spectrum will be modulated with the plasmon shape. A schematic representation of these ideas is shown in theSupporting Information.
Exciting a gold nanorod with a monochromatic beam at its resonance frequency,ωSPR, generates a collective oscillation of
the gas of conduction electrons, also called a plasmon. The plasmon decays by forming a pair of hot electron and hole with an internal energy equal to the exciting photon energy,46−48i.e.,
Ee−h=ℏωL, whereωL is the laser frequency.
This hot electron−hole pair has a small probability of recombining radiatively, i.e., of re-emitting its high electronic energy as a photoluminescence photon. If the electron and hole have interacted only with static surfaces or defects, their energies will be the same. Therefore, the emitted photon will have the same energy as the incoming photon and will not contribute to the measured photoluminescence. It will be blocked by the notchfilter used to remove the exciting laser from detection. If, however, the electron and hole have interacted with a phonon or a thermally excited electron or hole, they may have lost or acquired energy. In both cases the energy available upon recombination cannot much exceed
ℏωL +kBT, wherekBrepresents Boltzmann’s constant and T
the absolute temperature.
Radiative recombination gives rise to emission spectrally and spatially distributed throughout the particle over a broad frequency band with an exponential cutoffatℏωL+kBT. The weak recombination emission can be greatly enhanced by the surface plasmon resonance, acting as an antenna. With this model, the following predictions can be made. First, the emission spectrum must follow the plasmon spectrum if the excitation laser is well above the plasmon resonance as shown inFigure 1, green line. If the excitation falls within the plasmon resonance, the spectrum is expected to follow the plasmon spectrum multiplied by a Bose−Einstein statistics factor arising from phonon population (here, we assume that the coupling to the phonons dominates the process, while refs 34 and 36
assume that carrier−carrier interactions dominate). Thus, under our assumption, the emission should be proportional to the phonon occupation numbern̅for anti-Stokes andn̅+ 1 for Stokes processes, with
̅ = ℏΩ −
− ⎛
⎝
⎜ ⎞
⎠ ⎟ n
k T exp 1
B
1
(1)
whereℏΩis the phonon energy. If carrier−carrier interactions dominate, the occupation number would obey Fermi statistics,
i.e., = ℏΩ +
−
(
( )
)
n exp 1
k T
1
B .
With this model, we can also predict that the emission should be polarized. For the strong longitudinal plasmon of gold nanorods, this polarization coincides with the longitudinal axis of the particle.49Moreover, the lifetime should be determined by the lifetime of hot electrons and holes and should be significantly shorter than the thermalization time of the carriers. Indeed, a few interactions would suffice to reduce the carriers’ energy significantly, and therefore, the electron and hole would not have the energy required to produce an optical photon. One important assumption for this model is that the emission spectrum of radiative recombination is much broader than the plasmon. Therefore, excitation just above the plasmon resonance should excite the electron−hole pairs with nearly the same efficiency as well above the plasmon resonance.23,36
Application to Nanothermometry. According to the model just described, the anti-Stokes emission spectrum follows the form
ω = ω ℏ ω−ω − − ⎛
⎝
⎜ ⎞
⎠ ⎟
I I
k T
( ) SPR( ) exp ( L) 1
B
1
(2)
whereI(ω) is the emitted intensity,ωis the angular frequency of the photons,ωL is the frequency of the exciting laser, and ISPR(ω) is the surface plasmon resonance spectrum. The only
remaining free parameter is the temperature T (and a normalization constant not included ineq 2).
The procedure we propose to obtain the absolute temper-ature T of gold nanorods from the anti-Stokes luminescence emission without the need of any previous temperature calibration involves the following steps:
1. Obtain the surface plasmon resonance spectrum of the particle. This is usually expressed as a Lorentzian function,11i.e.,
ω
ω ω
= Γ
− + Γ
I ( ) ( /2) ( ) ( /2)
SPR
2
SPR 2 2
where ω is the photon energy frequency, ωSPR is the
resonance frequency, andΓ is the width of the surface plasmon resonance. In our case, we detect the spectrum of photoluminescence excited at 532 nm to extractωSPR andΓ, with the procedure explained in the Supporting Information.
2. Excite near the longitudinal plasmonic resonance and detect the blue-shifted anti-Stokes emission spectra. For this we employed a 633 nm laser as a source.
3. Fit the high-energy part of the spectrum usingeq 2with
Tas theonlyfree parameter.
We emphasize that we cannot simply use the anti-Stokes to Stokes intensity ratio to obtain the temperature of the particle, as is commonly done with Raman lines of molecules,50,51due to the presence of the strong plasmonic enhancement of the emission that must be considered in addition to the Boltzmann factor.
Experimental Methods. All the measurements in this work were performed with a home-built confocal microscope equipped with a spectrometer (Acton 500i) in the emission path. We focused our lasers to a diffraction-limited spot using a 60×, NA 1.4 oil immersion objective (Olympus) or a 60×, NA 0.9 air objective (Olympus) and collected the emitted photons through the same objective. This provided high excitation and collection efficiency. We employed a 532 nm (CNI) laser for characterizing the nanorods’ plasmon and a 633 nm HeNe (Thorlabs) to excite the nanorods in resonance. The intensity of the laser was controlled via an acousto-optic modulator. We provide a scheme of the setup and more details in the
Supporting Information.
Wet-chemically synthesized nanorods52with average dimen-sions of 25 nm×50 nm and a plasmon resonance around 630 nm were spin-coated onto clean coverslips, controlling the superficial concentration to separate individual nanorods within the diffraction-limited spot.11The characterization of the gold nanorods sample with transmission electron microscopy (TEM) and the ensemble extinction spectrum are presented in theSupporting Information.
The samples were mounted in aflow cell that allowed us to increase the temperature of the medium up to 60 °C and to monitor it through a Pt100 resistance thermometer placed 1 mm away from the observation area. To compensate for the drift of the setup while increasing the temperature, we developed a computer program to continuously track a reference particle. The same program was responsible for recording the temperature and triggering the spectrometer. In this way, complete data sets were acquired at different temperatures, with excitation at 532 and 633 nm, at different laser intensities. A spectrum with 532 nm laser excitation was taken after every cycle to ensure that the particle under study had not reshaped due to high excitation power.
When recording anti-Stokes spectra to extract the temper-ature of the particles using the high NA objective, six accumulations of each spectrum were recorded with an exposure time of 10 s (total time of 60s). When we used the low NA objective the exposure time was increase to 30s in each exposition (total time 180s). This not only allowed us to lower the noise of the measurement because of a longer exposure time, but also allowed us to remove bright pixels generated by cosmic rays. Having several accumulations is also useful to monitor changes in the intensity of the spectra during the acquisition itself. These changes can be due to a drift of the
Figure 1.Luminescence emission spectra of a single gold nanorod. The green curve is the measured luminescence emission under 532 nm excitation, and the red curve shows the extractedISPR(ω) from this
spectra. The other curves are the emission of the same particle under 633 nm irradiation at three different powers indicated in the legend. The inset shows the anti-Stokes-to-Stokes ratio as a function of the excitation power, overlapped with a linearfit in red. The dip centered on the laser wavelength is caused by the notchfilter used to prevent the excitation laser from reaching the detectors. For these spectra, the acquisition time was 10 s.
Nano Letters
setup while measuring or to reshaping of the particle. If the reshaping was confirmed by comparing the spectra acquired with the 532 nm laser,53the measurements where rejected. If the changes in the observed emission spectra were due to drift of the setup, the particular data set was not taken into account. For the purposes of this work, the excitation intensity is crucial for characterizing the method; if the particle is not in focus, it would result in an overestimation of the excitation power.
Results.The proposed model for the anti-Stokes emission requires the plasmon spectrum (ISPR(ω) ineq 2) in order tofit the emission at shorter wavelengths and extract the particle temperature. It has been shown that both scattering and luminescence spectra roughly overlap over a broad range of wavelengths.22Therefore, exciting gold nanorods with 532 nm allows us to record the longitudinal plasmon spectra, as shown in the green solid curve ofFigure 1. It has to be recalled that the luminescence spectrum is not a perfect Lorentzian since there is a broadband contribution also observed in bulk gold.31 The procedure to extract the SPR profile from such a measurement is explained in theSupporting Information. We show inFigure 1the extracted surface plasmon profile in the red solid curve.
The other curves in Figure 1 show the luminescence emission of the same nanorod with irradiation at 633 nm at different powers, ranging from 25 to 75 μW at the back aperture of the objective. The vertical black line shows the wavelength of the laser. The Stokes part of the spectrum at longer wavelengths than the excitation shows the same shape as the plasmon emission observed under 532 nm excitation, apart from a normalization factor. From thefigure, it can readily be seen that the shape of the anti-Stokes emission, at shorter wavelengths than excitation, is exponential-like and does not follow the Lorentzian shape of the Stokes emission. The dip between Stokes and anti-Stokes is caused by the notch filter that prevents direct excitation light from reaching the detectors. The inset ofFigure 1shows the anti-Stokes-to-Stokes ratio of the integrated luminescence for different laser excitation intensities. It is possible to see that even though the photoluminescence process is linear, the anti-Stokes intensity increases slightly more rapidly than the Stokes emission. We already exploited this phenomenon to image gold nanorods in high-background conditions.43 For more information on the power dependence of both the anti-Stokes and Stokes luminescence, please refer to theSupporting Information.
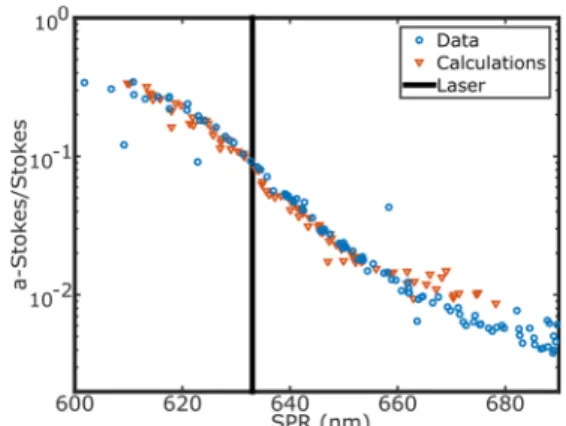
To further characterize the anti-Stokes emission in gold nanorods, we measured the emission for 105 nanorods with different plasmon resonances under the same 633 nm excitation and calculated the ratio of integrated anti-Stokes to Stokes emissions.Figure 2shows the experimental ratios as blue circles versus the surface plasmon resonance (SPR) of the particle. The vertical black line marks the laser wavelength. The particles measured had resonances between 600 and 690 nm; the ones showing the maximum ratio of anti-Stokes to Stokes are those with a resonance to the blue of the laser. For these particles, the longitudinal plasmon is enhancing preferably the anti-Stokes emission. For particles with a resonance at the laser wavelength, the anti-Stokes and the Stokes emission have similar enhance-ment and show a ratio close to 10%.
Figure 2also shows as red triangles the results of numerical calculations showing an excellent overlap between the measured and the calculated data. To obtain these results, we numerically calculated the absorption cross section of 82 particles with the ADDA package14 using a fixed width and
different lengths to achieve different SPR wavelengths. Each calculated absorption spectrum wasfitted by a Lorentzian and used as ISPR(ω) in eq 2. Assuming a diffraction-limited laser
spot and using the calculated absorption cross section, we calculated the temperature of the particle. This value was used in eq 2 to compute the anti-Stokes emission spectrum. The Stokes emission was set proportional to the excitation power with a shape given by the calculated absorption spectrum. Since both anti-Stokes and Stokes emissions are proportional to the excitation power, this term cancels out when computing the ratio. The laser power therefore only enters into the equation when calculating the temperature of the particles. It is remarkable that the agreement between data and calculations was achieved without free parameters, solely taking into account the transmission spectra of thefilters.
We then use our protocol to extract the temperature of an individual nanorod. The anti-Stokes spectra shown inFigure 3 Figure 2.Characterization of anti-Stokes emission for different surface plasmon resonance. Ratio of the anti-Stokes to Stokes emission under 633 nm excitation as a function of the resonance wavelength of the particle. The blue circles are experimental results (105 different nanorods), while the red triangles are the results of numerical simulations witheq 1(82 nanorods with different aspect ratio). There is a very good agreement between experiment and calculations. Particles with a resonance to the blue of the laser (indicated by the vertical black line) have an increased anti-Stokes emission.
Figure 3. Anti-Stokes emission of a single nanorod at different irradiation powers. We used the model from eq 2 to fit the experimental data. There is an excellent agreement between data and model. The inset shows the extracted temperature at each power (blue dots) and a linear extrapolation of the data to 0μW excitation power. The value obtained for room temperature was 293 K, while the measured value was 296 K.
were recorded at four different excitation intensities, while the full lines are thefits using our model fromeq 2; again, there is an excellent agreement between data and model. For every anti-Stokes measurement we have also acquired the full plasmon spectrum exciting with a 532 nm laser before and after the temperature extraction, to verify that the particle did not reshape while being excited at resonance.
The inset inFigure 3shows the temperatures resulting from thefits at different irradiation intensities (blue dots). Note that the absolute temperatures of the particle at each excitation power were calculated without any calibration. As expected, the temperature of the nanorod varied linearly with excitation intensity or equivalently with the absorbed energy. Thus, this method provides an in situ way to measure the temperature reached by nanoparticles when they are excited with resonant monochromatic light. Additionally, from these data sets it is also possible to calculate the temperature at 0μW excitation power, i.e., room temperature, by extrapolating the results with a linearfit. The value we obtained in this case is 293 ± 6 K, while room temperature was 296 K, a 2% accuracy.
The accuracy of the obtained temperature depends on the signal-to-noise ratio of the anti-Stokes spectra and on the accurate modeling of the photoluminescence. Thefirst step in the protocol is the determination of the surface plasmon spectral profile,ISPR(ω) ineq 2. In this Letter, we obtained this
term byfitting an exponential background plus a Lorentzian to the spectra obtained at 532 nm excitation. We note that this choice was made for experimental convenience in our setup, but other options to obtain the SPR profile are suited for the procedure as well. The error bars in the inset ofFigure 3and in the followingfigures are the result of the estimated variance in thefit parameters for the anti-Stokes spectra usingeq 2, step 3 in our protocol. More details about the error determination for the final temperature extracted are given in the Supporting Information.
As expected from the model, the anti-Stokes emission depends not only on the particle’s intrinsic properties but also on the temperature of the surrounding medium.54In order to further test this point, we changed the temperature of the sample in a controlled manner and recorded the luminescence emitted by a single nanorod.
For this set of experiments, we employed an air objective (60×, NA 0.9, Olympus) to avoid the presence of a heat sink directly in contact with the observed area. We employed longer exposure times to compensate for the lower excitation efficiency. At each temperature, six spectra (with 30 s integration time each) were acquired at different 633 nm excitation powers and also a spectrum of the plasmon before and after each measurement in order to monitor any possible reshaping of the particles during the experiment.
Figure 4 shows the extracted temperature of a particle at varying excitation powers and at different water temperatures. The blue squares are the results of the measurement at 60°C, while the green crosses are measured at 40°C and the yellow circles at 20°C. The full lines arefits with the same slope for the three sets of data. Using thesefits we can extrapolate the temperature value at zero excitation power to obtain the water temperature in each case. The values obtained with the extrapolation to 0μW excitation power were 296±4, 315±4, and 339±4 K for water temperatures of 293, 313, and 333 K, respectively. The inset plot inFigure 4 presents these points and a red solid line with the expected curve if both temperatures are identical. The dashed line shows afit of the
data that evidence a small systematic offset of 3.8 K. This represents an inaccuracy of 1.2%, which is a good result for a calibration-free method.
Figure 4 clearly shows that the extracted temperature varies with the temperature of the surrounding medium. More strikingly, the method does not require any previous calibration nor adjustment. Notably, the presented calibration-free procedure would allow us to perform the same measurements in any other setup and could act as a reference for calibration of other nanothermometers.
Being able to control and monitor temperature at the nanoscale is of utmost importance in different fields ranging from photothermal therapy5to nanofabrication.55In this work, we have shown a simple procedure that allows us to measure the temperature of single gold nanorods irradiated by a monochromatic continuous laser and without any previous calibration. The level of accuracy of the temperature measure-ment depends on several factors, but for a single nanorod, it can be estimated to be better than 6% with an integration time of 1 min without any previous calibration.
The model employed for describing the anti-Stokes emission takes into account the surface plasmon resonance of the particles under study, which is responsible for enhancing the emission, as well the electron−hole pair interaction with the thermal baths. Particles with a resonance to the red of the excitation wavelength would be more reliable in the temper-ature extraction procedure but would also exhibit a lower emission toward shorter wavelengths. The trade-off between both effects and the possibility to fully characterize the plasmon resonance will determine the specific particles that are better suited for each application.
A possible improvement of this technique would be the use of nanostructures with a narrow shape distribution such as gold bipyramids.56 Such structures would be ideal candidates for temperature extraction since they present negligible size dispersion, and thus, their plasmon can be measured in bulk or determined from theory, avoiding the need of a second excitation source.
Figure 4. Calibration-free temperature measurement. Extracted temperatures from the anti-Stokes-luminescence emission of an individual nanorod at different excitation powers and at different sample temperatures. The dashed lines arefits with the same slope for the three temperatures. The squares in the inset plot show the local temperature of the sample obtained by extrapolating the temperature at zero excitation power as a function of the water temperature. The red line represents the expected curve if both temperatures are identical (equal). The dashed blue line is afit to the data points with unit slope that shows a systematic offset of 3.8 K, a 1.2% difference.
Nano Letters
The proposed method does not require any temperature calibration since the only free parameter of the model is the absolute temperature of the nanoparticle under study. More-over, the recording of the anti-Stokes spectrum is readily achievable in any confocal microscope with a coupled spectrometer. A 6 K accuracy may suffice for several applications; it is important to point out that this value can be improved in different ways: by carefully selecting the particles that show the most favorable plasmon resonance; by determining the plasmon resonance through white-light scattering, reducing the uncertainty in thefit; and by increasing the exposure times to increase the signal-to-noise ratio. A cheaper alternative would have two detectors and band-pass filters to detect the anti-Stokes and the Stokes emission independently. However, this approach would require a temperature calibration.
■
ASSOCIATED CONTENT*
S Supporting InformationThe Supporting Information is available free of charge on the
ACS Publications website at DOI:
10.1021/acs.nano-lett.7b04145.
Anti-Stokes emission from gold nanorods, determination of the surface plasmon resonance energy, experimental setup, gold nanorods sample characterization, lumines-cence power dependence, determination of the error in the temperature extraction, gold nanorod temperature numerical calculations (PDF)
■
AUTHOR INFORMATIONCorresponding Author
*E-mail: orrit@physics.leidenuniv.nl.
ORCID
Martín Caldarola: 0000-0001-8086-2580 Michel Orrit:0000-0002-3607-3426
Notes
The authors declare no competingfinancial interest.
■
ACKNOWLEDGMENTSThis work has been financed by FOM, which is part of The Netherlands Organisation for Scientific Research (NWO) (programme number 11SGC02), and by NWO (grant ECHO 712.013.003).
■
REFERENCES(1) Yang, J.-M.; Yang, H.; Lin, L.ACS Nano2011,5, 5067−5071. (2) Hrelescu, C.; Stehr, J.; Ringler, M.; Sperling, R. A.; Parak, W. J.; Klar, T. A.; Feldmann, J.J. Phys. Chem. C2010,114, 7401−7411.
(3) Li, Y.; Gobin, A. M.; Dryden, G. W.; Kang, X.; Xiao, D.; Li, S. P.; Zhang, G.; Martin, R. C. G.Int. J. Nanomed.2013,8, 2153−2161.
(4) Gobin, A. M.; Lee, M. H.; Halas, N. J.; James, W. D.; Drezek, R. A.; West, J. L.Nano Lett.2007,7, 1929−1934.
(5) Huang, X. H.; El-Sayed, I. H.; Qian, W.; El-Sayed, M. a.J. Am. Chem. Soc.2006,128, 2115−2120.
(6) Huo, S.; Jin, S.; Ma, X.; Xue, X.; Yang, K.; Kumar, A.; Wang, P. C.; Zhang, J.; Hu, Z.; Liang, X.-J.ACS Nano2014,8, 5852−5862.
(7) Ebrahimi, S.; Akhlaghi, Y.; Kompany-Zareh, M.; Rinnan, A.ACS Nano2014,8, 10372.
(8) Liu, X.; Siegler, M. A.; Bouwman, E.Eur. J. Inorg. Chem. 2016, 2016, 2984−2988.
(9) Vetrone, F.; Naccache, R.; Zamarron, A.; Juarranz de la Fuente,́ A.; Sanz-Rodríguez, F.; Martinez Maestro, L.; Martín Rodriguez, E.;
Jaque, D.; García Solé, J.; Capobianco, J. A.ACS Nano2010,4, 3254− 8.
(10) Pozzi, E. A.; Zrimsek, A. B.; Lethiec, C. M.; Schatz, G. C.; Hersam, M. C.; Van Duyne, R. P.J. Phys. Chem. C2015,119, 21116− 21124.
(11) Zijlstra, P.; Orrit, M.Rep. Prog. Phys.2011,74, 106401. (12) Carattino, A.; Khatua, S.; Orrit, M. Phys. Chem. Chem. Phys. 2016,18, 15619−15624.
(13) Draine, B. T.; Flatau, P. J.J. Opt. Soc. Am. A1994,11, 1491. (14) Yurkin, M. A.; Hoekstra, A. G. J. Quant. Spectrosc. Radiat. Transfer2011,112, 2234−2247.
(15) Oskooi, A. F.; Roundy, D.; Ibanescu, M.; Bermel, P.; Joannopoulos, J.; Johnson, S. G.Comput. Phys. Commun.2010,181, 687−702.
(16) Hu, M.; Novo, C.; Funston, A.; Wang, H.; Staleva, H.; Zou, S.; Mulvaney, P.; Xia, Y.; Hartland, G. V.J. Mater. Chem.2008,18, 1949. (17) Boyer, D.; Tamarat, P.; Maali, A.; Lounis, B.; Orrit, M.Science 2002,297, 1160−1163.
(18) Berciaud, S.; Lasne, D.; Blab, G.; Cognet, L.; Lounis, B.Phys. Rev. B: Condens. Matter Mater. Phys.2006,73, 045424.
(19) Tcherniak, A.; Dominguez-Medina, S.; Chang, W. S.; Swanglap, P.; Slaughter, L. S.; Landes, C. F.; Link, S.J. Phys. Chem. C2011,115, 15938−15949.
(20) Fang, Y.; Chang, W.-S.; Willingham, B.; Swanglap, P.; Dominguez-Medina, S.; Link, S.ACS Nano2012,6, 7177−84.
(21) Rao, W.; Li, Q.; Wang, Y.; Li, T.; Wu, L.ACS Nano2015,9, 2783−2791.
(22) Yorulmaz, M.; Khatua, S.; Zijlstra, P.; Gaiduk, A.; Orrit, M. Nano Lett.2012,12, 4385−91.
(23) Cheng, Y.; Lu, G.; He, Y.; Shen, H.; Zhao, J.; Xia, K.; Gong, Q. Nanoscale2016,8, 2188−2194.
(24) Wang, H.; Huff, T. B.; Zweifel, D. A.; He, W.; Low, P. S.; Wei, A.; Cheng, J.-X.Proc. Natl. Acad. Sci. U. S. A.2005,102, 15752−15756. (25) Huang, X.; Jain, P. K.; El-Sayed, I. H.; El-Sayed, M. A.Lasers Med. Sci.2008,23, 217−228.
(26) Kang, B.; Afifi, M. M.; Austin, L. a.; El-Sayed, M. a.ACS Nano 2013,7, 7420−7.
(27) Hirsch, L. R.; Stafford, R. J.; Bankson, J. A.; Sershen, S. R.; Rivera, B.; Price, R. E.; Hazle, J. D.; Halas, N. J.; West, J. L.Proc. Natl. Acad. Sci. U. S. A.2003,100, 13549−54.
(28) O’Neal, D.; Hirsch, L. R.; Halas, N. J.; Payne, J.; West, J. L. Cancer Lett.2004,209, 171−176.
(29) Zhao, T.; Yu, K.; Li, L.; Zhang, T.; Guan, Z.; Gao, N.; Yuan, P.; Li, S.; Yao, S. Q.; Xu, Q.-H.; Xu, G. Q.ACS Appl. Mater. Interfaces 2014,6, 2700−2708.
(30) Donner, J. S.; Thompson, S. a.; Alonso-Ortega, C.; Morales, J.; Rico, L. G.; Santos, S. I. C. O.; Quidant, R.ACS Nano2013,7, 8666− 8672.
(31) Mooradian, A.Phys. Rev. Lett.1969,22, 185−187.
(32) Mohamed, M. B.; Volkov, V.; Link, S.; El-Sayed, M. A.Chem. Phys. Lett.2000,317, 517−523.
(33) Beversluis, M.; Bouhelier, A.; Novotny, L.Phys. Rev. B: Condens. Matter Mater. Phys.2003,68, 115433.
(34) Huang, J.; Wang, W.; Murphy, C. J.; Cahill, D. G.Proc. Natl. Acad. Sci. U. S. A.2014,111, 906−11.
(35) Hugall, J. T.; Baumberg, J. J.Nano Lett.2015,15, 2600−2604. (36) Mertens, J.; Kleemann, M.-E.; Chikkaraddy, R.; Narang, P.; Baumberg, J. J.Nano Lett.2017,17, 2568−2574.
(37) Dulkeith, E.; Niedereichholz, T.; Klar, T.; Feldmann, J.; von Plessen, G.; Gittins, D.; Mayya, K.; Caruso, F.Phys. Rev. B: Condens. Matter Mater. Phys.2004,70, 205424.
(38) Link, S.; El-Sayed, M. A.Int. Rev. Phys. Chem.2000,19, 409− 453.
(39) Orrit, M.; Kottis, P. InAdvances in Chemical Physics; Prigogine, I., Rice, S. A., Eds.; John Wiley & Sons, Inc., 1988; Chapter 1, pp 1− 253.
(40) Hodak, J. H.; Henglein, A.; Hartland, G. V.J. Chem. Phys.2000, 112, 5942−5947.
(41) Giri, A.; Gaskins, J. T.; Foley, B. M.; Cheaito, R.; Hopkins, P. E. J. Appl. Phys.2015,117, 044305.
(42) Arbouet, A.; Voisin, C.; Christofilos, D.; Langot, P.; Fatti, N. D.; Vallee, F.; Lermé , J.; Celep, G.; Cottancin, E.; Gaudry, M.; Pellarin,́ M.; Broyer, M.; Maillard, M.; Pileni, M. P.; Treguer, M.Phys. Rev. Lett. 2003,90, 177401.
(43) Carattino, A.; Keizer, V. I.; Schaaf, M. J.; Orrit, M.Biophys. J. 2016,111, 2492−2499.
(44) Link, S.; El-Sayed, M. A.J. Phys. Chem. B 1999,103, 8410− 8426.
(45) Xie, X.; Cahill, D. G.Appl. Phys. Lett.2016,109, 183104. (46) Sundararaman, R.; Narang, P.; Jermyn, A. S.; Goddard, W. A.; Atwater, H. A.Nat. Commun.2014,5, 5788.
(47) Brongersma, M. L.; Halas, N. J.; Nordlander, P. Nat. Nanotechnol.2015,10, 25−34.
(48) Manjavacas, A.; Liu, J. G.; Kulkarni, V.; Nordlander, P.ACS Nano2014,8, 7630−7638.
(49) He, Y.; Xia, K.; Lu, G.; Shen, H.; Cheng, Y.; Liu, Y.-c.; Shi, K.; Xiao, Y.-F.; Gong, Q.Nanoscale2015,7, 577−582.
(50) Krishnan, K.Nature1928,122, 650.
(51) Zondervan, R. Single-molecule dynamics at variable temper-atures. Ph.D. thesis, Casimir PhD Series, Delft-Leiden, Niels Bohrweg 2, 2333 CA Leiden, The Netherlands, 2006.
(52) Nikoobakht, B.; El-Sayed, M. A.Chem. Mater.2003,15, 1957− 1962.
(53) Liu, Y.; Mills, E. N.; Composto, R. J.J. Mater. Chem.2009,19, 2704.
(54) Konrad, A.; Wackenhut, F.; Hussels, M.; Meixner, A. J.; Brecht, M.J. Phys. Chem. C2013,117, 21476−21482.
(55) Fedoruk, M.; Meixner, M.; Carretero-Palacios, S.; Lohmuller, T.; Feldmann, J.ACS Nano2013,7, 7648−7653.
(56) Pelton, M.; Sader, J. E.; Burgin, J.; Liu, M.; Guyot-Sionnest, P.; Gosztola, D.Nat. Nanotechnol.2009,4, 492−495.
Nano Letters