Spatial Disassociation of Disrupted
Functional Connectivity for the Default Mode
Network in Patients with End-Stage Renal
Disease
Xiaofen Ma1☯, Junzhang Tian1☯, Zhanhong Wu2, Xiaopeng Zong2, Jianwei Dong3, Wenfeng Zhan1, Yikai Xu4, Zibo Li2*, Guihua Jiang1*
1Department of Medical Imaging, Guangdong Provincial No.2 People’s Hospital, Guangzhou City, Guangdong province, PR China,2Biomedical Research Imaging Center and Department of Radiology, University of North Carolina at Chapel Hill, Chapel Hill, North Carolina, United States of America, 3Department of Mathematics, Guangdong Pharmaceutical University, Guangzhou City, Guangdong province, PR China,4Department of Medical Imaging Center, Nanfang Hospital, Southern Medical University, Guangzhou City, Guangdong province, PR China
☯These authors contributed equally to this work.
*[email protected](GJ);[email protected](ZL)
Abstract
Purpose
To investigate the aberrant functional connectivity of the default mode network (DMN) in patients with end-stage renal disease (ESRD) and their clinical relevance.
Materials and Methods
Resting-state functional MRI data were collected from 31 patients with ESRD (24 men, 24– 61 years) and 31 age- and gender-matched healthy controls (HCs, 21 men, 26-61years). A whole-brain seed-based functional connectivity analysis of these collected R-fMRI data was performed by locating the seeds in the posterior cingulate cortex (PCC) and ventromedial prefrontal cortex (vmPFC) to investigate the functional connectivity of the posterior and anterior DMN over the whole brain, respectively.
Results
Compared to the HCs, the patients exhibited significantly decreased functional connectivity with the PCC in the left middle temporal gyrus, the right anterior cingulate gyrus, and the bilateral medial superior frontal gyrus. For the vmPFC seed, only the right thalamus showed significantly decreased functional connectivity in the patients with ESRD compared to HCs. Interestingly, functional connectivity between the PCC and right medial superior frontal gyrus exhibited a significantly positive correlation with the hemoglobin level in the patients. a11111
OPEN ACCESS
Citation:Ma X, Tian J, Wu Z, Zong X, Dong J, Zhan W, et al. (2016) Spatial Disassociation of Disrupted Functional Connectivity for the Default Mode Network in Patients with End-Stage Renal Disease. PLoS ONE 11(8): e0161392. doi:10.1371/journal. pone.0161392
Editor:Satoru Hayasaka, University of Texas at Austin, UNITED STATES
Received:February 14, 2016
Accepted:August 4, 2016
Published:August 25, 2016
Copyright:© 2016 Ma et al. This is an open access article distributed under the terms of theCreative Commons Attribution License, which permits unrestricted use, distribution, and reproduction in any medium, provided the original author and source are credited.
Data Availability Statement:Data are subject to ethical restrictions from the consent form for the study. The corresponding author may be contacted to request the anonymized dataset.
Funding:This work was supported by grants from National Natural Science Foundation of China (No. 81471639); The Science and Technology Planning Project of Guangdong Province, China (No. 2015A030313723).
Conclusion
Our findings suggest a spatially specific disruption of functional connectivity in the DMN in patients with ESRD, thereby providing novel insights into our understanding of the neuro-physiology mechanism that underlies the disease.
Introduction
End-stage renal disease (ESRD) is a disease characterized by multi-organ dysfunction, which typically occurs when chronic renal failure progresses to a point where the kidneys are perma-nently functioning at less than 10% of their capacity [1]. ESRD is not only accompanied with central nervous system abnormalities (e.g., white matter lesions, cerebral atrophy and myelino-clasis) [2], but also results in various neurological problems (e.g., Wernicke’s encephalopathy, uremic encephalopathy and dialysis encephalopathy) [3]. Moreover, ESRD significantly ele-vates the risk for developing cognitive impairments [4–6].
Recently, neuroimaging techniques have been used to investigate the neural mechanisms underlying ESRD-related neurological complications. For example, conventional MR imaging studies have shown that focal white matter lesions are more common in ESRD patients (56%) than in the normal population (27%) [7,8]. Based on single-photon emission computed tomog-raphy, arterial spin-labeling MR perfusion imaging and magnetic resonance spectroscopy, ESRD-related changes in cerebral metabolism and function have also been documented [9– 11]. Further evidence from diffusion tensor imaging studies indicates that ESRD is associated with widespread disruptions of white matter integrity [12–14]. These studies collectively indi-cate the disorganized brain architecture induced by ESRD.
More recently, several groups have begun to apply resting-state functional magnetic reso-nance imaging (R-fMRI), a promising technique to depict intrinsic functional connectivity net-works [15–17] to studies of ESRD [18–21]. With this technique, a consistent finding is
disrupted functional integration of the default mode network (DMN) in ESRD [18,19,21,22], based on methods of regional homogeneity, independent component analysis or nodal central-ity. It is well documented that the DMN is functionally heterogeneous with different connectiv-ity profiles between its anterior and posterior parts [23–25]. However, whether and how the anterior and posterior components of the DMN are differentially involved in ESRD are largely unknown.
In the current study, we performed a whole-brain seed-based functional connectivity analy-sis of R-fMRI data collected from 31 neurologically asymptomatic patients with ESRD to inves-tigate their functional connectivity maps of the DMN regions over the whole brain.
Specifically, the seeds were centered at the posterior cingulate cortex (PCC) and ventromedial prefrontal cortex (vmPFC), respectively, to examine spatial specificity of ESRD-related alter-ations. Finally, ESRD-related functional connectivity alterations were correlated with neuro-psychological tests and biomechanical variables of the patients.
Materials and Methods
Participants
criteria included: (1) psychiatric disorders or major neurologic disorders (e.g., severe head injury, stroke, epilepsy, dementia, anxiety, depression or visible lesions) according to an experi-enced physician (G. X., with 20-year experience in neurology); (2) ischemic diseases including acute ischemic cerebrovascular disease, acute peripheral arterial occlusion, advanced liver or heart failure; (3) asymptomatic coronary ischemia by electrocardiogram testing; (4) a history of diabetes; and (5) substance abuse including drugs, alcohol or cigarettes. Conventional MR images were examined by an experienced radiologist (W. L., with 20 years of experience in neu-ropathology), who was blinded to whether the images were from the patient or control group. Three patients were excluded due to abnormal hyper-intensities in the T2-FLAIR MR images [3]. Therefore, the final study population included 31 patients with ESRD (24 men and 7 female, mean age 39.9 ± 9.6 years, range 24–61 years).
Thirty-one age- and gender-matched HCs (all right-handed; 32 males; mean age 41.5 ± 10.6 years, range 22–58 years) were recruited from the local community. All the HCs had no physi-cal diseases or history of psychiatric or neurologic diseases.
All the participants underwent a neuropsychological test involving the mini-mental state examination (MMSE) [26], and the evaluation of systolic and diastolic blood pressure. ESRD group completed multiple biochemical tests after the hemodialysis (within 36 hours) but before the MR imaging (within 24 hours). The biochemical tests included Scr (serum creatinine), BUN (blood urea nitrogenurea), cholesterol, hemoglobin, serum kalium and serum calcium. Out of the 31 patients with ESRD, 20 (64.5%) had hypertension, and 6 (19.3%) had hyperlipid-emia. In the current study, the patients with anemia were treated with ferrous succinate or polysaccharide iron complex.
All the demographic and clinical data are summarized inTable 1.
Image acquisition
All participants were scanned on a 1.5-T MR scanner (Achieva Nova-Dual, Philips, Best, the Netherlands) in the Department of Medical Imaging center at Guangdong No. 2 Provincial
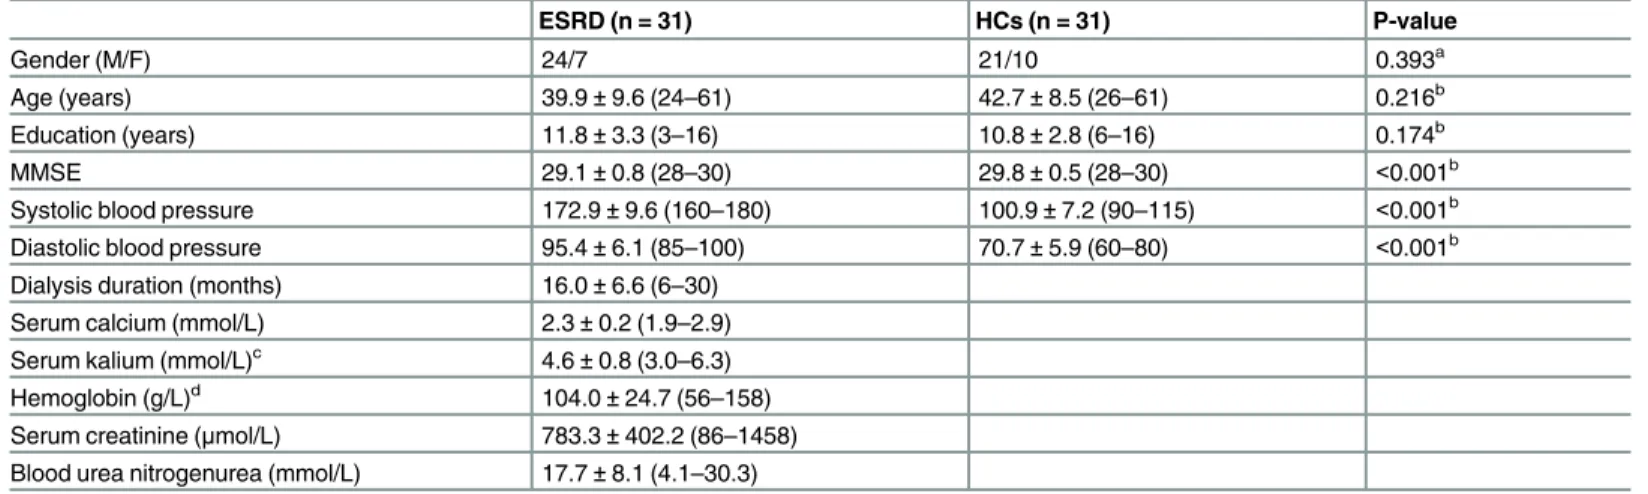
Table 1. Demographics and clinical characteristics of all participants.
ESRD (n = 31) HCs (n = 31) P-value
Gender (M/F) 24/7 21/10 0.393a
Age (years) 39.9±9.6 (24–61) 42.7±8.5 (26–61) 0.216b
Education (years) 11.8±3.3 (3–16) 10.8±2.8 (6–16) 0.174b
MMSE 29.1±0.8 (28–30) 29.8±0.5 (28–30) <0.001b
Systolic blood pressure 172.9±9.6 (160–180) 100.9±7.2 (90–115) <0.001b
Diastolic blood pressure 95.4±6.1 (85–100) 70.7±5.9 (60–80) <0.001b
Dialysis duration (months) 16.0±6.6 (6–30) Serum calcium (mmol/L) 2.3±0.2 (1.9–2.9) Serum kalium (mmol/L)c 4.6±0.8 (3.0–6.3)
Hemoglobin (g/L)d 104.0±24.7 (56–158)
Serum creatinine (μmol/L) 783.3±402.2 (86–1458) Blood urea nitrogenurea (mmol/L) 17.7±8.1 (4.1–30.3)
Values are represented as mean±SD (min—max). ESRD, end-stage renal disease; HCs, healthy controls; M, male; F, female; MMSE, the Mini-Mental Status Examination.
aThe P-value was obtained by chi-square test.
bThe P-values were obtained by two-side two-sample t tests. cData were missed for two patients.
dData were missed for three patients.
People’s Hospital. None of the subjects were taking any medications at the time of the scans. The conventional imaging sequences, including T1-weighted images and T2-FLAIR images, were obtained for each participant to detect clinically silent lesions. During the R-fMRI data scanning, the participants were asked to lie quietly with their eyes closed and to not think of anything specific while in the scanner. The scan lasted 8 minutes, and 160 volumes were obtained for each participant. The R-fMRI acquisition parameters were as follows: 33 axial slices; repetition time (TR) = 3,000 ms; echo time (TE) = 50 ms; flip angle = 90°; slice thick-ness = 4.5 mm; no gap; matrix = 128 × 128 and field of view (FOV) = 230 × 230 mm2. After scanning, all the participants were asked questions to verify the degree of their cooperation. Additionally, individual high-resolution anatomical images were also acquired using a
T1-weighted three-dimensional volumetric magnetization-prepared rapidly acquired gradient-echo sequence: 160 axial slices; TR = 25 ms; TE = 4.1 ms; FA = 30°; slice thickness = 1.0 mm; no gap; matrix = 256 × 256; and FOV = 230 × 230 mm2.
Image preprocessing
Data preprocessing was performed using the SPM12 package (http://www.fil.ion.ucl.ac.uk/spm/ software/spm12/) and GRETNA package [27], including i) removal of the first five volumes to allow T1 equilibration effects; ii) realignment to correct for spatial displacements due to head motion; iii) co-registration to structural images; iv) spatial normalization into the Montreal Neu-rological Institute space by applying deformation filed derived from tissue segmentation of struc-tural images; v) spatial smoothing (Gaussian kernel of 6-mm full width at half maximum); vi) removal of linear trend; vii) temporal band-pass filtering (0.01–0.1 Hz); and viii) regression of sev-eral nuisance signals of white matter signal, cerebrospinal fluid signal and head-motion profiles.
Recent studies have highlighted residual head-motion effects on intrinsic functional connec-tivity [15,28]. In the current study, we first excluded participants with head motion>3 mm of displacement or>3 degree of rotation in any direction. Then, we examined both gross (i.e., max-imum and root mean square) and micro (mean frame-wise displacement) head-motion sum-mary measures and found no significant between-group differences (allPs>0.05). Furthermore, we employed a 24-parameter instead of 6-parameter head-motion model during the regression of nuisance signals [29], an efficiency strategy to control for head motion effects [30]. Finally, we treated all the summary head-motion measures as covariates at the group-level comparisons [31]. After these efforts, we believe that head-motion effects were mitigated as much as possible for the current data. Of note, how to attenuate head-motion effects is an ongoing topic of research, and there are other alternative strategies to deal with this issue [32,33].
Seed-based functional connectivity
Although typically regarded as a homogenous network, the DMN is functionally heteroge-neous, with particularly striking differences in connectivity patterns between the anterior and posterior DMN [23]. Thus, in the current study, we studied functional connectivity of both anterior and posterior DMN by locating the seeds in the PCC (Talairach coordinates = [–2–51 27]) and vmPFC (Talairach coordinates [2 54–3]), respectively [23]. Their counterparts in the MNI space converted according to [34] were then used as centers to generate two spherical regions of interest (ROIs) with radius = 6 mm. For each participant, a reference time series was then obtained for each ROI by averaging all the voxels’time series within it. The resulting refer-ence time series were further correlated with the time series over the entire brain in a voxel-wise manner, thereby generating two functional connectivity maps individually. Finally, a Fish-er’s r-to-z transformation was applied to the resulting whole-brain correlation maps to
Statistical analysis
Functional connectivity map and between-group difference. For each group, a random-effect one-sample t-test was performed in a voxel-wise manner to determine regions that showed functional connectivity with the seeds (i.e., PCC and vmPFC). A random field theory as performed in the SPM toolbox was used to account for the multiple comparison issue (P<0.05, corrected, cluster size>10 voxels). To further identify regions whose functional connectivity with the seeds differed between the ESRD and HC groups, a voxel-wise multiple general linear model was implemented with age, gender, education and summary head-motion measures as covariates. To correct for the multiple comparison issue, the Alpha-Sim procedure [35] was implemented in the REST by combining the height threshold ofP<0.001 [36] and extent threshold ofP<0.05, which corresponded to a correctedP<0.05. All the results were mapped onto the cortical surfaces for visualization using the BrainNet Viewer package [37].
Brain-behavior relationship. For each region showing significantly different functional connectivity between the ESRD and HC controls, the Pearson correlation coefficient was calcu-lated to assess the relationship between mean function connectivity strength of the region (after Fisher’s r-to-z transformation) and clinical variables (dialysis duration, calcium level, kalium level, hemoglobin level, creatinine level and urea level) in the patient group.
Results
Demographic and clinical characteristics
The demographic, biochemical and clinical characteristics for all the participants are shown in
Table 1. There were no significant differences in gender (P= 0.393), age (P= 0.216) or educa-tion level (P= 0.174) between the ESRD and HC groups. Compared with the HCs, the ESRD patients had significantly higher systolic and diastolic blood pressure values and lower MMSE scores (P<0.001). The mean duration of hemodialysis for the patient group was 16.0 ± 6.6 months. The mean calcium, kalium, hemoglobin, creatinine, and urea levels for the patients were 2.3 ± 0.2 mmol/L, 4.6 ± 0.8 mmol/L, 104.0 ± 24.7g/L, 783.3 ± 402.2μmol/L and 17.7 ± 8.1 mmol/L, respectively. Notably, the serum calcium levels were corrected with serum albumin levels using the Payne's formula [38].
Functional connectivity maps
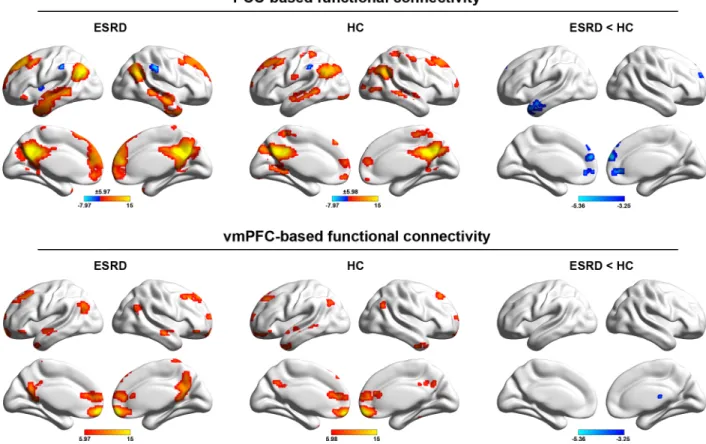
Fig 1shows the DMN functional connectivity patterns for the ESRD and HC groups and between-group differences. Overall, our PCC-based and vmPFC-based functional connectivity analyses largely replicated numerous previous studies of the DMN topography that predomi-nantly embraced the medial prefrontal cortex, dorsolateral prefrontal cortex, lateral temporal cortex, and post-medial parietal cortex. We also note that PCC-based functional connectivity analysis revealed a spatially more extensive DMN pattern relative to the vmPFC.
Compared with the HC, four clusters were found to show significantly decreased functional connectivity with the PCC in the patients with ESRD, involving the left middle temporal gyrus, the right anterior cingulate gyrus, and the bilateral medial superior frontal gyri. For the vmPFC seed, only the right thalamus showed significantly decreased functional connectivity in patients with ESRD compared to HCs (Fig 1).
Relationship between DMN functional connectivity and clinical variables
did not correlate ESRD-related functional connectivity alterations with the MMSE scores in the patients due to the narrow range distribution of the values (28–30).
Reproducibility analyses
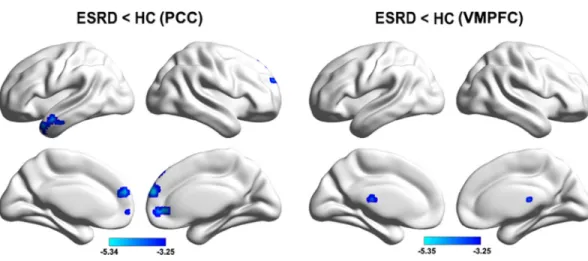
In the current study, we noted that two patients had very low hemoglobin values (56 g/L and 59 g/L), suggesting severe anemia. Therefore, we reanalyzed our data after excluding these two patients to test the extent to which our main findings were affected. We found that the results were largely preserved for both whole-brain functional connectivity differences (Fig 3) and MRI-clinical correlations (r = 0.590,P= 0.002). In addition, for the ESRD patients included in the cur-rent study, 20 (64.5%) had hypertension and 6 (19.3%) had hyperlipidemia. Thus, we further compared the functional connectivity between the ESRD patients with hypertension/hyperlipid-emia and those without hypertension/hyperlipidhypertension/hyperlipid-emia for each cluster that exhibited functional connectivity differences between the ESRD and HC groups. No significant differences were found for any cluster (P>0.05). Furthermore, we performed a voxel-wise comparison of whole-brain functional connectivity between the ESRD patients with hypertension/hyperlipidemia and those without hypertension/ hyperlipidemia. Again, no significant differences were observed (P>0.05, corrected with the Alpha-Sim procedure). All these reproducibility analyses indicate little effects of anemia, hypertension and hyperlipidemia on the reported results.
Discussion
This study employed R-fMRI to evaluate the DMN functional connectivity in patients with ESRD. Although typically regarded as a homogenous network, accumulating evidence
Fig 1. Within-group DMN patterns and between-group differences.The color bars represent the T scores. The results were mapped onto the brain surface using the BrainNet viewer software.
indicates functional heterogeneity within the DMN. Specifically, evidence from task-based acti-vation studies shows that the anterior vmPFC and posterior PCC, two key nodes within the DMN, act independently across a wide array of cognitive tasks. Moreover, functional
Fig 2. Scatter plot of the relationship between the PCC-right medial superior frontal gyrus functional connectivity and hemoglobin levels in the patients.
doi:10.1371/journal.pone.0161392.g002
Fig 3. Between-group functional connectivity differences after excluding two patients with anemia.
connectivity studies from both resting state and cognitive tasks reveal different connectivity patters between the vmPFC and PCC [23–25]. The anterior-posterior functional dissociation within the DMN implies differences in their interactions with other networks and highlights the need for researchers to treat them individually. In response, we examined both anterior and posterior DMN functional connectivity in ESRD by seeding the ROIs in the PCC and vmPFC, respectively. We found that patients with ESRD mainly exhibited decreased within-DMN func-tional connectivity when the seed was located in the PCC while decreased frontal-subcortical functional connectivity was determined when the seed was located in the vmPFC. These find-ings provide new insights into our understanding of neural abnormalities in ESRD.
We found that compared with HCs, patients with ESRD showed decreased functional con-nectivity in the anterior cingulate cortex, middle temporal gyrus and medial superior frontal cortex when the seed was located in the PCC. These structures are typical DMN components, suggesting decreased within-DMN functional integration in ESRD. This is consistent with pre-vious R-fMRI studies based on regional homogeneity [18] and independent component analy-sis methods [19] in ESRD. Using MR spectroscopy [11,39], diffusion-tensor imaging [14], and voxel-based morphometry [10], many previous studies have demonstrated ESRD-related abnormalities in brain biochemistry and structure of multiple DMN regions. These abnormali-ties may be the possible biochemical and/or structural basis for the disrupted DMN functional connectivity observed here. Functionally, the DMN is engaged in a broad array of cognitive processing related to self-awareness, episodic memory, and interactive modulation between the internal brain activities and external tasks [40,41]. Before any overt neurological manifestation, patients with ESRD often develop various cognitive deficits involving attention, processing speed [42], executive function [4], and memory [43]. Thus, we speculated that the decreased within-DMN functional integration might in part underlie these cognitive disturbances in ESRD. Future follow-up studies are required to provide more complete neuropsychological test of ESRD to find the real relation between the neuropsychological test in ESRD patients and DMN.
Interestingly, we found a positive correlation between PCC-medial superior frontal gyrus function connectivity and the hemoglobin levels in patients with ESRD. Previous studies have shown that long-term hemodialysis could lead to cerebral abnormalities of oxygenation [10] and cerebral blood flow in ESRD [44–46], which could significantly affect the brain function and cerebral circulation [47–50]. Recent studies have highlighted important roles of cerebral blood flow and metabolism in establishing and retaining interregional functional coordination in the brain [51,52]. Given previous findings that low hemoglobin is associated with poor men-tal health in ESRD [46,53,54], further insights into this issue could benefit from simultaneously recording MR spectroscopy, ASL perfusion, R-fMRI, and neuropsychological data of the same cohort of patients in future.
which ultimately contribute to the susceptibility of ESRD patients to develop depression. If this deduction holds true, an interesting future topic is to test whether cognitive training that can enhance the thalamic and DMN functional connectivity may improve cognitive function in patients with ESRD. However, there is another possibility that the current patients may be complicated by depression, which further leads to the observed functional connectivity decrease between the vmPFC and thalamus. Future studies are needed to clarify this issue.
Limitations
First, the sample size was relatively small and the MRI scanning parameters were suboptimal (e.g., 1.5T scanner and anisotropic voxels) for the current dataset. However, our previous stud-ies based on this dataset consistently demonstrate ESRD-related functional connectivity dis-ruptions of the DMN [21,22], which are largely comparable with studies utilizing optimal imaging parameters on 3T MRI scanners [18,19]. This implies the validity of the current data-set to study functional connectivity of the DMN in ESRD. Nevertheless, we want to emphasize that future studies with a large cohort of participants are needed to examine the reproducibility of our findings using more advanced techniques and optimized parameters. Second, due to the cross-sectional design of the current study, we cannot address how the DMN functional con-nectivity changes dynamically in response to the progression of chronic kidney disease (CKD). Thus, future longitudinal studies addressing DMN functional connectivity and changes in neuropsychological tests in CKD patients with different degrees of kidney function may pro-vide further insight on the time course of alterations in brain functional connectivity and neuropsychological behavior as kidney function deteriorates. Third, consistent with a recent R-fMRI study [19], several comorbidities associated with ESRD (e.g., anemia, hypertension and hyperlipidemia) existed for the patients in the current study. Therefore, it is likely that the observed DMN function connectivity abnormalities are a common consequence of both ESRD and these comorbidities. Although our exploratory analyses revealed non-significant effects of these factors on our results, it may be due to the small sample size. Given the influences of these factors on BOLD signals [63,64], it is an interesting topic in the future to systematically investigate how these factors impact functional networks of the brain. Additionally, it should be noted that there are still other factors that may contribute to the current findings given the end stage of the disease, such as depression, a common complication in ESRD. However, the current samples did not undergo neuropsychological tests for these psychological disorders, thus our findings should be interpreted with caution. Finally, we did not collect clinical infor-mation such as hematocrit, mean hemodialysis session duration and prevalence of intradialytic hypotension for the patients, limiting us to examine how ESRD-related functional connectivity alterations are related to these specific clinical variables in the patients. Future studies can address these important issues by using more rigorous experimental design and stricter enroll-ment criteria. Finally, accumulating evidence suggests that the DMN functional connectivity reflects underlying structural pathways [59,60]. Therefore, it would be interesting to study whether the disrupted DMN functional connectivity observed here has a structural substrate.
Conclusion
Acknowledgments
We thank all the patients and volunteers for participating in this study. This work was sup-ported by grants from National Natural Science Foundation of China (No. 81471639); The Sci-ence and Technology Planning Project of Guangdong Province, China (No. 2015A030313723).
Author Contributions
Formal analysis:XM JD.
Funding acquisition:GJ.
Investigation:YX.
Methodology:XM GJ JD WZ JT XZ.
Project administration:XM JT ZW.
Software:XM GJ JD WZ JT XZ.
Supervision:GJ ZL.
Writing–original draft:XM.
References
1. Foley RN, Collins AJ (2007) End-stage renal disease in the United States: an update from the United States Renal Data System. J Am Soc Nephrol 18: 2644–2648. PMID:17656472
2. De Deyn PP, Saxena VK, Abts H, Borggreve F, D'Hooge R, Marescau B, et al. (1992) Clinical and pathophysiological aspects of neurological complications in renal failure. Acta Neurol Belg 92: 191– 206. PMID:1332359
3. Brouns R, De Deyn PP (2004) Neurological complications in renal failure: a review. Clin Neurol Neuro-surg 107: 1–16. PMID:15567546
4. Kurella M, Chertow GM, Luan J, Yaffe K (2004) Cognitive impairment in chronic kidney disease. J Am Geriatr Soc 52: 1863–1869. PMID:15507063
5. Murray AM, Tupper DE, Knopman DS, Gilbertson DT, Pederson SL, Li S, et al. (2006) Cognitive impairment in hemodialysis patients is common. Neurology 67: 216–223. PMID:16864811
6. Kurella Tamura M, Yaffe K (2011) Dementia and cognitive impairment in ESRD: diagnostic and thera-peutic strategies. Kidney Int 79: 14–22. doi:10.1038/ki.2010.336PMID:20861818
7. Agildere AM, Kurt A, Yildirim T, Benli S, Altinors N (2001) MRI of neurologic complications in end-stage renal failure patients on hemodialysis: pictorial review. Eur Radiol 11: 1063–1069. PMID:11419154
8. Martinez-Vea A, Salvado E, Bardaji A, Gutierrez C, Ramos A, García C, et al. (2006) Silent cerebral white matter lesions and their relationship with vascular risk factors in middle-aged predialysis patients with CKD. Am J Kidney Dis 47: 241–250. PMID:16431253
9. Fazekas G, Fazekas F, Schmidt R, Kapeller P, Offenbacher H, Krejs G (1995) Brain MRI findings and cognitive impairment in patients undergoing chronic hemodialysis treatment. J Neurol Sci 134: 83–88. PMID:8747848
10. Prohovnik I, Post J, Uribarri J, Lee H, Sandu O, Langhoff E (2007) Cerebrovascular effects of hemodial-ysis in chronic kidney disease. J Cereb Blood Flow Metab 27: 1861–1869. PMID:17406658
11. Tryc AB, Alwan G, Bokemeyer M, Goldbecker A, Hecker H, Haubitz M (2011) Cerebral metabolic alter-ations and cognitive dysfunction in chronic kidney disease. Nephrol Dial Transplant 26: 2635–2641. doi:10.1093/ndt/gfq729PMID:21216887
12. Hsieh TJ, Chang JM, Chuang HY, Ko CH, Hsieh ML, Liu GC, et al. (2009) End-stage renal disease: in vivo diffusion-tensor imaging of silent white matter damage. Radiology 252: 518–525. doi:10.1148/ radiol.2523080484PMID:19528357
14. Kim HS, Park JW, Bai DS, Jeong JY, Hong JH, Son SM, et al. (2011) Diffusion tensor imaging findings in neurologically asymptomatic patients with end stage renal disease. NeuroRehabilitation 29: 111– 116. doi:10.3233/NRE-2011-0684PMID:21876303
15. Van Dijk KR, Hedden T, Venkataraman A, Evans KC, Lazar SW, Buckner RL (2010) Intrinsic functional connectivity as a tool for human connectomics: theory, properties, and optimization. J Neurophysiol 103: 297–321. doi:10.1152/jn.00783.2009PMID:19889849
16. Wang J, Zuo X, He Y (2010) Graph-based network analysis of resting-state functional MRI. Front Syst Neurosci 4: 16. doi:10.3389/fnsys.2010.00016PMID:20589099
17. Biswal B, Yetkin FZ, Haughton VM, Hyde JS (1995) Functional connectivity in the motor cortex of rest-ing human brain usrest-ing echo-planar MRI. Magn Reson Med 34: 537–541. PMID:8524021
18. Liang X, Wen J, Ni L, Zhong J, Qi R, Zhang LJ, et al. (2013) Altered pattern of spontaneous brain activity in the patients with end-stage renal disease: a resting-state functional MRI study with regional homoge-neity analysis. PLoS One 8: e71507. doi:10.1371/journal.pone.0071507PMID:23990958
19. Ni L, Wen J, Zhang LJ, Zhu T, Qi R, Xu Q, et al. (2014) Aberrant default-mode functional connectivity in patients with end-stage renal disease: a resting-state functional MR imaging study. Radiology 271: 543–552. doi:10.1148/radiol.13130816PMID:24484062
20. Qiu Y, Lv X, Su H, Jiang G, Li C, Tian J (2014) Structural and functional brain alterations in end stage renal disease patients on routine hemodialysis: a voxel-based morphometry and resting state functional connectivity study. PLoS One 9: e98346. doi:10.1371/journal.pone.0098346PMID:24854737
21. Ma X, Jiang G, Li S, Wang J, Zhan W, Zeng S, et al. (2015) Aberrant functional connectome in neuro-logically asymptomatic patients with end-stage renal disease. PLoS One 10: e0121085. doi:10.1371/ journal.pone.0121085PMID:25786231
22. Li S, Ma X, Huang R, Li M, Tian J, Wen H, et al. (2016) Abnormal degree centrality in neurologically asymptomatic patients with end-stage renal disease: A resting-state fMRI study. Clin Neurophysiol 127: 602–609. doi:10.1016/j.clinph.2015.06.022PMID:26160274
23. Uddin LQ, Kelly AM, Biswal BB, Castellanos FX, Milham MP (2009) Functional connectivity of default mode network components: correlation, anticorrelation, and causality. Hum Brain Mapp 30: 625–637. doi:10.1002/hbm.20531PMID:18219617
24. Mitchell JP, Heatherton TF, Macrae CN (2002) Distinct neural systems subserve person and object knowledge. Proc Natl Acad Sci U S A 99: 15238–15243. PMID:12417766
25. Cavanna AE, Trimble MR (2006) The precuneus: a review of its functional anatomy and behavioural correlates. Brain 129: 564–583. PMID:16399806
26. Schultz-Larsen K, Lomholt RK, Kreiner S (2007) Mini-Mental Status Examination: a short form of MMSE was as accurate as the original MMSE in predicting dementia. J Clin Epidemiol 60: 260–267. PMID:17292020
27. Wang J, Wang X, Xia M, Liao X, Evans A, He Y (2015) GRETNA: a graph theoretical network analysis toolbox for imaging connectomics. Front Hum Neurosci 9: 386. doi:10.3389/fnhum.2015.00386PMID:
26175682
28. Power JD, Barnes KA, Snyder AZ, Schlaggar BL, Petersen SE (2012) Spurious but systematic correla-tions in functional connectivity MRI networks arise from subject motion. Neuroimage 59: 2142–2154. doi:10.1016/j.neuroimage.2011.10.018PMID:22019881
29. Friston KJ, Holmes A, Poline JB, Price CJ, Frith CD (1996) Detecting activations in PET and fMRI: lev-els of inference and power. Neuroimage 4: 223–235. PMID:9345513
30. Yan CG, Craddock RC, He Y, Milham MP (2013) Addressing head motion dependencies for small-world topologies in functional connectomics. Front Hum Neurosci 7: 910. doi:10.3389/fnhum.2013. 00910PMID:24421764
31. Fair DA, Nigg JT, Iyer S, Bathula D, Mills KL, Dosenbach NU, et al. (2012) Distinct neural signatures detected for ADHD subtypes after controlling for micro-movements in resting state functional connectiv-ity MRI data. Front Syst Neurosci 6: 80. doi:10.3389/fnsys.2012.00080PMID:23382713
32. Muschelli J, Nebel MB, Caffo BS, Barber AD, Pekar JJ, Mostofsky SH (2014) Reduction of motion-related artifacts in resting state fMRI using aCompCor. Neuroimage 96: 22–35. doi:10.1016/j. neuroimage.2014.03.028PMID:24657780
33. Patel AX, Kundu P, Rubinov M, Jones PS, Vertes PE, Ersche KD, et al. (2014) A wavelet method for modeling and despiking motion artifacts from resting-state fMRI time series. Neuroimage 95: 287–304. doi:10.1016/j.neuroimage.2014.03.012PMID:24657353
35. Ledberg A, Akerman S, Roland PE (1998) Estimation of the probabilities of 3D clusters in functional brain images. Neuroimage 8: 113–128. PMID:9740755
36. Woo CW, Krishnan A, Wager TD (2014) Cluster-extent based thresholding in fMRI analyses: pitfalls and recommendations. Neuroimage 91: 412–419. doi:10.1016/j.neuroimage.2013.12.058PMID:
24412399
37. Xia M, Wang J, He Y (2013) BrainNet Viewer: a network visualization tool for human brain connec-tomics. PLoS One 8: e68910. doi:10.1371/journal.pone.0068910PMID:23861951
38. Payne RB, Little AJ, Williams RB, Milner JR (1973) Interpretation of serum calcium in patients with abnormal serum proteins. Br Med J 4: 643–646. PMID:4758544
39. Chiu ML, Li CW, Chang JM, Chiang IC, Ko CH, Chuang HY, et al. (2010) Cerebral metabolic changes in neurologically presymptomatic patients undergoing haemodialysis: in vivo proton MR spectroscopic findings. Eur Radiol 20: 1502–1507. doi:10.1007/s00330-009-1673-2PMID:19997847
40. Buckner RL, Andrews-Hanna JR, Schacter DL (2008) The brain's default network: anatomy, function, and relevance to disease. Ann N Y Acad Sci 1124: 1–38. doi:10.1196/annals.1440.011PMID:
18400922
41. Fox MD, Snyder AZ, Vincent JL, Corbetta M, Van Essen DC, Raichle ME (2005) The human brain is intrinsically organized into dynamic, anticorrelated functional networks. Proc Natl Acad Sci U S A 102: 9673–9678. PMID:15976020
42. Jassal SV, Roscoe J, LeBlanc D, Devins GM, Rourke S (2008) Differential impairment of psychomotor efficiency and processing speed in patients with chronic kidney disease. Int Urol Nephrol 40: 849–854. doi:10.1007/s11255-008-9375-2PMID:18443915
43. Williams MA, Sklar AH, Burright RG, Donovick PJ (2004) Temporal effects of dialysis on cognitive func-tioning in patients with ESRD. Am J Kidney Dis 43: 705–711. PMID:15042548
44. Holzer H, Marguc K, Pogglitsch H, Ott E, Katschnig H (1981) The effects of haemodialysis on cerebral blood flow. Proc Eur Dial Transplant Assoc 18: 126–132. PMID:7329959
45. Stefanidis I, Bach R, Mertens PR, Liakopoulos V, Liapi G, Mann H, et al. (2005) Influence of hemodialy-sis on the mean blood flow velocity in the middle cerebral artery. Clin Nephrol 64: 129–137. PMID:
16114789
46. Regolisti G, Maggiore U, Cademartiri C, Cabassi A, Caiazza A, Morabito S, et al. (2013) Cerebral blood flow decreases during intermittent hemodialysis in patients with acute kidney injury, but not in patients with end-stage renal disease. Nephrol Dial Transplant 28: 79–85. doi:10.1093/ndt/gfs182PMID:
22711517
47. Gottlieb D, Mildworf B, Rubinger D, Melamed E (1987) The regional cerebral blood flow in patients under chronic hemodialytic treatment. J Cereb Blood Flow Metab 7: 659–661. PMID:3654805
48. Lindegaard KF, Lundar T, Wiberg J, Sjoberg D, Aaslid R, Nornes H (1987) Variations in middle cerebral artery blood flow investigated with noninvasive transcranial blood velocity measurements. Stroke 18: 1025–1030. PMID:2961104
49. Postiglione A, Faccenda F, Gallotta G, Rubba P, Federico S (1991) Changes in middle cerebral artery blood velocity in uremic patients after hemodialysis. Stroke 22: 1508–1511. PMID:1962325
50. Hata R, Matsumoto M, Handa N, Terakawa H, Sugitani Y, Kamada T (1994) Effects of hemodialysis on cerebral circulation evaluated by transcranial Doppler ultrasonography. Stroke 25: 408–412. PMID:
7905681
51. Liang X, Zou Q, He Y, Yang Y (2013) Coupling of functional connectivity and regional cerebral blood flow reveals a physiological basis for network hubs of the human brain. Proc Natl Acad Sci U S A 110: 1929–1934. doi:10.1073/pnas.1214900110PMID:23319644
52. Tomasi D, Wang GJ, Volkow ND (2013) Energetic cost of brain functional connectivity. Proc Natl Acad Sci U S A 110: 13642–13647. doi:10.1073/pnas.1303346110PMID:23898179
53. Bornivelli C, Aperis G, Giannikouris I, Paliouras C, Alivanis P (2012) Relationship between depression, clinical and biochemical parameters in patients undergoing haemodialysis. J Ren Care 38: 93–97. doi:
10.1111/j.1755-6686.2012.00259.xPMID:22429274
54. Kalender B, Ozdemir AC, Koroglu G (2006) Association of depression with markers of nutrition and inflammation in chronic kidney disease and end-stage renal disease. Nephron Clin Pract 102: c115– 121. PMID:16282695
55. Myers-Schulz B, Koenigs M (2012) Functional anatomy of ventromedial prefrontal cortex: implications for mood and anxiety disorders. Mol Psychiatry 17: 132–141. doi:10.1038/mp.2011.88PMID:
21788943
56. Motzkin JC, Philippi CL, Oler JA, Kalin NH, Baskaya MK, Koenigs M (2015) Ventromedial prefrontal cortex damage alters resting blood flow to the bed nucleus of stria terminalis. Cortex 64: 281–288. doi:
57. Greicius MD, Flores BH, Menon V, Glover GH, Solvason HB, Kenna H, et al. (2007) Resting-state func-tional connectivity in major depression: abnormally increased contributions from subgenual cingulate cortex and thalamus. Biol Psychiatry 62: 429–437. PMID:17210143
58. Korgaonkar MS, Fornito A, Williams LM, Grieve SM (2014) Abnormal structural networks characterize major depressive disorder: a connectome analysis. Biol Psychiatry 76: 567–574. doi:10.1016/j. biopsych.2014.02.018PMID:24690111
59. Spencer SJ, Fox JC, Day TA (2004) Thalamic paraventricular nucleus lesions facilitate central amyg-dala neuronal responses to acute psychological stress. Brain Res 997: 234–237. PMID:14706875
60. Chastrette N, Pfaff DW, Gibbs RB (1991) Effects of daytime and nighttime stress on Fos-like immunore-activity in the paraventricular nucleus of the hypothalamus, the habenula, and the posterior paraventri-cular nucleus of the thalamus. Brain Res 563: 339–344. PMID:1786549
61. Penzo MA, Robert V, Tucciarone J, De Bundel D, Wang M, Van Aelst L, et al. (2015) The paraventricu-lar thalamus controls a central amygdala fear circuit. Nature.
62. Kimmel PL, Cukor D, Cohen SD, Peterson RA (2007) Depression in end-stage renal disease patients: a critical review. Adv Chronic Kidney Dis 14: 328–334. PMID:17904499
63. Son SJ, Kim J, Lee E, Park JY, Namkoong K, Hong CH, et al. (2015) Effect of hypertension on the rest-ing-state functional connectivity in patients with Alzheimer's disease (AD). Arch Gerontol Geriatr 60: 210–216. doi:10.1016/j.archger.2014.09.012PMID:25307953