ISSN: 2147-611X
www.ijemst.com
Development of STEM Attitude Scale for
Secondary School Students: Validity and
Reliability Study
Ibrahim Benek, Behiye Akcay Istanbul University-Cerrahpaşa
To cite this article:
Benek, I. & Akcay, B. (2019). Development of STEM attitude scale for secondary school
students: Validity and reliability study.
International Journal of Education in Mathematics,
Science and Technology (IJEMST), 7
(1), 32-52. DOI:10.18404/ijemst.509258
This article may be used for research, teaching, and private study purposes.
Any substantial or systematic reproduction, redistribution, reselling, loan, sub-licensing,
systematic supply, or distribution in any form to anyone is expressly forbidden.
Authors alone are responsible for the contents of their articles. The journal owns the
copyright of the articles.
Volume 7, Number 1, 2019
DOI:10.18404/ijemst.509258
Development of STEM Attitude Scale for Secondary School Students:
Validity and Reliability Study
Ibrahim Benek, Behiye Akcay
Article Info
Abstract
Article HistoryReceived:
08 September 2018
The aim of this study is to develop a valid and reliable attitude scale that could measure secondary school students' attitudes towards the Science-Technology-Engineering and Mathematics (STEM). This study was conducted in 2017-2018 academic year with 2500 secondary school students studying in the 5th, 6th, 7th and 8th grades from fifteen (15) different secondary schools in ten different (10) provinces of seven (7) different regions of Turkey. The study is designed according to the scanning method which is a descriptive research method. When determining the sample of the research, stratified sampling method was taken into consideration. Explanatory Factor Analysis (EFA) and Confirmatory Factor Analysis (CFA) were performed to test the validity of the scale structure. KMO in EFA .919, and the Barlett’s test χ2 value was found as 26236,010 (p <.001). As a result of CFA to determine the model fit of the scale, chi-square fit value of the factor structure consisting of 33 items and 6 sub-factors (χ ² = 4083.21, Sd = 480, p = 00) was found to be significant and the following was found RMSEA: .0548, RMR: .0486, SRMR: .0486, GFI: .902, AGFI: .885, IFI: .902, NFI: .890, NNFI: .892 and CFI: .902. Since all fit values are within acceptable limits, it is concluded that the six-factor structure of scale is a usable, valid model. Internal consistency and test-retest reliability analyzes were performed to determine the reliability of the scale. As a result, the Cronbach Alpha (α) internal consistency reliability value of the scale was found as 0.887 and the test-retest reliability value was found as 0.804. Based on this, the scale can be said to be highly reliable. It is concluded that the scale consisting of 33 items and six factors is a valid and reliable tool which determines middle school students’ attitudes toward STEM.
Accepted: 16 December 2018
Keywords
STEM Scale Validity Reliability
Introduction
STEM (Science, Technology, Engineering and Mathematics) Education
The countries aim to raise qualified manpower to be able to compete internationally, to follow the fast developments in science and technology more closely and to ensure the economic growth and development. Hence, the countries that aim to raise qualified people are undoubtedly aware of the prominence of science and mathematics disciplines. The theoretical knowledge in science and mathematics is transformed into real-life applications in technology and engineering, thus providing solutions to current problems and future problems of the people (National Research Council [NRC], 2012; Next Generations Science Standards [NGGS], 2013). Some countries, such as the United States and the United Kingdom, emphasized the significance of including this field into the school curriculum and founding the science education on the engineering design since the basic knowledge on Engineering, Science and Mathematics can be applied in real life (Brunsell, 2012; Çavaş, Bulut, Holbrook & Rannikmae, 2013; Guzey, Tank, Wang, Roehrig & Moore, 2014; NAE & NRC, 2009; NGGS, 2013; NRC, 2012; Sungur-Gül & Marulcu, 2014).
Science, Technology, Engineering and Mathematics (STEM) (Gomez & Albrecht, 2014) education, which builds a connection between business and education, is a method to integrate science, technology, engineering, and mathematics and to transform the theoretical knowledge into practice (Akgündüz et al., 2015). STEM education became more important in recent years, as the STEM aims to raise an innovative generation that is competent enough to find solutions suitable for the problem and that can think systematically, and as STEM defends an interdisciplinary approach and a science education based on the design (Bybee, 2010; Brophy et al., 2008; Çavaş, Bulut, Holbrook & Rannikmae, 2013; Çorlu, 2012; Dugger, 2010; Douglas, Iversen & Kalyandurg, 2004; Guzey et al., 2014; Machi, 2009; NAE & NRC, 2009; NRC, 2012; NGGS, 2013; Rogers & Porstmore, 2004; Smith & Karr-Kidwell, 2000). In fact, as mentioned earlier, countries reformed their education systems in accordance with the objectives to raise qualified manpower and economic growth and these reforms have been implemented by introducing STEM education, based on the integration of these four fields (Bybee, 2010; Corlu, 2014; Lacey & Wright, 2009; Sanders, 2009).
STEM education, which became important in the 21st century, integrates science, mathematics, technology, and engineering skills together, and aims to raise individuals that are a critical thinker, entrepreneur; can solve creative problems; can work in cooperation; that have the innovation and research capability; that can examine and design a product (Baran, Canbazoğlu-Bilici & Mesutoğlu, 2015; Bybee, 2010; NRC, 2014; Roberts, 2012; Şahin, Ayar & Adıgüzel, 2014; Wagner, 2008). In addition, it aims to direct students to these fields by including STEM in all educational levels from kindergarten to university (Gonzales & Kuenzi, 2012).
Recently, some studies have been carried out in our country about the significance of STEM education. In 2015, Istanbul Aydin University published a report called "STEM Turkey Report: Is it today's fashion or is it a necessity?" and in 2016, Ministry of Education General Directorate of Innovation and Education Technologies published the "STEM Education Report". Ministry of Education (MEB) shared the updated draft curriculum of 51 programs with the public on February 13, 2017, for not remaining behind to include STEM education into the education program and the "Applied Science" education took place for the first time in the science curriculum. In these learning areas, a chapter called "Science and Engineering Applications", was organized in accordance with the STEM education, as the last chapter of each course from the 4th to the 8th grade. About the field of "Science and Engineering Applications", MEB aims to make students understand the world by using scientific processes and to understand how scientific knowledge develops by making researches (MEB, 2017, p.7). According to MEB (2017);
Engineering includes the systematic practices that are open to improvement in order to design objects, process, and system for fulfilling the needs and wishes of the human. On the other hand, technology is the transformation of the natural world to fulfill human needs and wishes. These practices help students to establish the connection between engineering and science, to comprehend the interdisciplinary interaction, and to improve their perspectives on the world by using the knowledge in the real life" (p.7).
In fact, MEB asserts that science and engineering practices, namely STEM education, are essential in order to improve the scientific research, technology, social and economic fields in Turkey and increase the competitive power of Turkey (MEB, 2017, p.7).
When the literature is reviewed, it is observed the STEM education focuses on the success of the students (Biçer et al., 2015; Ceylan, 2014; Irkıçatal, 2016; Öner & Capraro, 2016; Yıldırım & Altun, 2015), the training of the teacher and the teachers' opinions in this field (Autenrieth, 2017; Hacıoğlu et al., 2016; Han et al., 2015; Jho et al., 2016; Weber et al., 2013; Wilson, 2013), the professional development of prospective teachers and their perspectives on this field (Aslan-Tutak et al., 2017; Gupta, 2015; Kızılay, 2016; Marulcu & Sungur, 2012; Sungur-Gül & Marulcu, 2014; Özçakır-Sümen & Çalışıcı, 2016), the career awareness of the students (Quagliata, 2015; Christensen & Knezek, 2017), the attitudes of the students (Dubriwny et al., 2016; Gülhan & Şahin, 2016; Yamak et al., 2014), scale development and adaptation (Aydın et al. 2017; Berlin & White 2010; Derin et al., 2017; Faber et al., 2013; Gülhan & Şahin, 2016; Hacıömeroğlu & Bulut, 2016; Oh et al., 2012; Sjaastad, 2012; Tyler-Wood et al., 2010).
Purpose
Method
Research Model
Since this research will develop a scale to determine the attitudes of secondary school students about the STEM, it was necessary to choose a wide sample. Therefore, the study uses the screening method as a descriptive research method. The screening method is used to determine the characteristics of a group using a group from a large group of participants (Büyüköztürk et al., 2009; Cohen & Manion 2007; Karasar, 2006). In this study, cross-sectional scanning method, which is one of the screening models, is used. In the cross-sectional screening method, the data are collected at a specific point in time and a general overview of the situation is noted. Screening was preferred to reach a general judgment about the universe.
Process Steps in Developing the Scale
This study was carried out considering the scale development steps proposed by Seçer (2015). Seçer (2015) defines the scale development stages as follows; (1) determination of the need, (2) literature review, (3) creating the item pool, (4) obtaining expert opinion, (5) forming the scale for the first time, (6) applying the pilot study for item selection, (7) determining the research group (8), conducting statistical analysis for the selection of items, after applying the pilot study, and (9) determining the final form of the test.
Determination of the Need
Recently, some studies have been conducted in the international literature to measure the attitudes of teachers, prospective teachers and students towards STEM education (Berlin & White 2010; Faber et al., 2013; Oh et al., 2012; Sjaastad, 2012; Tyler-Wood et al., 2010). However, in our country, mostly these scales that are internationally developed, are adapted (Aydın et al., 2017; Derin et al., 2017; Gülhan & Şahin, 2016; Hacıömeroğlu & Bulut, 2016). In fact, while adapting the scales from one culture to another culture, there may be various challenges in this process. The most important of these challenges are the problems related to the translation process (Akbaş & Korkmaz, 2007; Cook et al., 2005). Savaşır (1994), Şahin (1994) and Erkuş (2007), in their studies, pointed out a number of problems that have been encountered when adapting a scale developed in another culture to Turkish culture. In fact, since it is not very likely that a scale developed in a culture would be exactly the same in another culture (Sireci & Berberoğlu, 2000) and the scale may not be able to fully demonstrate the characteristics of individuals in that culture when the scale is adapted from a different culture (Cronbach, 1990), it would be more appropriate to develop a new test in the second language (Çıkrıkçı-Demirtaşlı, 2007), if the study doesn't intend to compare the cultures.
No current STEM attitude scale was developed in our country yet. In this study, data were collected from ten (10) separate provinces in seven (7) separate regions of our country, thus we aimed to increase the representation power of the scale. This study has been carried out since no scale was developed in Turkey although there is a need for a STEM attitude scale for Turkish students, and thus, the study aims to fill the gap in the literature. We think that the STEM Attitude Scale to be developed will be useful in measuring the attitudes of the students in our country towards the quickly spreading STEM education in the world. We also hope that this scale will guide the institutions, researchers, and teachers that wish to determine and examine the attitudes of secondary school students towards the STEM.
Literature Review
Creation of the Item Pool
Data were collected from secondary school students in order to be more accurate and realistic and to help writing the attitude statements. For this purpose, a draft form consisting of 20 open-ended questions was prepared and presented to the experts for getting their opinion and a form consisting of 15 questions was prepared according to the feedback of the experts. After obtaining official permits for the implementation of the final open-ended form, it was applied to 245 secondary school students from 3 different secondary schools in the central districts of Van. In the selection of the students, the maximum variation sampling method, among the purposeful sampling methods, was used. Common themes are generated from situations that involve a number of differences with the maximum variation sampling method so that richer results may be obtained in this method compared to other sampling methods (Patton, 2014; Yıldırım & Şimşek, 2013). The socio-economic levels of the students were taken into consideration in the selection of the schools, where the application will be made. Schools were coded as A (high), B (middle) and C (low) according to their socioeconomic level (Table 1).
Table 1. Student distribution according to schools Schools Socio-Economic
Status
5th grade 6th grade
7th grade
8th grade
A High 18 27 17 16
B Middle 19 20 20 23
D Low 23 20 17 17
In order for the data to represent all class levels properly, we paid attention to collect a similar number of students from all levels. This form was applied by the students' own teachers under the guidance of a researcher and the students were given a class hour to fill out the form. Additional time is provided for students, who couldn't complete the form on time.
The answers of the students to open-ended questions were examined by the researchers with the descriptive and content analysis. In the examination, several codes were created and similar codes were put together so that the themes were developed. The themes and codes determined in this process provided a clue to the researcher for writing the items on the attitude scale.
Using the items in the literature, the students' opinions and the researcher's own experience, an item pool consisting of 290 items in the 5-point Likert scale (1: Strongly Disagree, 2: Disagree, 3: Undecided, 4: Agree, 5: Strongly Agree) was created. As a result of some preliminary examination and evaluation, the number of items in the pool has been reduced to 212.
Obtaining Expert Opinion
In order to ensure the coverage and face validity, the item pool was presented to 5 field experts for reviewing the items and 1 Turkish language specialist for examining the pool for spelling purposes (Table 2).
Table 2. Demographic characteristics of the expert group
Number Gender Title Department University
1 Male Associate
Professor
Physics Education Yüzüncü Yıl University
2 Female Professor Science Education İstanbul University-Cerrahpaşa
3 Female Associate
Professor
Science Education Boğaziçi University
4 Male Dr. Teacher Science Education Hacettepe University
5 Male Teacher Science Education Van
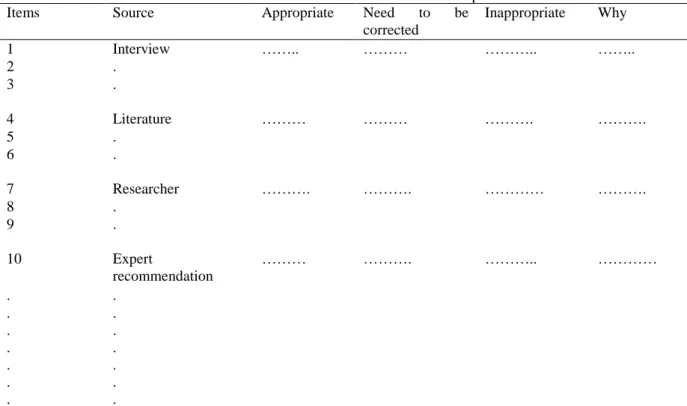
The draft scale form prepared for the determination of the content validity of the scale and sent to the experts is presented in Table 3. In this form, it is possible to find the items, the resources used for writing the items (students' opinion, literature, researchers, etc.) and boxes to ask whether the items are appropriate, why they are inappropriate if they are inappropriate, whether the items need to be corrected and the experts were asked to fill these boxes.
Table 3. "Draft Scale Form" that was sent to experts
Items Source Appropriate Need to be
corrected
Inappropriate Why
1 Interview …….. ……… ……….. ……..
2 .
3 .
4 Literature ……… ……… ………. ……….
5 .
6 .
7 Researcher ………. ………. ………… ……….
8 .
9 .
10 Expert
recommendation
……… ………. ……….. …………
. .
. . . . . .
. . . . . .
Forming the Scale for the First Time
In the feedback received from the experts, it was concluded that some items were self-efficacy statements, some statements were not understood clearly, some items measured more than one behavior, and some items are not an attitude statement. After the examination of all experts, some items are eliminated while some items are corrected in accordance with the reviews of the experts. After conducting all these examinations, the number of items has been reduced to 60 from 212 items and a draft form has been created.
Applying the Pilot Study for Item Selection
The draft form consisting of 60 items, created after getting the opinions and suggestions of experts, was applied 24 secondary school students, consisting of six students who were randomly selected from the 5th, 6th, 7th and 8th grades in the school, where the researcher was employed. The students were asked to answer the draft form during an hour in the class. The main purpose of this application was to determine whether the items in the draft form were understood by the students and how long it would take to answer this draft form. Afterward, the feedback from the students was evaluated and according to this evaluation, 6 items which were not fully understood by the students in the pilot group were excluded from the draft form. At the end of all these corrections, a draft form consisting of 54 items was made ready for the implementation.
Determining the Research Group
The sample of the study consisted of 2,500 secondary school students in different grade levels (5, 6, 7 and 8 grades) using a stratified sampling method. When the literature is examined, there is no definite information about the size of the study group to make factor analysis (Waltz et al., 2010). There are diverse studies that suggest that the size of the research group should be five (5) times greater than the number of items in the scale (Child, 2006) while there are some studies suggesting that the group should be ten (10) times (Kline, 2005; Nunually, 1978) or fifteen (15) times (Gorush, 1983) or twenty (20) times greater (Andrew et al., 2011). Comrey & Lee (1992) stated that the sample size would be excellent if it is thousand (1000) or more. From this point of view, the size of our research group can be considered excellent.
In the study, different class levels are discussed as stratification. In other words, Grade 5, Grade 6, Grade 7, Grade 8 and Grade 8 are defined as separate layers. “Proportional selection stratified method" was used in determining the number of students to be included in each layer. In this method, individuals are selected proportionally from each layer. The number of students in each layer (sample) is taken in proportion to the ratio in the universe (Gökçe, 2012). In other words, if the number of individuals is higher in a layer, there will be more individuals from this group in the sample, or vice versa (Arlı & Nazik, 2004). In the proportionate stratified method, the layers are primarily defined. Then the number of people in each layer is determined. The number of people in the layer is divided by the number of people in the universe and the weight of each layer is determined. The weight of each layer is multiplied by the number of samples and the number of people to be selected from each layer is defined (Çelik & Eroğlu, 2014; Sezgin & Esin, 2015).
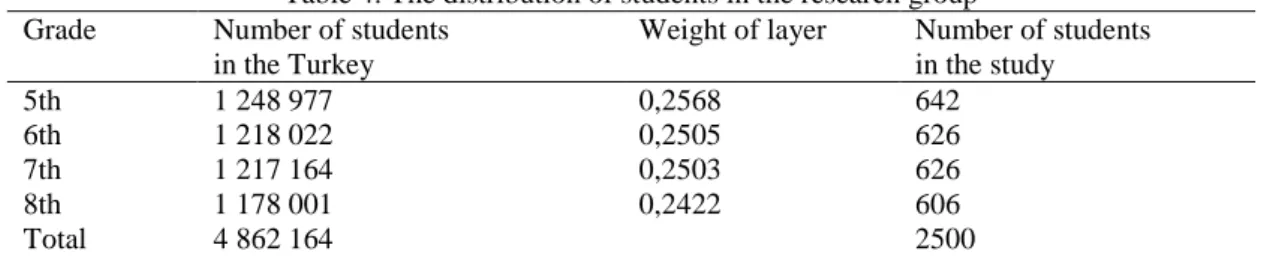
In this study, the following actions were taken to determine the number of students in each layer: (1) The number of students for each layer is taken from the MEB website. (2) The number of students in each layer is divided by the total number of students in the universe and the weight of each layer is determined. For example, the number of students who were studying at the 5th grade was 1,248,977 and this number was into the total number of students in the universe (4,862,164) and the weight of the layer was calculated as 0,2568. (3) The weight of each layer is multiplied by the number of students in the research group (sample) to define the number of students to be taken from each layer. For example, the number of students in the 5th grade was multiplied by the number of students in the study group (sample) to be 2,500 and the student to be included in the layer was found as 642 (Table 4).
Table 4. The distribution of students in the research group Grade Number of students
in the Turkey
Weight of layer Number of students in the study
5th 1 248 977 0,2568 642
6th 1 218 022 0,2505 626
7th 1 217 164 0,2503 626
8th 1 178 001 0,2422 606
Total 4 862 164 2500
For enhancing the ability to represent the universe, the data was collected from ten (10) different districts of 7 separate regions of Turkey and in total 2,500 secondary school students from 5th, 6th, 7th, and 8th grades were included among the students that study in fifteen (15) schools. The number of students participating in the research according to the regions is given in the table below.
Table 5. Number of students participating in research according to the regions
Regions Grade Total
5th 6th 7th 8th
Central Anatolia Region 75 75 75 75 300
Marmara Region 99 94 132 135 460
Southeast Anatolia Region 78 69 68 80 295
Black Sea Region 75 81 89 81 326
Aegean Region 119 105 65 51 340
Mediterranean Region 75 75 75 75 300
Eastern Anatolia Region 121 127 122 109 479
In the regions, the districts where the data were collected and the schools in the districts were selected by simple unbiased sampling method. Following cities were included in the study; Ankara from the Central Anatolia Region, Mersin from the Mediterranean Region, İstanbul, Kocaeli and Balıkesir from the Marmara Region, Diyarbakır from the Southeast Anatolia Region, Samsun and Rize from the Black Sea Region, İzmir from the Aegean Region, and Van from the Eastern Anatolia Region.
Results
Statistical Analysis for the Item Selection after the Pilot Study
Validity Studies
Content Validity
The content validity refers to how well a scale measures the behaviors for which it is intended in terms of quality and quantity (Cronbach & Meehl, 1955; Cureton, 1951). One of the methods used to evaluate the validity is to consult expert opinion (Büyüköztürk, 2007; Feyzioğlu et al., 2012; Thorndike & Haggen, 1977; Turan & Demirel, 2009). In this study, consulting expert opinion method was applied in order to ensure the content validity. Four faculty members that teach Science, one science teacher and one Turkish expert were interviewed to this aim. In terms of the suitability of the items, the items that are 90-100% suitable are directly taken into consideration whereas the items that are 70-80% suitable were corrected and included in the scale after a revision (Büyüköztürk, 2008). The items that the experts proposed to remove from the scale, were removed from the scale. This does not impair the scope validity of the scale, as different items are included in the scale to determine the characteristics it measures. As a result of the evaluation of the experts, it was concluded that the scale (items in the scale) was suitable for the 5, 6, 7, and 8th-grade students.
Face Validity
Face validity refers to assess whether the scale is viewed to measure the intended characteristics by the name, definition, and questions used (Büyüköztürk et al., 2014). In other words, this is the characteristic of the scale that seems to measure what it intends to measure. In this study, two (2) Science teachers have been interviewed to ensure the face validity and various corrections have been made according to the suggestions. After these corrections, in order to determine how the items in the draft form were understood by the students and how long they could answer this draft form, a total of 24 secondary school students (consisting of 6 students who were randomly selected from the 5th, 6th, 7th and 8th grades) were selected for the implementation of the pilot study. Afterward, the feedback from the students was evaluated and at the end of the evaluation, some items that were not fully comprehended by the students in the target group were excluded from the draft form. In addition, in order to increase the face validity, an "explanation" section was added in the upper part of the front page of the scale. This section gives information including the name of the scale, the purpose for which the scale is used, the use of the scale, how many items are included in the scale and how to make the markings on the scale.
Construct Validity (Factor Analysis)
Factor analysis is used to obtain the factor by reducing the number of variables by grouping the related items that measure the same characteristics (Seçer, 2015). Exploratory and confirmatory factor analysis (EFA and CFA) of the "STEM Attitude Scale for Secondary School Students" were conducted.
Exploratory Factor Analysis (EFA)
In the Exploratory Factor Analysis of STEM Attitude Scale for Secondary School Students, firstly, the significance of Barlett's Test of Sphericity value was examined to determine whether the data set had multivariate normal distribution and Kaiser-Meyer-Olkin (KMO) for the suitability of sample size. For the suitability of the data for factor analysis, KMO should be higher than .60 and Barlett test should be significant (Büyüköztürk, 2004).
Table 6. KMO and Barlett’s test values for STEM attitude scale
Kaiser-Meyer-Olkin Value KMO .919
Bartlett's Test of Sphericity Ki-kare value
26236,010
df (degrees of freedom) 528
p (probability) .000
If the KMO values between 0.50-0.60, it indicates the sampling is "miserable"; between 0.60-0.70, it signifies the sampling is "mediocre". If the KMO values between 0.70-0.80, it indicates the sampling is "middling"; between 0.80-0.90, it indicates the sampling is "meritorious". If the KMO values more than 0.90, it means that the sampling is marvelous (Leech, Barrett & Morgan, 2005; Tavşancıl, 2005). When the data are examined, it can be said that the KMO value is .919 and the sample size of the data set is suitable for factor analysis. The Barlett's test χ 2 value was found as 26236,010 (p<.05). Hence, it is possible to say that the Barlett's test is meaningful and the data set has a multivariate normal distribution (Table 6). Thus, it was concluded that the results of "KMO" and "Barlett's" tests were appropriate for factor analysis of the data used in the study.
In the EFA analysis of the draft STEM Attitude scale consisting of 54 items, which were formed after the pilot study, a structure with nine factors and an eigenvalue greater than 1 was obtained and this structure explains 49,304% of the total variation. Factors with an eigenvalue greater than 1 are considered significant (Yaşlıoğlu, 2017). Accordingly, the factors with eigenvalues equal to 1 or below 1 were eliminated. In addition, items with factor load values of less than .30 and items that have more than one factor were removed if the variation between the factor load values is equal to 0.10 and less.
At the end of the varimax rotation, in the first EFA analysis, items 16-51-8-9-50-53-13-42-31 were excluded from the scale because they were overlapping items. At the end of the second AFA, 10-5-45-20-44 items, and then the 19 and 39 items were removed from the scale and the items in the scale formed a structure consisting of 8 factors. However, However, since the 8th factor includes only two items (items 26 and 2) and they explain only 3.93% of the total variation, and 7th factor contains three items (6, 11 and 12), and the total variation values were below 5%, these items were removed from the scale. If the contribution to explain the factor is less than 5%, the factor is excluded from the evaluation. In addition, in terms of "total variation percentage" used for determining the number of factors, if the contribution of the additional factor to the explanation of the total variation is less than 5%, the maximum number of factors is reached (Yaşlıoğlu, 2017).
At the end of the varimax technique, as a vertical rotation method, a structure consisting of 33 items with six (6) factors was obtained and this structure explains 51,843% of the total variation. In multiple factor analysis, the total explained variation is expected to be more than 40% (Kline, 2011). The percentage of explained variation of these 6 factors are respectively 14,025%, 9,324%, 8,949%, 7,149%, 6,955% and 5,442% (Table 7).
Table 7. Percentage of explained variation of the factors Factors Eigenvalues Percentage of variance explained
(Total)
Percentage of variance explained (Cumulative)
F1 7,348 14,025 14,025
F2 3,741 9,324 23,349
F3 1,792 8,949 32,298
F4 1,613 7,149 39,446
F5 1,364 6,955 46,401
F6 1,251 5,442 51,843
Table 8. Scale items and distribution of these substances to sub-dimensions Item
Number
Items Factors
F1 F2 F3 F4 F5 F6
S17 Mathematics is a fun lesson. ,802
S21 I enjoy solving mathematical problems. ,796 S14 Mathematical operations are enjoyable. ,787
S15 I am interested in mathematics. ,778
S24 I feel good when I deal with mathematics. ,765 S23 When I have math homework, I can't wait to complete them. ,727 S18 I'm interested in mathematics in extracurricular times. ,708 S22 I do mathematical activities in my spare time (puzzles, sudoku,
etc.).
,523
S35 I like to deal with technology. ,718
S34 I am interested in the technology. ,708
S37 I want more technology to be used during the course. ,646 S36 I would like to have more courses on technology at school. ,618
S33 I like to play with technological tools. ,605
S38 I closely follow the latest innovations in technology. ,580
S28 I enjoy designing something in my free time. ,756
S25 I like to design things. ,711
S32 I am interested in designing a product/tool. ,616
S27 I like drawing a building, car, bridge, plane, etc. ,607 S29 I would like to design a tool/product that will make human life
easier.
,604
S30 I love to repair something at home. ,537
S3 I am interested in Science course. ,778
S4 I am curious about science. ,743
S1 I enjoy participating in science-related activities. ,716
S7 I enjoy working on science at home. ,592
S43 Science, mathematics, technology and engineering fields complement each other.
,700
S41 Science, mathematics, technology, and engineering skills should be used together when inventing something.
,696
S40 Science, mathematics, engineering and technology are interrelated.
,677
S47
If I attend a course that combines science, mathematics, engineering, and technology skills, I may learn about my skills that I am not aware of.
,478
S46 Science, mathematics, engineering and technology are very important in our life.
,473
S48 I would like to choose an engineering profession (machinery, mining, construction, architect etc.) in the future.
,658
S54
I would like to have a profession in the fields of science, mathematics, engineering, and technology so that I can be more beneficial to people.
,646
S49 In the future, I would like to choose a profession related to science (physics, chemistry, biology, medicine, space, etc.).
Table 9. Distribution of items by factors at the end of EFA analysis
Confirmatory Factor Analysis (CFA)
After conducting exploratory factor analysis, confirmatory factor analysis was performed with the LISREL 9.3 statistical program and it was tested whether the determined dimensions were confirmed. Model adjustment indexes were used to evaluate the CFA results. At the end of CFA analysis conducted for determining the scale's goodness of fit, it was found that the chi-square adjustment value of the factor structure consisting of 33 items and 6 sub-factors was significant (χ² = 4083.21, Sd=480, p=00) and the value χ² /df about the goodness of fit was found to be 8.5. Çelik and Yılmaz (2013) state that the χ² value varies depending on the sample size and the χ² value increases when the sample size increases" (p. 32). Therefore, the statistics of χ² has a limited use (Yılmaz, 2004) and it is decided whether the model is compatible by considering different fit indexes, not only the results of a single DFA test (Çapık, 2014). When the fit indices used to test the goodness of fit other than Χ² are calculated, following results were obtained: RMSEA (Root Mean Square Error of Approximation) .0548, RMR (Root Mean Square Residual): .0486, SRMR (Standardized Root Mean Square Residual): .0486, GFI (Goodness of Fit Index): .902, AGFI (Adjusted Goodness of Fit Index): .885, IFI (Incremental Fit Index): .902, NFI (Normed Fit Index): .890, NNFI (Non-Normed Fit Index): .892 and CFI (Comparative Fit Index): .902. Table 10 presents the findings of the CFA conducted to examine the model fit of the STEM Attitude Scale for Secondary School Students with its six factor structure.
Table 10. Findings of confirmatory factor analysis Model fit
Indices
Research findings Perfect fit value Acceptable fit value
Interpretation (Seçer, 2015)
RMSEA .0548 ≤.05 ≤.08 Acceptable fit
RMR .0486 ≤.05 ≤.08 Perfect fit
SRMR .0486 ≤.05 ≤.08 Perfect fit
CFI .902 ≥.95 .97 ≥.90 .95 Acceptable fit
NNFI .892 (.901) ≥.95 ≥.90 Acceptable fit
NFI .890 (.903) ≥.95 ≥.90 Acceptable fit
IFI .902 ≥.95 ≥.90 Acceptable fit
RFI .879 (.908) ≥.95 ≥.90 Acceptable fit
GFI .902 ≥.90 95 ≥.85 90 Perfect fit
AGFI .885 ≥.90 ≥.85 Acceptable fit
χ² /df 8.5 0-2 2-3 Reject
Sub-dimensions The draft form of the scale Scale items after EFA
Science 1-2-3-4-5-6-7-8-9-10-11-12 1-3-4-7
Mathematics 13-14-15-16-17-18-19-20-21-22-23-24 14-15-17-18-21-22-23-24
Engineering 25-26-27-28-29-30-31-32 25-27-28-29-30-32
Technology 33-34-35-36-37-38-39 33-34-35-36-37-38
Science-Mathematics-Engineering-Technology
40-41-42-43-44-45-46-47 40-41-43-46-47
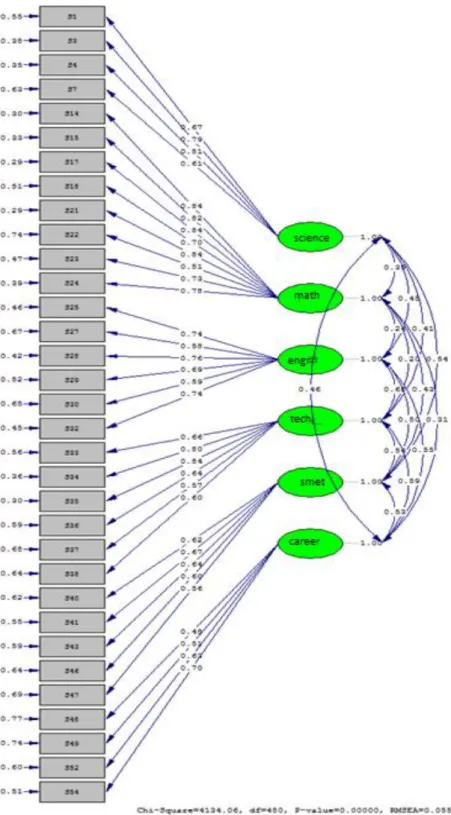
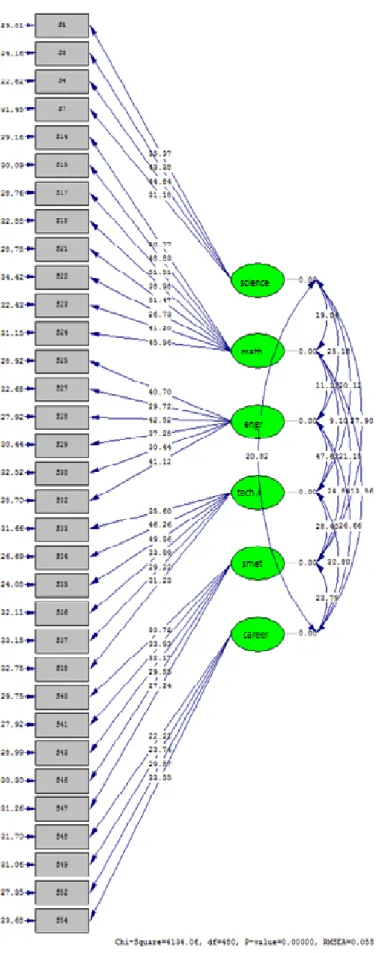
When the fit index values given in Table 10 are taken into consideration, it can be said that RMSEA, CFI, NNFI, NFI, IFI, RFI, and AGFI values have an acceptable compliance level, while the fit indices about RMR and GFI values have the "perfect fit" level. The path diagram of the STEM attitude scale for secondary school students is shown in Figure 1 and the t-values are given in Figure 2.
Figure 2: t-values of STEM attitude scale for secondary school students
each item should be at least .30 and above in scale adaptation and scale development studies. When the path diagram in Figure 1 is examined, we can state that the factor load values of all items are at the desired level. After performing the standard solution, t-values between factors and items were examined. As shown in Figure 2, the absence of any red arrow indicates that all items were significant at .05 level (Seçer, 2015).
Reliability
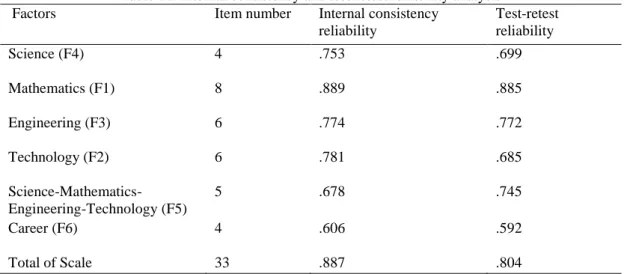
Internal consistency and test-retest reliability analysis were performed to determine the reliability of the STEM Attitude Scale for Secondary School Students. For the test-retest reliability study, the scale was applied twice to 40 secondary school students that study in a secondary school in Van in an interval of two weeks. Data obtained after application were analysed. The results obtained after these analyses are given in Table 11.
Table 11. Internal consistency and test-retest reliability analysis
Factors Item number Internal consistency
reliability
Test-retest reliability
Science (F4) 4 .753 .699
Mathematics (F1) 8 .889 .885
Engineering (F3) 6 .774 .772
Technology (F2) 6 .781 .685
Science-Mathematics-Engineering-Technology (F5)
5 .678 .745
Career (F6) 4 .606 .592
Total of Scale 33 .887 .804
The Cronbach Alpha (α) internal consistency reliability value of the STEM Attitude Scale for Secondary School Students was found to be .887. The internal consistency coefficients of the sub-dimensions of the scale were .753 for the Science dimension, .889 for the Mathematics dimension, .774 for the Engineering sub-dimension, .781 for the Technology sub-sub-dimension, .678 for the Science-Mathematics-Engineering-Technology sub-dimension, .606 for the Career sub-dimension.
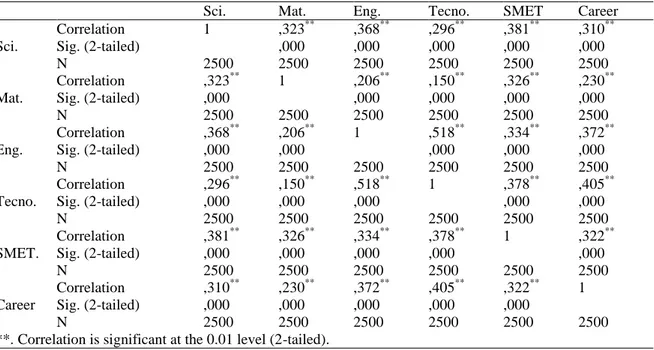
The test-retest reliability for the total of scale was found .804 and for the sub-dimensions respectively, .699 for the Science sub-dimension, .885 for the Mathematics sub-dimension, .772 for the Engineering sub-dimension, .685 for the Technology dimension, .745 for the Science-Mathematics-Engineering-Technology sub-dimension and .592 for the Career sub-sub-dimension. In terms of reliability of a scale, if 0.40≤α<0.60 the reliability is low, if 0.60≤α<0.80 the scale is rather reliable and if 0.80≤α<1.00, it can be considered that the scale is highly reliable (Kalaycı, 2008). Hence, it can be said that the scale is highly reliable. Correlations between factors were also calculated and the results are presented in Table 12.
Table 12. Correlations between factors
Sci. Mat. Eng. Tecno. SMET Career
Sci.
Correlation 1 ,323** ,368** ,296** ,381** ,310**
Sig. (2-tailed) ,000 ,000 ,000 ,000 ,000
N 2500 2500 2500 2500 2500 2500
Mat.
Correlation ,323** 1 ,206** ,150** ,326** ,230**
Sig. (2-tailed) ,000 ,000 ,000 ,000 ,000
N 2500 2500 2500 2500 2500 2500
Eng.
Correlation ,368** ,206** 1 ,518** ,334** ,372**
Sig. (2-tailed) ,000 ,000 ,000 ,000 ,000
N 2500 2500 2500 2500 2500 2500
Tecno.
Correlation ,296** ,150** ,518** 1 ,378** ,405**
Sig. (2-tailed) ,000 ,000 ,000 ,000 ,000
N 2500 2500 2500 2500 2500 2500
SMET.
Correlation ,381** ,326** ,334** ,378** 1 ,322**
Sig. (2-tailed) ,000 ,000 ,000 ,000 ,000
N 2500 2500 2500 2500 2500 2500
Career
Correlation ,310** ,230** ,372** ,405** ,322** 1
Sig. (2-tailed) ,000 ,000 ,000 ,000 ,000
N 2500 2500 2500 2500 2500 2500
**. Correlation is significant at the 0.01 level (2-tailed).
Discussion, Conclusion and Implications
In this study, based on the absence of any STEM attitude scale for secondary school students in our country and based on the need for creating a scale; it was aimed to develop a valid and reliable attitude scale in order to learn the attitudes of secondary school students towards the STEM. The operations are summarized in the table below.
Table 13. Process steps of the study
Process Steps Operations Performed
Formation of the Item Pool -Interviews with 245 students in three (3) different secondary schools -Literature review
-An item pool consisting of 290 items Ensuring Scope and Face
Validity
-Five (5) field experts and one (1) Turkish language expert -Practice with twenty four (24) students
Practice -2500 secondary school students from fifteen (15) seven (7) different regions, ten (10) different districts
Ensuring Structure Validation
-Explanatory Factor Analysis -Confirmatory Factor Analysis
Reliability Analysis -Cronbach-Alpha and Test-retest reliability
The last form of the Scale -The scale consisting of thirty-three (33) items with six (6) factors
In line with the purpose of the study, taking into account the scale development stages indicated by Seçer (2015) in the field of related literature; the needs were determined in the first place, the literature was reviewed, the item pool was created, the opinions' of the experts were taken, the first form of the scale was created, the pilot for the selection of the item was performed, the research group was determined, after the pilot application, statistical analyses were made for the selection of the items and the test was finalized.
some items are corrected in accordance with the reviews of the experts. After conducting all these examinations, the number of items has been reduced to 60 from 212 items and a draft form has been created. The draft form consisting of 60 items was applied 24 secondary school students, consisting of six students who were randomly selected from the 5th, 6th, 7th and 8th grades in the school, where the researcher was employed. Afterward, the feedback from the students was evaluated and according to this evaluation, 6 items which were not fully understood by the students in the pilot group were excluded from the draft form. Then a draft form consisting of 54 items made ready for the implementation. The draft form was applied to 2,500 secondary school students (5th, 6th, 7th and 8th grade) that study at ten (10) different districts of seven regions in Turkey. When the literature is examined (Andrew et al., 2011; Child, 2006; Comrey & Lee, 1992; Gorusch, 1983; Kline, 2005; Nunually, 1978), it can be stated that the size of the working group is excellent in terms of the factor analysis. The draft scale was applied in the study group, and Exploratory Factor Analysis (AFA) and Confirmatory Factor Analysis (CFA) of STEM Attitude Scale for Secondary School Students were performed on the data obtained. It was concluded that the data set of the scale at the of the KMO and Barlett's test had a multivariate normal distribution. At the end of EFA analysis of the draft scale, structure consisting of 33 items with six (6) factors was obtained and this structure explains 51,843% of the total variation. The factor load values for the items creating the scale were found to vary between .473 and .802. Factors are named as Mathematics, Technology, Engineering, Science, Science-Mathematics-Engineering-Technology and Career.
For the construct validity of the STEM Attitude Scale for Secondary School Students, model fit indexes of the scale were used to evaluate the Confirmatory Factor Analysis (CFA) results. In terms of fit indices of the scale, it can be said that RMSEA, CFI, NNFI, NFI, IFI, RFI, and AGFI values have an acceptable compliance level, while the fit indices about RMR and GFI values have the "perfect fit" level. Since all the fit indices are at the acceptable level, it is concluded that six-factor structure of the STEM Attitude Scale for Secondary School Students is an utilisable and valid model.
Internal consistency and test-retest reliability analyses were performed to determine the reliability of STEM Attitude Scale for Secondary School Students. The Cronbach Alpha (α) internal consistency reliability value of the scale was found to be .887. The internal consistency coefficients of the sub-dimensions of the scale were found to be .753, for the Science sub-dimension, .889 for the Mathematics sub-dimension, .774 for the Engineering sub-dimension, .781 for the Technology sub-dimension, .678 for Science-Mathematics-Engineering-Technology sub-dimension, .606 for Career sub-dimension. The test-retest reliability was found to be .804 for the entire scale, .699 for the Science sub-dimension, .885 for the Mathematics sub-dimension, .772 for the Engineering sub-dimension, .685 for the Technology sub-dimension, .745 for Science-Mathematics-Engineering-Technology sub-dimension, .592 for the Career sub-dimension. In terms of reliability of a scale, if 0.40≤α<0.60 the reliability is low, if 0.60≤α<0.80 the scale is rather reliable and if 0.80≤α<1.00, it can be considered that the scale is highly reliable (Kalaycı, 2008). Hence, it was concluded that the entire scale and all the sub-dimensions are highly reliable.
Correlations between the six factors in the STEM attitude scale were calculated and values between .150 and .518 were found. The lowest correlation was revealed between Mathematics and Technology and the highest correlation was between Engineering and Technology. The relationship between the sub-dimensions of the scale is statistically significant and positive at .01 level. The high correlation between the factors indicates that these 6 factors are the components measuring the attitudes of middle school students towards the STEM.
In line with the objectives of the study, STEM Attitude Scale was developed in the form of a five-point Likert (Strongly Agree-5, Agree-4, Partially Agree-3, Disagree-2, and Strongly Disagree-1) consisting of six (6) factors and thirty-three (33) items. STEM Attitude Scale developed in this study was used to fill the gap in the literature. We think that this scale will be useful in measuring the attitudes of the students in our country towards the rapidly spreading STEM education in the world. The STEM Attitude Scale for Secondary School Students, as a reliable source, can be used to determine the attitudes of middle school students (5th, 6th, 7th and 8th grade) to STEM during the experimental and descriptive research and it can be used by the institutions, researchers and teachers that aim to determine the factors affecting these attitudes. Therefore, it can be used as a data collection tool in the studies to be carried out for the purposes mentioned above.
Acknowledgments
References
Akbaş, G., & L. Korkmaz (2007). Ölçek uyarlaması. Türk Psikoloji Bülteni, 13(40), 15.
Akgündüz, D., Aydeniz, M., Çakmakçı, G., Çavaş, B., Çorlu, M. S., Öner, T., & Özdemir, S. (2015). STEM eğitimi Türkiye raporu: Günün modası mı yoksa gereksinim mi? İstanbul Aydın Üniversitesi STEM Merkezi.
Andrew, D. P. S., Pedersen, P. M., & McEvoy, C. D. (2011). Research methods in sport management. Champaign: Human Kinetics.
Arlı, M., & H. Nazik (2004). Bilimsel araştırmaya giriş. Ankara: Gazi Kitabevi.
Aslan-Tutak, F., Akaygun, S., & Tezsezen, S. (2017). İşbirlikli FeTeMM (Fen, Teknoloji, Mühendislik, Matematik) eğitimi uygulaması: Kimya ve matematik öğretmen adaylarının FeTeMM farkındalıklarının incelenmesi. Hacettepe Üniversitesi Eğitim Fakültesi Dergisi, 32(4), 794-816.
Autenrieth, R., Lewis, C., & Butler-Purry, K. (2017). Long-term impact of the E3 summer teacher program. Laboratory for Innovative Technology in Engineering Education (LITEE). Retrieved May 20, 2018 from https://www.learntechlib.org/p/180287/.
Aydın, G., Saka, M., & Guzey, S. (2017). 4., 5., 6., 7. ve 8. sınıf öğrencilerinin STEM (FeTeMM) tutumlarının bazı değişkenler açısından incelenmesi. Mersin Üniversitesi Eğitim Fakültesi Dergisi, 13(2), 787-802. Baran, E., Canbazoğlu-Bilici, S., & Mesutoğlu, C. (2015). Fen, teknoloji, mühendislik ve matematik (FeTeMM)
spotu geliştirme etkinliği. Araştırma Temelli Etkinlik Dergisi (ATED), 5(2), 60-69.
Berlin, D. F., & White, A. L. (2010). Preservice mathematics and science teachers in an integrated teacher preparation program for grades 7–12: A 3-year study of attitudes and perceptions related to integration. International Journal of Science and Mathematics Education, 8(1), 97-115.
Bicer, A., Navruz, B., Capraro, R. M., Capraro, M. M., Oner, T. A., & Boedeker, P. (2015). STEM schools vs. non-STEM schools: Comparing students' mathematics growth rate on high-stakes test performance. International Journal of New Trends in Education and Their Implications, 6(1), 138-150.
Brophy, S., Klein, S., Portsmore, M., & Rogers, C. (2008). Advancing engineering education in P‐12 classrooms. Journal of Engineering Education, 97(3), 369‐387.
Brunsell, E. (Ed.). (2012). Integrating engineering and science in your classroom. Arlington, Virginia: NSTA press.
Büyüköztürk, Ş., Kılıç-Çakmak, E., Akgün, O. E., Karadeniz, S. & Demirel, F. (2009). Bilimsel araştırma yöntemleri. Ankara: Pegem A Yayıncılık.
Büyüköztürk Ş., Kılıç-Çakmak, E., Akgün. Ö. E., Karadeniz, Ş. & Demirel, F. (2014) Bilimsel araştırma yöntemleri (18. Baskı) Ankara: Pegem A Yayınclık.
Büyüköztürk, Ş. (2004). Veri analizi el kitabı. Ankara: Pegem A Yayıncılık.
Büyüköztürk, Ş. (2007). Sosyal Bilimler için Veri Analizi El Kitabı (7. Baskı). Ankara: Pegem A Yayıncılık. Büyüköztürk, Ş. (2008). Sosyal bilimler için veri analizi el kitabı. Ankara: Pegem A Yayıncılık.
Bybee, R. W. (2010). What is STEM education? Science, 329, 996.
Ceylan, S. (2014). Ortaokul fen bilimleri dersindeki asitler ve bazlar konusunda fen, teknoloji, mühendislik ve matematik (FeTeMM) yaklaşımı ile öğretim tasarımı hazırlanmasına yönelik bir çalışma. (Yayımlanmamış yüksek lisans tezi). Uludağ Üniversitesi Eğitim Bilimleri Enstitüsü, Bursa.
Child, D. (2006). The essentials of factor analysis. London: Third Ed. Continuum.
Chesky, N. Z., & Wolfmeyer, M. R. (2015). Philosophy of STEM education: A critical investigation. New York: Palgrave Macmillan.
Christensen, R. & Knezek, G. (2017). Relationship of middle school student STEM interest to career intent. Journal of Education in Science, Environment and Health (JESEH), 3(1), 1- 13.
Çavaş B., Bulut, Ç., Holbrook, J., & Rannikmae, M. (2013). Fen eğitimine mühendislik odaklı bir yaklaşım: ENGINEER projesi ve uygulamaları. Fen Bilimleri Öğretimi Dergisi, 1(1), 12-22.
Çıkrıkçı-Demirtaşlı, R. N. (2007). Psikolojik ölçmelere ilişkin doğru bilinen yanlışlar. Türk Psikoloji Bülteni, 13(41), 65-68.
Cohen, L., Manion, L., & Morrison, K. (2007). Research methods in education (6th ed.). New York, NY: Routledge.
Comrey, A. L., & Lee, H. L. (1992). A first course in factor analysis. Hillsdale, New Jersey: Erlbaum.
Cook, L. L., Schmitt-Cascallar, A. P., & Brown, C. (2005). Adapting achievement and aptitude tests: A review of methodological issues. Hambleton, R. K., Merenda, P. F. & Spielberger, C. D. (Ed.), Adapting educational and psychological tests for cross-cultural assessment (pp. 171-192). Mahwah, NJ: Lawrence Erlbaum Associates.
Corlu, M. S. (2014). FeTeMM eğitimi makale çağrı mektubu. Turkish Journal of Education, 3(1), 4-10.
Cronbach, L. J. (1990). Essentials of psychological testing. New York: Harper & Row Publishers.
Cronbach, L. J., & Meehl, P. E. (1955). Construct validity in psychological tests. Psychological Bulletin, 52, 281–302.
Cureton, E. E. (1951). Validity. In E. F. Lindquist (Ed.), Educational measurement (1st Ed., pp. 621-694).Washington, DC: American Council on Education.
Çapık, C. (2014). Geçerlik ve güvenirlik çalışmalarında doğrulayıcı faktör analizinin kullanımı. Anadolu Hemşirelik ve Sağlık Bilimler Dergisi, 17(3), 196-205.
Çelik, H. E., & Yılmaz, V. (2013). LISREL 9.1 ile yapısal eşitlik modellemesi. Ankara: Anı Yayıncılık. Çelik, K., & Eroğlu, O. (2014). İlköğretim çağında vergi algısının incelenmesi: Zonguldak ili örneği. Çankırı
Karatekin Üniversitesi İİBF Dergisi, 4(2), 301-326.
Derin, G., Aydın, E., & Kırkıç, K.A. (2017). STEM (Fen-Teknoloji-Mühendislik–Matematik) eğitimi tutum ölçeği. El-Cezerî Fen ve Mühendislik Dergisi, 4(3), 547-559.
Douglas, J., Iversen, E., & Kalyandurg, C. (2004). Engineering in the K-12 classroom: An analysis of current practices and guidelines for the future. ASEE Engineering K12 Center.
Dubriwny, N., Pritchett, N., Hardesty, M., & Hellman, C. M. (2016). Impact of Fab Lab Tulsa on student self-efficacy toward STEM education. Journal of STEM Education: Innovations and Research, 17(2), 21. Dugger, W. (2010). Evolution of STEM in the United States. In Technology Education Research Conference.
Queensland.
Erkuş, A. (2007). Ölçek geliştirme ve uyarlama çalışmalarında karşılaşılan sorunlar. Türk Psikoloji Bülteni, 13(40), 17-25.
Faber, M., Unfried, A., Wiebe, E. N., Corn, J. Townsend, L.W., & Collins, T. L. (2013). Student attitudes toward STEM: the development of upper elementary school and middle/high school student surveys. 120th ASSE Annual Conference & Exposition. Atlanta
Feyzioğlu, B., Demirdağ, B., Akyıldız, M. & Altun, E. (2012). Ortaöğretim öğrencilerine yönelik bilimsel süreç becerileri testi geliştirilmesi: Geçerlik ve güvenirlik çalışması. Kuram ve Uygulamada Eğitim Bilimleri, 12(13), 1887-1906.
Gomez, A., & Albrecht, B. (2014). True STEM education. Technology and Engineering Teacher, 73(4), 8-16. Gonzalez, H. B., & Kuenzi J. (2012). Congressional research service Science, Technology, Engineering, and
Mathematics (STEM) Education: A primer. Retrieved May 8, 2018 from http://www.stemedcoalition.org/wp-content/uploads/2010/05/STEM-Education-Primer.pdf
Gorusch, R. L. (1983). Factor analysis. Hillsdale, NJ: Lawrence Erlbaum Associates. Gökçe, B. (2012) Toplumsal bilimlerde araştırma. Ankara: Savaş Yayınevi.
Guzey, S. S., Harwell, M., & Moore, T. (2014). Development of an instrument to assess attitudes toward science, technology, engineering, and mathematics (STEM). School Science and Mathematics, 114(6), 271-279.
Guzey, S. S., Tank, K., Wang, H. H., Roehrig, G., & Moore, T. (2014). A high‐quality professional development for teachers of grades 3–6 for implementing engineering into classrooms. School science and mathematics, 114(3), 139-149.
Gupta A, (2015). Fueling chemical engineering concepts with biodiesel production: A professional development experience for K-12 pre-service teachers. Journal of STEM Education, 16(1): 25-30
Gülhan, F., & Şahin, F. (2016). Fen-teknoloji-mühendislik-matematik entegrasyonunun (STEM) 5. sınıf öğrencilerinin bu alanlarla ilgili algı ve tutumlarına etkisi. International Journal of Human Sciences, 13(1), 602-620. doi:10.14687/ijhs.v13i1.3447
Hacıoglu, Y., Yamak, H., & Kavak, N. (2016). Pre-service science teachers’ cognitive structures regarding science, technology, engineering, mathematics (STEM) and science education. Journal of Turkish Science Education, 13(3).
Hacıömeroğlu, G., & Bulut, A. S. (2016). Integrative STEM teaching intention questionnaire: A validity and relaibility study of the Turkish form. Journal of Theory and Practice in Education, 12(3), 654-669. Han, S., Yalvac, B., Capraro, M. M., & Capraro, R. M. (2015). In-service Teachers' implementation and
understanding of STEM project based learning. Eurasia Journal of Mathematics, Science & Technology Education, 11(1), 63-76.
Idin, S. & Donmez, I. (2018). A metaphor analysis study related to STEM subjects based on middle school students’ perceptions. Journal of Education in Science, Environment and Health (JESEH), 4(2), 246-257. DOI:10.21891/jeseh.453629
Irkıçatal, Z. (2016). Fen, teknoloji, mühendislik ve matematik (FeTeMM) içerikli okul sonrası etkinliklerin öğrencilerin başarılarına ve FeTeMM algıları üzerine etkisi. (Yayınlanmamış yüksek lisans tezi). Akdeniz Üniversitesi Eğitim Bilimleri Enstitüsü, Antalya.
Kalaycı, Ş. (2008). SPSS uygulamalı çok değişkenli istatistik teknikleri. Ankara: Asil Yayın Dağıtım. Karasar, N. (2006). Bilimsel araştırma yöntemi. Ankara: Nobel Yayın Dağıtım.
Kızılay, E. (2016). Fen bilgisi öğretmen adaylarının FeTeMM alanları ve eğitimi hakkındaki görüşleri. The Journal of Academic Social Science Studies, 47, 403-417.
Kline, R. B. (2005). Principles and practice of structural equation modelling (2nd Ed.). New York: Guilford Press.
Kline, R. B. (2011). Principal and practice of structural equation modelling. The Guilford Press.
Lacey, T. A., & Wright, B. (2009). Occupational employment projections to 2018. Monthly Labor Review, 132(11), 82-123.
Lai, C. (2018). Using inquiry-based strategies for enhancing students’ STEM education learning. Journal of Education in Science, Environment and Health (JESEH), 4(1), 110-117. DOI:10.21891/jeseh.389740 Leech, N. L., Barrett, K. C., & George, A. Morgan (2005). SPSS for intermediate statistics: Use and
interpretation. New York, N.Y.: Taylor & Francis
Lin, K. Y., & Williams, P. J. (2015). Taiwanese preservice teachers’ science, technology, engineering, and mathematics teaching intention. International Journal of Science and Mathematics Education, 1- 16. Machi, E. (2009). Improving U.S. competitiveness: With K-12 STEM education and training. The Heritage
Foundation. Washington, DC.
Mahoney, M. P. (2010). Students' attitudes toward STEM: Development of an Instrument for high school STEM-based programs. Journal of Technology Studies, 36(1), 24-34.
Marulcu, İ., & Sungur, K. (2012). Fen bilgisi öğretmen adaylarının mühendis ve mühendislik algılarının ve yöntem olarak mühendislik-dizayna bakış açılarının incelenmesi. Afyon Kocatepe Üniversitesi Fen ve Mühendislik Bilimleri Dergisi, 12(1), 13-23.
Milli Eğitim Bakanlığı (MEB) (2016). Milli Eğitim istatistikleri. http://sgb.meb.gov.tr adresinden 10.06.2018 tarihinde alınmıştır.
Milli Eğitim Bakanlığı (MEB) (2017). Fen bilimleri dersi öğretim programı (3, 4, 5, 6, 7 ve 8.sınıf) tanımı öğretim programı tanıtım sunusu.
https://tegm.meb.gov.tr/meb_iys_dosyalar/2017_06/09163104_Fen_Bilimleri_Dersi_YYretim_Program Y_Karşılaştırmalar.pdf adresinden 2.11.2017 tarihinde alınmıştır.
Moomaw, S. (2013). Teaching STEM in the early years: Activities for integrating science, technology, engineering, and mathematics. St Paul, MN: Redleaf Press.
National Research Council (NRC). (2012). A Framework for K-12 science education: practices, crosscutting concepts, and core ideas. Washington DC: The National Academic Press.
National Research Council (NRC). (2014). STEM learning is everywhere: summary of a convocation on building learning systems. Washington, DC: The National Academies Press.
National Academy of Engineering (NAE) & National Research Council (NRC). (2009). Engineering in K-12 education understanding the status and improving the prospects. Washington, DC: National Academies Press.
Next Generations Science Standards [NGGS], (2013). The next generation science standards-executive summary.
http://www.nextgenscience.org/sites/ngss/files/Final%20Release%20NGSS%20Front%20Matter%20%2 06.17.13%20Update_0.pdf adresinden 2.05.2018 tarihinde alınmıştır.
Nunnally, J. C. (1978), Psychometric theory. NewYork: McGraw Hill.
Oh, Y. J., Jia, Y., Lorentson, M., & Labanca, F. (2012). Development of the educational and career interest scale in science, technology, and mathematics for high school students. Journal of Science Education and Technology, December, 1–11.
Öner, A. T., & Capraro, R. M. (2016). FeTeMM okulu olmak iyi öğrenci başarısı anlamına mı gelir?. Eğitim ve Bilim, 41(185), 1-17.
Özçakır-Sümen, Ö., & Çalisici, H. (2016). Pre-service teachers' mind maps and opinions on STEM education implemented in an environmental literacy course. Educational sciences: Theory and practice, 16(2), 459-476.
Patton, M. Q. (2014). Nitel araştırma ve değerlendirme yöntemleri (Çev. M. Bütün ve S.B. Demir). Ankara: Pegem A Yayıncılık.
Roberts, A. (2012). A justification for STEM education. Technology and engineering teacher. Retrieved June 12, 2018 from http://www.iteaconnect.org/mbrsonly/Library/TTT/TTTe/04-12roberts.pdf
Rogers, C., & Portsmore, M. (2004). Bringing engineering to elementary school. Journal of STEM Education, 5(3), 17-28.
Quagliata, A. B. (2015). University festival promotes STEM education. Journal of STEM Education: Innovations and Research, 16(3), 20.
Şahin, A., Ayar, M. C., & Adıgüzel, T. (2014). Fen, Teknoloji, Mühendislik ve Matematik içerikli okul sonrası etkinlikler ve öğrenciler üzerindeki etkileri. Educational Sciences: Theory & Practice, 14(1). doi: 10.12738/estp.2014.1.18763.
Sanders, M. E. (2009). STEM, STEM education, STEMmania. Technology Teacher, 68(4), 20‐26.
Savaşır, I. (1994). Ölçek uyarlamasındaki sorunlar ve bazı çözüm yolları. Türk Psikoloji Dergisi, 9(33), 27-32 Seçer, İ. (2015). Psikolojik test geliştirme ve uyarlama süreç, SPSS ve LISREL uygulamaları. Ankara: Anı
Yayıncılık
Sezgin, D., & Esin, M. N. (2015). Predisposing factors for musculoskeletal symptoms in intensive care unit nurses. International Nursing Review, 62(1), 92-101.
Sireci, S. G. & Berberoğlu, G. (2000). Using bilingual respondents to evaluate translated-adapted items. Applied Measurement in Education, 13(3), 229-248.
Sjaastad, J. (2012). Sources of Inspiration: The role of significant persons in young people’s choice of science in higher education. International Journal of Science Education, 34(10), 1615-1636.
Smith, J., & Karr-Kidwell, P. J. (2000). The interdisciplinary curriculum: A literary review and a manual for administrators and teachers. Retrieved June 26, 2018 from http://files.eric.ed.gov/fulltext/ED443172.pdf Sungur-Gül, K., & Marulcu, İ. (2014). Yöntem olarak mühendislik-dizayna ve ders materyali olarak legolara
öğretmen ile öğretmen adaylarının bakış açılarının incelenmesi. Electronic Turkish Studies, 9(2), 761-786.
Tavşancıl, E. (2005). Tutumların ölçülmesi ve SPSS ile veri analizi. (2. Baskı). Ankara: Nobel Yayınları. Tyler-Wood, T., Knezek, G., & Christensen, R. (2010). Instruments for assessing interest in STEM content and
careers. Journal of Technology and Teacher Education, 18(2), 341-363.
Thorndike, R. L., & Hagen, E. P. (1977). Measurement and evaluation in psychology and education. New York: John Wiley.
Turan, S. & Demirel, Ö. (2009). Probleme dayalı öğrenmeye ilişkin tutum ölçeği geçerlik ve güvenirlik çalışması. Eğitim ve Bilim, 34(152), 15-29.
Waltz, C. F., Strcikland, O. L., & Lenz, E. R. (2010). Measurement in nursing and health research. New York: Springer Publishing Company.
Weber, E., Fox, S., Levings, S. B., & Bouwma-Gearhart, J. (2013). Teachers’ conceptualizations of integrated STEM. Acad Exchange, 17(3), 47-53.
Wilson, S. (2013). Recent developments in STEM education relevant to the qualities of teacher preparation programs. Paper commissioned for the National Academy of Education Steering Committee on the Evaluation of Teacher Education Programs: Toward a Framework for Innovation.
Wagner, T. (2008). Rigor redefined. Educational Leadership, 66(2), 20–24.
Yamak, H., Bulut, N., & Dündar, S. (2014). 5. Sınıf öğrencilerinin bilimsel süreç becerileri ile fene karşı tutumlarına FeTeMM etkinliklerinin etkisi. Gazi Üniversitesi Gazi Eğitim Fakültesi Dergisi, 34(2), 249-265.
Yaşlıoğlu, M. M. (2017). Sosyal bilimlerde faktör analizi ve geçerlilik: Keşfedici ve doğrulayıcı faktör analizlerinin kullanılması. İstanbul Üniversitesi İsletme Fakültesi Dergisi, 46, 74-85.
Yıldırım, A., & Şimşek, H. (2013). Sosyal bilimlerde nitel araştırma yöntemleri (9. Baskı). Ankara: Seçkin Yayıncılık.
Yıldırım, B., & Altun, Y. (2015). STEM eğitim ve mühendislik uygulamalarının fen bilgisi laboratuar dersindeki etkilerinin incelenmesi. El-Cezeri Journal of Science and Engineering, 2(2), 28-40.
Yıldırım, B. & Selvi, M. (2015). Adaptation of STEM attitude scale to Turkish. Turkish Studies, 10(3), 1107-1120.
Yılmaz, V. (2004). LISREL ile yapısal eşitlik modelleri: Tüketici şikayetlerine uygulanması. Sosyal Bilimler Dergisi, 1, 77-90.
Yılmaz, H., Koyunkaya, M. Y., Güler, F., & Güzey, S. (2017). Fen, Teknoloji, Mühendislik, Matematik (STEM) Eğitimi Tutum Ölçeğinin Türkçe’ye Uyarlanması. Kastamonu Eğitim Dergisi, 25(5), 1787-1800.
Author Information
İbrahim Benek
Istanbul University-Cerrahpaşa Graduate College
Department of Mathematics and Science Education Istanbul, Turkey
Contact e-mail: [email protected]
Behiye Akçay
Istanbul University-Cerrahpaşa Hasan Ali Yucel Education Faculty Department of Science Education Istanbul, Turkey
Appendix 1. Ortaokul Öğrencilerine Yönelik STEM Tutum Ölçeği (Turkish)
Faktörler No
Kesin lik le katılıy or um Katılıy or um Kar ar sızım Katılm ıy or um Kesin lik le katılm ıy or um Fen
1 Fen bilimleri ile ilgili etkinliklere katılmaktan keyif alırım. 2 Fen bilimleri dersi ilgimi çeker.
3 Fen bilimlerine merak duyarım.
4 Evde fen bilimleri ile ilgili çalışmalar yapmaktan zevk alırım.
Ma
tem
atik
5 Matematiksel işlemler yapmak zevklidir. 6 Matematiğe karşı ilgiliyim.
7 Matematik eğlenceli bir derstir.
8 Ders dışı zamanlarda matematikle ilgilenirim. 9 Matematiksel problemleri çözmekten zevk alırım.
10 Boş zamanlarımda matematiksel etkinlikler yaparım (bulmaca, sudoku vb.).
11 Matematik ödevlerim olduğunda onları yapmak için sabırsızlanırım.
12 Matematikle uğraştığımda kendimi iyi hissederim.
Mü
hen
dis
lik
13 Bir şeyler tasarlamak hoşuma gider.
14 Bir bina, araba, köprü, uçak vb. ile ilgili çizim yapmayı severim.
15 Boş zamanlarımda bir şeyler tasarlamaktan zevk alırım. 16 İnsan hayatını kolaylaştıracak bir alet/ürün tasarlamak
isterim.
17 Evde bir şeyler onarmayı seviyorum. 18 Bir ürün/alet tasarlamak ilgimi çeker.
T ek n o lo ji
19 Teknolojik araç-gereçlerle oynamayı severim. 20 Teknolojiye karşı ilgim var.
21 Teknolojiyle uğraşmak hoşuma gider.
22 Okulda teknolojiyle ilgili daha fazla dersin olmasını isterim. 23 Derslerin işlenişi sırasında daha fazla teknoloji
kullanılmasını isterim.
24 Teknolojiyle ilgili yenilikleri yakından takip ederim.
Fen -Ma tem atik -Mü hen dis lik -T ek n o lo ji
25 Fen bilimleri, matematik, mühendislik ve teknoloji birbiri ile ilişkilidir.
26 Bir icat yapılırken fen bilimleri, matematik, teknoloji ve mühendislik becerileri beraber kullanılmalıdır.
27 Fen bilimleri, matematik, teknoloji ve mühendislik alanları birbirini tamamlar.
28 Fen bilimleri, matematik, mühendislik ve teknoloji yaşantımızda çok önemlidir.
29 Fen bilimleri, matematik, mühendislik ve teknoloji becerilerini bir arada veren bir derse katılmak, farkında olmadığım yeteneklerimin ortaya çıkmasını sağlayabilir.
Kar
iy
er
30 İlerde mühendislik ile ilgili bir meslek (makine, maden, inşaat, mimar vb.) seçmek isterim.
31 İlerde fen bilimleri ile ilgili bir meslek (fizik, kimya, biyoloji, tıp, uzay vb.) seçmek isterim.
32 İleride teknolojiyle ilgili bir işimin olmasını isterim.