ORIGINAL INVESTIGATION
Fasting plasma glucose variability
and HbA1c are associated with peripheral artery
disease risk in type 2 diabetes
Chun‑Pai Yang
1,2†, Cheng‑Chieh Lin
3,4,5†, Chia‑Ing Li
3,4, Chiu‑Shong Liu
3,4,5, Chih‑Hsueh Lin
3,5, Kai‑Lin Hwang
6,
Shing‑Yu Yang
7and Tsai‑Chung Li
7,8*Abstract
Background: This study investigated whether visit‑to‑visit fasting plasma glucose (FPG) variability, as measured by the coefficient of variation (CV), increased peripheral artery disease (PAD) risk.
Methods: Individuals with type 2 diabetes from the National Diabetes Care Management Program during the period 2002–2004, ≥ 30 years of age, and free of PAD (n = 30,932) were included and monitored until 2011. Cox proportional hazards regression models were implemented to analyze related determinants of PAD.
Results: A total of 894 incident cases of PAD were identified during an average 8.2 years of follow‑up, resulting in a crude incidence rate of 3.53 per 1000 person‑years. Both FPG‑CV and HbA1c were significantly associated with PAD after multivariate adjustment, with corresponding hazard ratios of 1.24 [95% confidence interval (CI) 1.04–1.47] for FPG‑CV in the third tertile and 1.50 (95% CI 1.10–2.04) for HbA1c ≥ 10%. The findings of the sensitivity analysis remained consistent after excluding potential confounders, demonstrating the consistency of the results. Conclusions: The associations between HbA1c, variability in FPG‑CV, and PAD suggest a linked pathophysiologi‑ cal mechanism, suggesting the crucial role of glycemic variability in clinical management and therapeutic goals in preventing PAD in type 2 diabetes.
Keywords: HbA1c, Fasting plasma glucose, Glycemic variability, Peripheral artery disease
© The Author(s) 2020. This article is licensed under a Creative Commons Attribution 4.0 International License, which permits use, sharing, adaptation, distribution and reproduction in any medium or format, as long as you give appropriate credit to the original author(s) and the source, provide a link to the Creative Commons licence, and indicate if changes were made. The images or other third party material in this article are included in the article’s Creative Commons licence, unless indicated otherwise in a credit line to the material. If material is not included in the article’s Creative Commons licence and your intended use is not permitted by statutory regulation or exceeds the permitted use, you will need to obtain permission directly from the copyright holder. To view a copy of this licence, visit http://creat iveco mmons .org/licen ses/by/4.0/. The Creative Commons Public Domain Dedication waiver (http://creat iveco mmons .org/publi cdoma in/ zero/1.0/) applies to the data made available in this article, unless otherwise stated in a credit line to the data.
Background
Peripheral artery disease (PAD) remains a main cause of non-traumatic lower limb amputations and is linked with cardiovascular complications and long-term disability in type 2 diabetes [1, 2]. Early screening and interventions for modifiable risk factors for PAD can lead to reduction of risk and related complications. A number of traditional risk factors are linked with PAD [3, 4]; however, there is a
need to further investigate non-conventional risk factors, especially in vulnerable populations.
PAD is defined as systemic atherosclerosis, mostly in the lower limbs [1, 3, 4]. Recent evidence suggested that glycemic variation might play a crucial role in the athero-sclerosis pathogenesis and may confer additional risk for diabetes-related complications, independent of HbA1c level [5, 6]. In addition, there is increasing evidence sug-gesting that glycemic variability, as derived from the visit-to-visit fasting plasma glucose (FPG) measurements by coefficient of variation (CV), is an independent risk factor for ischemic stroke, diabetic peripheral polyneuropathy, Alzheimer’s disease, and all-cause or cause-specific mor-tality in persons with type 2 diabetes [7–11]. Moreover,
Open Access
*Correspondence: tcli@mail.cmu.edu.tw
†Cheng‑Chieh Lin and Chun‑Pai Yang contributed equally to this work. 7 Department of Public Health, College of Public Health, China Medical University, 91 Hsueh‑Shih Road, Taichung 40421, Taiwan
animal and in vitro studies have also shown that oscillat-ing glucose levels may have more harmful effects, includ-ing increased atherosclerosis, than chronic sustained hyperglycemia, that are involved in the pathogenesis of PAD [12–14]. However, no large-scale studies to date have specifically evaluated the relationship between PAD and variability in glycemic level, as measured by FPG-CV. Therefore, this large, retrospective cohort study investi-gated whether variability in glycemic level, as estimated by FPG-CV, has independent and significant associations with PAD in persons with type 2 diabetes.
Methods
Study population
Our data were extracted from 2 nationwide, population-based databases. The National Diabetes Care Manage-ment Program (NDCMP) under the Taiwan National Health Insurance (NHI) system was used to obtain dia-betes outcome data for 2002–2004. In addition, the NHI administrative database was used for both baseline char-acteristics and follow-up assessments during the entry (or index) date and December 31, 2011. Additional finan-cial incentives provided by The NDCMP for high-quality healthcare services such as increased frequency of moni-toring, annual diabetes-related physical examinations and laboratory tests, and enhanced self-care education [15]. The program requires health care providers in the spe-cialties of nephrology, family medicine, endocrinology, cardiology, internal medicine, and others to participate in clinical training and education programs for certification in Taiwan’s Diabetes Shared Care system program. These providers become eligible for participation of this pro-gram and voluntarily enroll patients with diabetes to this program. The purpose of these continuing clinical train-ing and education programs is for enhanctrain-ing the quality of care through clinical practice standardization, includ-ing assessment and diagnosis of diabetes complications. The coordinated physician-led multidisciplinary teams, including physicians and medical care staff, are respon-sible for the care of patients with diabetes as adhering to established clinical guideline. A physical or history exam-ination suggestive of PAD required confirmed diagnosis by the ankle-brachial index (ABI) [16]. The physician-led multidisciplinary teams can refer patients requiring fur-ther diagnostic evaluation to a specialist.
A national retrospective cohort study, the Taiwan Diabetes Study, included 63,084 Chinese individuals with diabetes who participated in the NDCMP during 2002–2004. The index date was the NDCMP entry date. Individuals with a clinical diagnosis of diabetes accord-ing to the American Diabetes Association (ADA) criteria [International Classification of Diseases, ninth revision, Clinical Modification (ICD-9-CM) diagnosis code 250]
were invited by their physicians to enroll. The NDCMP initially included 63,084 diabetic patients during 2002– 2004. Of these, we excluded persons with PAD (ICD-9:443.9 or 440.21), type 1 diabetes (ICD-9: 250.x1/x3), or gestational diabetes (ICD-9: 648.83), and those aged < 30 years at baseline (Additional file 1: Figure S1).
Enrollees underwent comprehensive health assessment at the time of NDCMP entry to assess systolic blood pressure (SBP) and diastolic blood pressure (DBP), body measurements, blood and urine tests, and history of dis-eases and complications were also obtained. A standard-ized, computerized questionnaire was designed to collect information from all participants, which was adminis-tered by a case manager to record medication use, previ-ous or current disease status, and lifestyle habits. Blood was drawn from an antecubital vein in the morning after a 12-h overnight fast and was sent within 4 h for analy-sis of FPG, HbA1c, low-density lipoprotein-cholesterol (LDL-C), triglyceride (TG), high-density lipoprotein-cholesterol (HDL-C), and creatinine. The interval for fol-low-up was every 3–6 months. All patients repeated the tests on each follow-up anniversary as those performed during program entry.
Participants with missing data for lifestyle behaviors, sociodemographic and diabetes-related factors, dia-betic micro- and macrovascular complications, blood biochemical indices, and comorbidities were excluded. Those lost to follow-up and those with less than 3 months of follow-up including those with an entry date until PAD, death, or withdrawal from the NHI of less than 3 months were also excluded from the analysis. The last criterion was used to rule out the potential bias due to reverse causality. Finally, 30,932 patients were included in the study. The study protocol had been approved by the Ethical Review Board at China Medical University Hos-pital (CMUH102-REC3-016). Informed consent of the study participants was not required because the dataset used in this study consists of de-identified secondary data released for research purposes.
Data sources for assessments at baseline and follow‑up visits
and bias due to loss of follow-up was thus negligible. To enhance the validity of the claims data, the NHI Bureau in Taiwan sampled the medical charts on a routine basis every 3 months and anonymous experts randomly reviewed 50–100 inpatient and ambulatory care claims from each hospital and clinic, for improvement of the accuracy of coding [18]. The NDCMP was also covered by the NHI program. This study used the datasets for inpatient care based on admission and ambulatory care visits from 2002 to 2011. Every individual had a unique personal identification number (PIN). For privacy and security purposes, patient identity data in the NHI Research Database were cryptographically scrambled. Each patient was linked with the PIN in all NHI data-sets without being identified.
Ascertainment of outcome
The primary outcome was PAD, identified through record linkage with inpatient care and ambulatory care data in the NHI Research Database. The PAD incidence was based on coding according to the ICD-9-CM as 443.9 or 440.21. To enhance the accuracy of PAD diag-noses by excluding false positives, all PAD incidences met at least 1 of the following criteria: at least 1 inpa-tient or 3 ambulatory care claims. The study cohort was then followed up from the entry (index) date to Decem-ber 31, 2011, or until a PAD event, withdrawal from the NHI, or death. A total of 894 newly diagnosed PAD patients were identified with an average of 8.20 years of follow-up.
For the 1-year period preceding cohort entry, ambula-tory care and inpatient claims data were used to deter-mine comorbidities, based on at least 3 ambulatory care claims or 1 claim for inpatient admission, including coro-nary artery disease.
Comorbidities within 12 months prior to the index date were tabulated using outpatient and inpatient claims data, based on at least 3 ambulatory care claims or 1 inpatient care claim. Any history of hypoglycemia (ICD-9-CM codes 250, 251.0–251.2), hyperlipidemia (ICD-9-CM code 272), hypertension (ICD-9-CM codes 401–405), atrial fibrillation (ICD-9-CM code 427.31), coronary artery disease (CAD) (ICD-9-CM codes 410– 413, 414.01–414.05, 414.8, and 414.9), congestive heart failure (CHF) (ICD-9-CM codes 428, 398.91, and 402.x1), chronic hepatitis (ICD-9-CM codes 571, 572.2, 572.3, 572.8, 573.1, 573.2, 573.3, 573.8, and 573.9), cancer (ICD-9-CM codes 140–149, 150–159, 160–165, 170–175, 179– 189, 190–199, 200, 202, 203, 210–213, 215–229, 235–239, 654.1, 654.10, 654.11, 654.12, 654.13, and 654.14), albu-minuria 9-CM code 791.0), retinopathy (ICD-9-CM codes 250.5 and 362.0), or chronic obstructive
pulmonary disease (COPD) (ICD-9-CM codes 490–496) was recognized as a comorbidity.
Statistical analysis
The FPG-CV measurements for each patient from ambu-latory visits within the 1st year of the entry (index) date were calculated for those with more than 2 FPG results. The average number of FPG measurements for this sam-ple was 3.07, with a standard deviation of 0.95. The FPG-CV was divided by the square root of the ratio of total visits, divided by total visits minus 1 to correct for impact of the number of visits might on variation [19]. The mul-tiple imputation approach was applied to handle missing CVs [20, 21]. Patients were grouped into tertiles accord-ing to FPG-CV. The extended Cox proportional hazards model with the Lunn-McNeil method was employed to weigh competing risks of PAD, and all-cause mortality was assessed by fitting a proportional sub-distribution hazards regression model focusing on cause-specific haz-ards for a competing risk of death [22]. Age, sex, and tra-ditional variables were adjusted to compute hazard ratios (HRs) and their corresponding 95% confidence intervals (CIs). FPG-CV and HbA1c were assessed simultaneously with 3 multivariate models, with covariates being entered in hierarchical order: (1) adjustment for age (continuous) and sex; (2) additional adjustment for alcohol consump-tion (yes/no), smoking and tobacco use (yes/no), diabe-tes duration, antihypertensive treatment (yes/no), type of hypoglycemic drugs (no medication, 1 oral hypoglyce-mic drug, combination of 2, 3, or > 3 oral hypoglycehypoglyce-mic drugs, insulin monotherapy, and insulin plus oral hypo-glycemic drugs), and obesity defined as body mass index
≥ 27 kg/m2, the obesity criteria of the Ministry of Health
Results
There were 894 incident cases of PAD after an average 8.2 years of follow-up with a crude incidence of 3.53 per 1000 person-years (3.63 for men, 3.44 for women).
The incidence of PAD was 2.93, 3.61, and 4.06 per 1000 person-years in the first, second, and third tertiles of FPG-CV, respectively. The Pearson correlation coeffi-cient between HbA1c and FPG-CV was 0.235, showing
Table 1 Baseline characteristics according to peripheral vascular disease status in persons with type 2 diabetes enrolled in the National Diabetes Care Management Program, Taiwan (n = 30,932)
Differences in continuous variables were tested using the student’s t-test. Differences in categorical variables were tested using the Chi-square test or Fisher’s exact test
CHF congestive heart failure, CAD coronary artery disease, SBP systolic blood pressure, DBP diastolic blood pressure, COPD chronic obstructive pulmonary disease, HDL
high-density lipoprotein, TG triglyceride, eGFR estimated glomerular filtration rate, LDL low-density lipoprotein
Variables Peripheral vascular disease p value
No (N = 30,038) Yes (N = 894)
Socio‑demographic factors
Male, n (%) 14,008 (46.63) 421 (47.09) 0.81
Age (years), mean (SD) 60.99 (11.16) 61.73 (10.87) 0.05
Lifestyle behaviors, n (%)
Smoking 4517 (15.04) 143 (16.00) 0.46
Alcohol drinking 2518 (8.38) 67 (7.49) 0.38
Diabetes‑related variables
Duration of diabetes (years), mean (SD) 6.80 (6.75) 7.97 (7.41) < 0.001
Type of hypoglycemic drug use, n (%) 0.006
No medication 365 (1.22) 5 (0.56)
One oral hypoglycemic drug 5134 (17.09) 113 (12.64)
Two oral hypoglycemic drugs 12,536 (41.73) 353 (39.49)
Three oral hypoglycemic drugs 5537 (18.43) 175 (19.57)
> 3 oral hypoglycemic drugs 1575 (5.24) 59 (6.60)
Insulin 885 (2.95) 18 (2.01)
Insulin+ oral hypoglycemic drug 4006 (13.34) 171 (19.13)
Drug‑related variables, n (%)
Hypertension drug treatment 11,671 (38.85) 316 (35.35) 0.04
Comorbidity, n (%)
Obesity (BMI ≥ 27) 10,927 (36.38) 304 (34.00) 0.16
CAD 2603 (8.67) 99 (11.07) 0.01
Stroke 1519 (5.06) 52 (5.82) 0.35
CHF 785 (2.61) 19 (2.13) 0.43
Cancer 630 (2.10) 19 (2.13) 1.00
Hyperlipidemia 7621 (25.37) 220 (24.61) 0.63
Hypertension 13,736 (45.73) 397 (44.41) 0.45
Atrial fibrillation 150 (0.50) 3 (0.34) 0.81
Chronic hepatitis 2900 (9.65) 78 (8.72) 0.38
COPD 1365 (4.54) 42 (4.70) 0.89
Hypoglycemia 118 (0.39) 7 (0.78) 0.10
Albuminuria 297 (0.99) 6 (0.67) 0.44
Retinopathy 583 (1.94) 31 (3.47) 0.002
Cardiovascular risk factors, n (%)
SBP ≥ 130/DBP ≥85 (mmHg) 20,730 (69.01) 607 (67.90) 0.50
TG ≥ 150 (mg/dL) 13,075 (43.53) 397 (44.41) 0.63
HDL: female < 50; male < 40 (mg/dL) 15,595 (51.92) 448 (50.11) 0.30
LDL ≥ 100 (mg/dL) 20,929 (69.68) 618 (69.13) 0.75
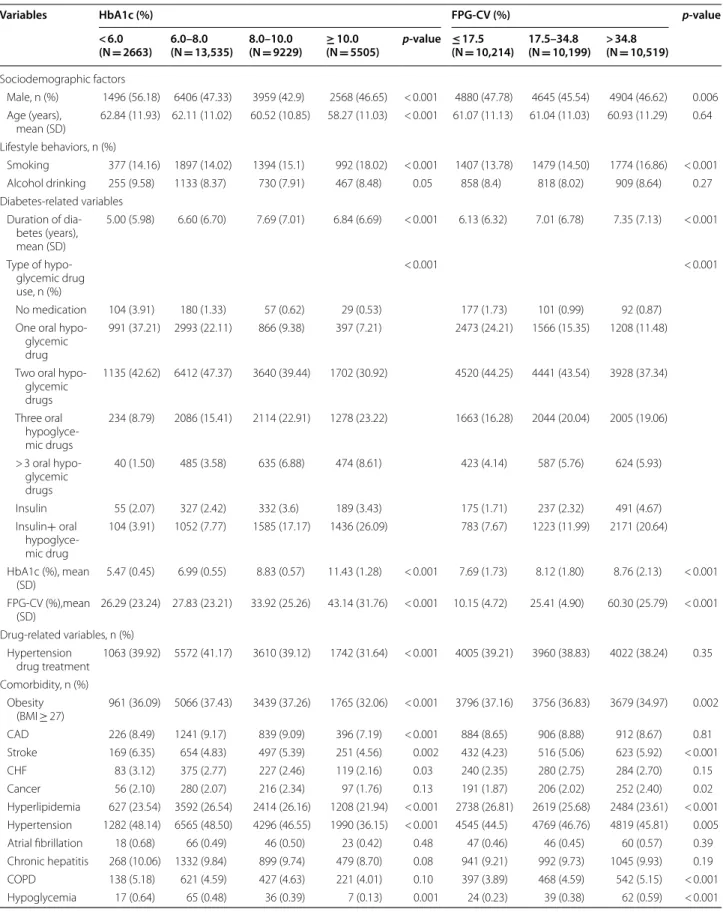
Table 2 Baseline characteristics based on HbA1c level and FPG-CV in patients with type 2 diabetes enrolled in the National Diabetes Care Management Program, Taiwan (n = 30,932)
Variables HbA1c (%) FPG‑CV (%) p‑value
< 6.0
(N = 2663) 6.0–8.0 (N = 13,535) 8.0–10.0 (N = 9229) ≥(N 10.0 = 5505) p‑value ≤(N 17.5 = 10,214) 17.5–34.8 (N = 10,199) > 34.8 (N = 10,519)
Sociodemographic factors
Male, n (%) 1496 (56.18) 6406 (47.33) 3959 (42.9) 2568 (46.65) < 0.001 4880 (47.78) 4645 (45.54) 4904 (46.62) 0.006 Age (years),
mean (SD) 62.84 (11.93) 62.11 (11.02) 60.52 (10.85) 58.27 (11.03) < 0.001 61.07 (11.13) 61.04 (11.03) 60.93 (11.29) 0.64 Lifestyle behaviors, n (%)
Smoking 377 (14.16) 1897 (14.02) 1394 (15.1) 992 (18.02) < 0.001 1407 (13.78) 1479 (14.50) 1774 (16.86) < 0.001 Alcohol drinking 255 (9.58) 1133 (8.37) 730 (7.91) 467 (8.48) 0.05 858 (8.4) 818 (8.02) 909 (8.64) 0.27 Diabetes‑related variables
Duration of dia‑ betes (years), mean (SD)
5.00 (5.98) 6.60 (6.70) 7.69 (7.01) 6.84 (6.69) < 0.001 6.13 (6.32) 7.01 (6.78) 7.35 (7.13) < 0.001
Type of hypo‑ glycemic drug use, n (%)
< 0.001 < 0.001
No medication 104 (3.91) 180 (1.33) 57 (0.62) 29 (0.53) 177 (1.73) 101 (0.99) 92 (0.87) One oral hypo‑
glycemic drug
991 (37.21) 2993 (22.11) 866 (9.38) 397 (7.21) 2473 (24.21) 1566 (15.35) 1208 (11.48)
Two oral hypo‑ glycemic drugs
1135 (42.62) 6412 (47.37) 3640 (39.44) 1702 (30.92) 4520 (44.25) 4441 (43.54) 3928 (37.34)
Three oral hypoglyce‑ mic drugs
234 (8.79) 2086 (15.41) 2114 (22.91) 1278 (23.22) 1663 (16.28) 2044 (20.04) 2005 (19.06)
> 3 oral hypo‑ glycemic drugs
40 (1.50) 485 (3.58) 635 (6.88) 474 (8.61) 423 (4.14) 587 (5.76) 624 (5.93)
Insulin 55 (2.07) 327 (2.42) 332 (3.6) 189 (3.43) 175 (1.71) 237 (2.32) 491 (4.67) Insulin+ oral
hypoglyce‑ mic drug
104 (3.91) 1052 (7.77) 1585 (17.17) 1436 (26.09) 783 (7.67) 1223 (11.99) 2171 (20.64)
HbA1c (%), mean
(SD) 5.47 (0.45) 6.99 (0.55) 8.83 (0.57) 11.43 (1.28) < 0.001 7.69 (1.73) 8.12 (1.80) 8.76 (2.13) < 0.001 FPG‑CV (%),mean
(SD) 26.29 (23.24) 27.83 (23.21) 33.92 (25.26) 43.14 (31.76) < 0.001 10.15 (4.72) 25.41 (4.90) 60.30 (25.79) < 0.001 Drug‑related variables, n (%)
Hypertension
drug treatment 1063 (39.92) 5572 (41.17) 3610 (39.12) 1742 (31.64) < 0.001 4005 (39.21) 3960 (38.83) 4022 (38.24) 0.35 Comorbidity, n (%)
Obesity
a positive weak relationship. The baseline characteris-tics grouped according to PAD status was presented in Table 1. There were differences according to diabetes duration, type of hypoglycemic medication use, hyper-tension medication, CAD, and retinopathy.
Table 2 shows baseline characteristics in participants grouped according to tertiles of FPG-CV. Persons with lower FPG-CV were found to be associated with higher proportion of male and obesity, lower mean diabetes duration and HbA1c, and lower prevalence of smoking, 3 or more oral hypoglycemic drug use, insulin injec-tions, insulin injections plus oral hypoglycemic drug use, stroke, cancer, hypertension, COPD, and hypoglycemia, as well as higher prevalence of 1 oral hypoglycemic drug use, 2 oral hypoglycemic drug use, and hyperlipidemia. Figure 1 depicts the cumulative risk for PAD estimated by Kaplan–Meier method within subgroups defined by HbA1c and FPG-CV; patients with HbA1c ≥ 10% or
FPG-CV > 34.8% had an increased risk of PAD (both log-rank tests p < 0.001).
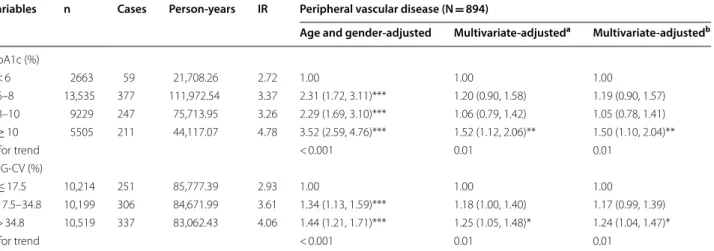
Table 3 shows the HRs of PAD based on subgroups of FPG-CV, with and without adjustment for lifestyles, FPG, and comorbidity. FPG-CV was associated with PAD risks. We observed an independent association between FPG-CV in the third tertile and PAD incidence in the third multivariate model, with an HR of 1.24 (95% CI 1.04–1.47), and found that HbA1c ≥ 10% was also
independently associated with increased PAD risk (HR: 1.50, 95% CI 1.00–2.40, p < 0.05). With using restricted cubic splines, we observed a non-linear increasing asso-ciation between HbA1c and risk of PAD, with leveling off at 6-9%; a linear increasing trend for FPG-CV was also observed, with leveling off at ≥ 35% (Fig. 2). Based on the
statistics of likelihood ratio tests for HbA1c and FPG-CV, we found HbA1c had a higher predictive power on PAD than FPG-CV (12.51 vs. 6.0) whereas FPG-CV had a higher predictive power on death (54.62 vs 112.69).
Sensitivity analysis demonstrated that the PAD HRs remained similar for patients in the second to third ter-tiles of FPG-CV [1.01 (95% CI 1.02–1.44) and 1.27 (95% CI 1.07–1.52)]. The linear trend for the risk of PAD remained significant for FPG-CV, even after patients with various types of comorbidity were excluded (p for trend = 0.006) (Table 4).
Discussion
This study investigated HbA1c levels and FPG variability in relation to PAD in persons with type 2 diabetes. We identified a non-conventional risk factor, FPG-CV, was associated with greater risk for PAD in persons with type 2 diabetes during a follow-up period of 8.2 years. Moreo-ver, our findings demonstrated an association between FPG-CV and PAD incidence, independent of HbA1c. These findings remained consistent in sensitivity analysis by excluding potential confounders, demonstrating the robustness of our study results.
Our study’s strengths include use of a large national population database of type 2 diabetes cases, a retrospec-tive cohort study design with a relaretrospec-tively long follow-up period, standard data collection procedures, and adjusted for a large numbers of candidate confounders, which fur-ther validate our results. Our findings are crucial to the clinical management of PAD in type 2 diabetes. First, gly-cemic variability as determined by FPG-CV levels may be considered an additional non-conventional risk factor for PAD in type 2 diabetes. Second, the current practice Differences in continuous variables tested by ANOVA. Differences in categorical variables tested by chi-square or Fisher’s exact test
CHF congestive heart failure, CAD coronary artery disease, SBP systolic blood pressure, DBP diastolic blood pressure, COPD chronic obstructive pulmonary disease, HDL
high-density lipoprotein, TG triglyceride, eGFR estimated glomerular filtration rate, LDL low-density lipoprotein
Table 2 (continued)
Variables HbA1c (%) FPG‑CV (%) p‑value
< 6.0
(N = 2663) 6.0–8.0 (N = 13,535) 8.0–10.0 (N = 9229) ≥(N 10.0 = 5505) p‑value ≤(N 17.5 = 10,214) 17.5–34.8 (N = 10,199) > 34.8 (N = 10,519)
Cardiovascular risk factors, n (%) SBP ≥ 130/
DBP ≥ 85 (mmHg)
1811 (68.01) 9480 (70.04) 6459 (69.99) 3587 (65.16) < 0.001 7056 (69.08) 7044 (69.07) 7237 (68.80) 0.88
TG ≥ 150 (mg/dL) 934 (35.07) 5460 (40.34) 4319 (46.8) 2759 (50.12) < 0.001 4166 (40.79) 4390 (43.04) 4916 (46.73) < 0.001 HDL: female < 50;
male < 40 (mg/ dL)
1315 (49.38) 7036 (51.98) 4955 (53.69) 2737 (49.72) < 0.001 5178 (50.7) 5358 (52.53) 5507 (52.35) 0.01
LDL ≥ 100 (mg/
dL) 1688 (63.39) 9228 (68.18) 6521 (70.66) 4110 (74.66) < 0.001 7202 (70.51) 7056 (69.18) 7289 (69.29) 0.07 eGFR < 60 (mL/
Risk of peripheral vascular disease
0.00 0.01 0.02 0.03 0.04
Follow−up time (Years)
0 HBA1c (%) <6 2663 6−8 13535 8−10 9229 >=10 5505
1 No. at Risk
2635 13416
9145 5428
2
2568 13125 8929 5285
3
2507 12831
8711 5145
4
2433 12490
8489 4977
5
2344 12166
8246 4805
6
2274 11808
7975 4627
7
2189 11419
7693 4447
HbA1c (%) <6 6−8 8−10 >=10
Risk of peripheral vascular disease
0.00 0.01 0.02 0.03
Follow−up time (Years)
0 PFG−CV (%) =<17.5 10214 17.5−34.8 10122 >34.8 10365
1 No. at Risk
10137 10122 10365
2 9961 9912 10034
3 9773 9707 9714
4 9575 9458 9356
5 9375 9200 8986
6 9136 8894 8654
7 8900 8588 8260
PFG−CV (%) =<17.5 17.5−34.8 >34.8
a
b
of relying mainly on HbA1c alone but not glycemic vari-ability may be inadequate. It may be necessary to achieve both a glycemic target and glycemic control stability. Fur-ther well-designed studies are warranted to determine whether minimizing glycemic variability has a crucial impact on PAD development in type 2 diabetes.
PAD increases diabetes-related complications; there-fore, recognizing the risk factors for PAD is crucial [4, 23]. Prior studies’ evidence indicates elevated HbA1c is an independent determinant for PAD in type 2 DM. The present study confirms previous findings that elevated HbA1c is an independent factor for PAD in persons with type 2 diabetes [1, 3, 23, 24]. Nonetheless, studies on the benefit of lowering blood glucose alone, using HbA1c as a therapeutic target, did not show improvement in clau-dication symptoms or slowing of PAD progression in type 2 diabetes [25]. Interpretation of this finding is com-plicated, partly because HbA1c level merely presents the average blood glucose in the preceding 8–12 weeks and fails to reflect variability in glycemia, which may indicate an additional factor for development of diabetic vascular complications independent of HbA1c [6, 26]. Our results add to the emerging concept that glycemic variability as determined by FPG-CV confers additional risk of PAD, indicating the need for further research.
Numerous processes are linked to the development of PAD, which is considered a marker of systemic ath-erosclerosis [1, 3, 23, 24]. Conventional atherosclerotic risk factors, consisting of age, diabetes, smoking, hyper-tension, dyslipidemia, microalbuminuria, and obesity
are associated with PAD [3, 4, 23, 27]. Several potential mechanisms may link glycemic variability to the occur-rence of PAD from a pathophysiological point of view. First, evidence has suggested that oscillating glucose may trigger increases in oxidative stress, endothelial dys-function or damage, advanced glycation end-products and inflammatory cytokines, resulting in a higher rate of occurrence and acceleration of atherosclerosis inde-pendently of sustained hyperglycemia [12–14, 28–33]. Second, A relationship of cardiovascular autonomic dys-function with atherosclerosis has been observed [34, 35]. Exaggerated glycemic fluctuations were demonstrated to adversely affect endothelial vessel hearing with result of hypoxia and blood flow disorders in neuronal cells, which may lead to autonomic dysfunction [36]. Previ-ous study has revealed that patients with type 2 diabetes with PAD had lower heart rate variability (HRV) indi-ces than patients without PAD, which reflects a cardio-vascular autonomic dysfunction [34]. Moreover, visit to visit variability in FPG could be an important risk factor for long term changes in left cardiac structure and func-tion in patients with type 2 DM [37]. In this regard, the associations between PAD and cardiovascular autonomic dysfunction could be partly explained by glycemic fluc-tuations. Third, glycemic fluctuations might cause insulin resistance, beta cell dysfunction and apoptosis, induc-ing cellular metabolic memory, and epigenetic changes [12–14, 38]. According to these findings, we hypothesize that variability in glycemia may be a crucial pathologi-cal mechanism in PAD. Future research is warranted to
Table 3 Hazard ratios (HRs) of peripheral vascular disease based on HbA1c and FPG-CV levels in persons with diabetes
enrolled in the National Diabetes Care Management Program, Taiwan (n = 30,932)
Multivariate-adjusteda for age, gender, alcohol consumption, smoking, diabetes duration, type of hypoglycemic medication, hypertension medication and obesity
Multivariate-adjustedb for cardiovascular risk factors, stroke, coronary artery disease, cancer, congestive heart failure, hyperlipidemia, atrial fibrillation, hypertension,
chronic hepatitis, hypoglycemia and chronic obstructive pulmonary disease in addition to the variables in first multivariate model
IR incidence density rate = number of incident cases/person-years * 1000 * p < 0.05; ** p < 0.01; *** p < 0.001
Variables n Cases Person‑years IR Peripheral vascular disease (N = 894)
Age and gender‑adjusted Multivariate‑adjusteda Multivariate‑adjustedb
HbA1c (%)
< 6 2663 59 21,708.26 2.72 1.00 1.00 1.00
6–8 13,535 377 111,972.54 3.37 2.31 (1.72, 3.11)*** 1.20 (0.90, 1.58) 1.19 (0.90, 1.57) 8–10 9229 247 75,713.95 3.26 2.29 (1.69, 3.10)*** 1.06 (0.79, 1.42) 1.05 (0.78, 1.41) ≥ 10 5505 211 44,117.07 4.78 3.52 (2.59, 4.76)*** 1.52 (1.12, 2.06)** 1.50 (1.10, 2.04)**
p for trend < 0.001 0.01 0.01
FPG‑CV (%)
≤ 17.5 10,214 251 85,777.39 2.93 1.00 1.00 1.00
17.5–34.8 10,199 306 84,671.99 3.61 1.34 (1.13, 1.59)*** 1.18 (1.00, 1.40) 1.17 (0.99, 1.39) > 34.8 10,519 337 83,062.43 4.06 1.44 (1.21, 1.71)*** 1.25 (1.05, 1.48)* 1.24 (1.04, 1.47)*
2
4
6
8
10
12
14
16
HbA1c (%)
0
1
2
3
4
Hazard ratio (95% CI)
Peripheral vascular disease
0
5
10
15
20
25
30
35
40
45
50
PFG−CV (%)
0.6
0.8
1.0
1.2
1.4
1.6
Hazard ratio (95% CI
)
Peripheral vascular disease
a
b
explore the plausible biological mechanism by which gly-cemic variability contributes to the pathogenesis of PAD.
The current study has several limitations. First, given its observational nature, the possibility of selection bias and unrecognized confounding variables may have affected the findings, despite use of multivariate regres-sion analysis. Second, glycemic variability can be assessed
Table 4 Sensitivity analyses for evaluating the potential bias due to comorbidities, by excluding persons with diabetic ketoacidosis, hyperglycemic hyperosmolar nonketotic coma, atrial fibrillation, myocardial infarction, and hypoglycemia
Variables n Cases Person‑years IR Multivariate‑
adjusted HR 95% CI
Model I HbA1c (%)
< 6 2607 56 21,284.98 2.63 1.00
6–8 13,335 368 110,444.51 3.33 1.21 (0.91, 1.61) 8–10 9077 242 74,554.23 3.25 1.07 (0.79, 1.45) ≥ 10 5386 205 43,260.94 4.74 1.53 (1.11, 2.09)**
p for trend 0.01
FPG‑CV (%)
≤ 17.5 10,074 244 84,668.74 2.88 1.00
17.5–34.8 10,048 303 83,481.24 3.63 1.19 (1.01, 1.42)* > 34.8 10,283 324 81,394.68 3.98 1.23 (1.04, 1.47)*
p for trend 0.02
Model II HbA1c (%)
< 6 2629 58 21,421.83 2.71 1.00
6–8 13,412 372 110,998.85 3.35 1.18 (0.89, 1.56) 8–10 9144 245 75,038.39 3.26 1.04 (0.77, 1.40) ≥ 10 5436 211 43,554.03 4.84 1.51 (1.11, 2.05)**
p for trend 0.01
FPG‑CV (%)
≤ 17.5 10,126 246 85,067.16 2.89 1.00
17.5–34.8 10,105 304 83,885.01 3.62 1.19 (1.00, 1.41)* > 34.8 10,390 336 82,060.93 4.09 1.26 (1.06, 1.50)**
p for trend 0.007
Model III HbA1c (%)
< 6 2604 59 21,261.14 2.78 1.00
6–8 13,181 372 109,131.66 3.41 1.18 (0.89, 1.57) 8–10 8981 245 73,772.11 3.32 1.05 (0.78, 1.41) ≥ 10 5365 204 43,072.94 4.74 1.47 (1.08, 2.00)*
p for trend 0.02
FPG‑CV (%)
≤ 17.5 9968 248 83,751.3 2.96 1.00
17.5–34.8 9938 301 82,597.88 3.64 1.17 (0.99, 1.39) > 34.8 10,225 331 80,888.67 4.09 1.24 (1.04, 1.47)*
p for trend 0.01
Model IV HbA1c (%)
< 6 2645 59 21,577.48 2.73 1.00
6–8 13,469 374 111,541.73 3.35 1.18 (0.89, 1.56) 8–10 9183 247 75,373.75 3.28 1.05 (0.78, 1.41) ≥ 10 5482 211 43,970.42 4.80 1.50 (1.11, 2.04)**
p for trend 0.01
FPG‑CV (%)
Table 4 (continued)
Variables n Cases Person‑years IR Multivariate‑
adjusted HR 95% CI
≤ 17.5 10,167 249 85,419.13 2.92 1.00
17.5–34.8 10,153 305 84,359.17 3.62 1.18 (0.99, 1.39) > 34.8 10,459 337 82,685.08 4.08 1.25 (1.05, 1.48)*
p for trend 0.009
Model V HbA1c (%)
< 6 2646 59 21,595.5 2.73 1.00
6–8 13,470 372 111,547.16 3.33 1.17 (0.88, 1.54) 8–10 9193 246 75,477.85 3.26 1.03 (0.77, 1.39) ≥ 10 5498 210 44,089.87 4.76 1.46 (1.08, 1.99)*
p for trend 0.02
FPG‑CV (%)
≤ 17.5 10,190 248 85,621.37 2.90 1.00
17.5–34.8 10,160 304 84,395.44 3.60 1.18 (1.00, 1.40) > 34.8 10,457 335 82,693.58 4.05 1.25 (1.05, 1.48)*
p for trend 0.008
Model VI HbA1c (%)
< 6 2500 56 20,470.2 2.74 1.00
6–8 12,803 352 106,329.25 3.31 1.15 (0.86, 1.54) 8–10 8716 239 71,749.68 3.33 1.06 (0.78, 1.43) ≥ 10 5185 197 41,763.28 4.72 1.46 (1.06, 2.00)*
p for trend 0.02
FPG‑CV (%)
≤ 17.5 9734 235 81,922.2 2.87 1.00
17.5–34.8 9657 293 80,391.77 3.64 1.21 (1.02, 1.44)* > 34.8 9813 316 77,998.43 4.05 1.27 (1.07, 1.52)**
p for trend 0.006
Multivariate-adjusted for age, gender, alcohol consumption, smoking, diabetes duration, type of hypoglycemic medication, hypertension medication, obesity cardiovascular risk factors, stroke, coronary artery disease, cancer, congestive heart failure, hyperlipidemia, atrial fibrillation, hypertension, chronic hepatitis, hypoglycemia and chronic obstructive pulmonary disease
Model I: persons with HHNK being excluded (N = 527) Model II: persons with DKA being excluded (N = 311)
Model III: persons with myocardial infarction being excluded (N = 801) Model IV: persons with atrial fibrillation being excluded (N = 153) Model V: persons with hypoglycemia being excluded (N = 125)
Model VI: persons with HHNK, DKA, myocardial infarction, atrial fibrillation and hypoglycemia being excluded (N = 1728)
using a variety of methods, and FPG-CV is only one such method. To date, there is little consensus about a preferred method for assessment of the role of glycemic variability in diabetic complications. Methods for precise measurement of glycemic variability are also needed to compare the predictive ability of each method for dia-betic complications including PAD [6, 39]. Third, we only considered the 1st-year FPG-CV and could not consider time-varying FPG-CV because the data was not availabil-ity. FPG-CV may have been changeable, while the doc-tors are treating. Thus, we examined the concordance of DM treatment between the 1st year and the 2nd year after entry to the study and found all types of anti-dia-betes medications use had agreement greater than 90%, ranging from 94 to 99%. Fourth, the diagnosis of PAD was not validated through reviewing medical records and was only determined by ICD codes, and thus relied on the accuracy of diagnostic in our database. The NHI Bureau in Taiwan selects a sample of medical records routinely and endeavors to verify the accuracy of diag-noses in the database, thereby improving the accuracy of coding [17, 18]. The insurance claims are routinely scru-tinized by medical specialists under anonymous peer review based on standard diagnostic criteria, and coding errors are penalized. Further, to improve accurate diag-nosis of PAD, we included only those incident cases in which medical service was administered for PAD during either ≥ 3 outpatient visits or ≥ 1 hospitalization. Simi-lar methods for PAD ascertainment have been adopted by previous studies [40, 41]. Fifth, PAD is often asymp-tomatic [42], and asymptomatic PAD or mild PAD symp-toms might have been overlooked. Therefore, the risk of PAD could be underestimated. In this study, we only con-sidered patients with symptoms and those seeking medi-cal care, i.e., those diagnosed in clinimedi-cal practice. Fifth, the effects of glycemic variability on PAD severity were not examined. Further studies are needed to determine whether the effects of glycemic variability are correlated with ABI severity. Finally, all of our study subjects in our study were ethnic Chinese from Taiwan, and generaliz-ability of our results to other ethnic groups needs to be further confirmed.
Conclusions
Both visit-to-visit variability in glycemia, determined by FPG-CV level, and HbA1c represented risk factors for PAD besides other conventional risk factors in per-sons with type 2 diabetes. Our study’s findings show that HbA1c level and glucose fluctuation may be tar-geted for PAD prevention in type 2 diabetes. Further study is required to clarify the underlying mechanisms and verify whether FPG-CV or HbA1c level is a valu-able therapeutic target.
Supplementary information
Supplementary information accompanies this paper at https ://doi. org/10.1186/s1293 3‑019‑0978‑y.
Additional file 1: Figure S1. Flow chart of recruitment procedures for the study. Table S1. Hazard ratios (HRs) of peripheral vascular disease based on HbA1c and FPG‑CV levels in persons with diabetes enrolled in the National Diabetes Care Management Program, Taiwan (n=30,932).
Acknowledgements
This study was funded primarily by the Bureau of National Health Insurance (DOH94‑NH‑1007), the Ministry of Science and Technology of Taiwan (MOST 104‑2314‑B‑039‑016, MOST 105‑2314‑B‑039‑021‑MY3, MOST 105‑2314‑B‑039‑ 025‑MY3, MOST 107‑2314‑B‑039‑049, MOST 108‑2314‑B‑039‑039, MOST 108‑2314‑B‑039‑035‑MY3 and MOST 108‑2314‑B‑039‑031‑MY2), and China Medical University (CMU108‑S‑07).
Authors’ contributions
CPY, TCL, and CCL contributed equally to the design of the study and the direction of its implementation, including supervision of the field activi‑ ties, quality assurance and control. CSL, CHL, and KLH supervised the field activities. CPY and CCL helped conduct the literature review and prepare the Methods and the Discussion sections of the text. TCL, CIL, and SYY designed the study’s analytic strategy and conducted the data analysis. All authors read and approved the final manuscript.
Funding
Not applicable.
Availability of data and materials
The datasets generated and/or analyzed during the current study are not publicly available due to the policy declared by National Health Insurance in Taiwan but are available from the corresponding author on reasonable request.
Ethics approval and consent to participate
This study was approved by the Ethical Review Board of China Medical University Hospital (CMUH102‑REC3‑016). Informed consent of the study participants was not required because the dataset used in this study consists of de‑identified secondary data released for research purposes.
Consent for publication
Not applicable.
Competing interests
The authors declare that they have no competing interests.
Author details
1 Department of Neurology, Kuang Tien General Hospital, Taichung, Taiwan. 2 Department of Nutrition, Huang‑Kuang University, Taichung, Taiwan. 3 School of Medicine, College of Medicine, China Medical University, Tai‑ chung, Taiwan. 4 Department of Medical Research, China Medical University Hospital, Taichung, Taiwan. 5 Department of Family Medicine, China Medical University Hospital, Taichung, Taiwan. 6 Department of Public Health, Chung Shan Medical University, Taichung, Taiwan. 7 Department of Public Health, College of Public Health, China Medical University, 91 Hsueh‑Shih Road, Taichung 40421, Taiwan. 8 Department of Healthcare Administration, College of Health Science, Asia University, Taichung, Taiwan.
Received: 13 October 2019 Accepted: 24 December 2019
References
2. Shu J, Santulli G. Update on peripheral artery disease: epidemiology and evidence‑based facts. Atherosclerosis. 2018;275:379–81.
3. Fowkes FG, Rudan D, Rudan I, Aboyans V, Denenberg JO, McDermott MM, Norman PE, Sampson UK, Williams LJ, Mensah GA, et al. Comparison of global estimates of prevalence and risk factors for peripheral artery dis‑ ease in 2000 and 2010: a systematic review and analysis. Lancet (London, England). 2013;382(9901):1329–40.
4. Kullo IJ, Rooke TW. CLINICAL PRACTICE. Peripheral artery disease. N Engl J Med. 2016;374(9):861–71.
5. Nalysnyk L, Hernandez‑Medina M, Krishnarajah G. Glycaemic vari‑ ability and complications in patients with diabetes mellitus: evidence from a systematic review of the literature. Diabetes Obes Metab. 2010;12(4):288–98.
6. Gorst C, Kwok CS, Aslam S, Buchan I, Kontopantelis E, Myint PK, Heatlie G, Loke Y, Rutter MK, Mamas MA. Long‑term glycemic variability and risk of adverse outcomes: a systematic review and meta‑analysis. Diabetes Care. 2015;38(12):2354–69.
7. Muggeo M, Zoppini G, Bonora E, Brun E, Bonadonna RC, Moghetti P, Verlato G. Fasting plasma glucose variability predicts 10‑year survival of type 2 diabetic patients: the Verona Diabetes Study. Diabetes Care. 2000;23(1):45–50.
8. Lin CC, Yang CP, Li CI, Liu CS, Chen CC, Lin WY, Hwang KL, Yang SY, Li TC. Visit‑to‑visit variability of fasting plasma glucose as predictor of ischemic stroke: competing risk analysis in a national cohort of Taiwan Diabetes Study. BMC Med. 2014;12:165.
9. Lin CC, Li CI, Liu CS, Lin WY, Chen CC, Yang SY, Lee CC, Li TC. Annual fasting plasma glucose variation increases risk of cancer incidence and mortality in patients with type 2 diabetes: the Taichung Diabetes Study. Endocr Relat Cancer. 2012;19(4):473–83.
10. Li TC, Yang CP, Tseng ST, Li CI, Liu CS, Lin WY, Hwang KL, Yang SY, Chiang JH, Lin CC. Visit‑to‑Visit variations in fasting plasma glucose and HbA1c associated with an increased risk of Alzheimer disease: Taiwan Diabetes Study. Diabetes Care. 2017;40(9):1210–7.
11. Yang CP, Li CI, Liu CS, Lin WY, Hwang KL, Yang SY, Li TC, Lin CC. Variability of fasting plasma glucose increased risks of diabetic polyneuropathy in T2DM. Neurology. 2017;88(10):944–51.
12. Piconi L, Quagliaro L, Assaloni R, Da Ros R, Maier A, Zuodar G, Ceriello A. Constant and intermittent high glucose enhances endothelial cell apop‑ tosis through mitochondrial superoxide overproduction. Diabetes Metab Res Rev. 2006;22(3):198–203.
13. Azuma K, Kawamori R, Toyofuku Y, Kitahara Y, Sato F, Shimizu T, Miura K, Mine T, Tanaka Y, Mitsumata M, et al. Repetitive fluctuations in blood glucose enhance monocyte adhesion to the endothelium of rat thoracic aorta. Arterioscler Thromb Vasc Biol. 2006;26(10):2275–80.
14. Quagliaro L, Piconi L, Assaloni R, Martinelli L, Motz E, Ceriello A. Intermit‑ tent high glucose enhances apoptosis related to oxidative stress in human umbilical vein endothelial cells: the role of protein kinase C and NAD(P)H‑oxidase activation. Diabetes. 2003;52(11):2795–804. 15. Chen TT, Chung KP, Lin IC, Lai MS. The unintended consequence of dia‑
betes mellitus pay‑for‑performance (P4P) program in Taiwan: are patients with more comorbidities or more severe conditions likely to be excluded from the P4P program? Health Serv Res. 2011;46(1 Pt 1):47–60. 16. Gerhard‑Herman MD, Gornik HL, Barrett C, Barshes NR, Corriere MA,
Drachman DE, Fleisher LA, Fowkes FG, Hamburg NM, Kinlay S, et al. 2016 AHA/ACC guideline on the management of patients with lower extremity peripheral artery disease: a Report of the American College of Cardiology/American Heart Association Task Force on Clinical Practice Guidelines. Circulation. 2017;135(12):e726–79.
17. Wen CP, Tsai SP, Chung WS. A 10‑year experience with universal health insurance in Taiwan: measuring changes in health and health disparity. Ann Intern Med. 2008;148(4):258–67.
18. The National Health Insurance Statistics; 2014. https ://www.nhi.gov.tw/ engli sh/Conte nt_List.aspx?n=8162E D7256 773F4 5&topn=616B9 7F8DF 2C361 4. Accessed 20 Nov 2019.
19. Kilpatrick ES, Rigby AS, Atkin SL. A1C variability and the risk of microvas‑ cular complications in type 1 diabetes: data from the Diabetes Control and Complications Trial. Diabetes Care. 2008;31(11):2198–202. 20. Rubin DB. Multiple imputation for nonresponse in surveys. New York:
Wiley; 1987.
21. Schafer J. Analysis of incomplete multivariate data. London: Chapman & Hall; 1997.
22. Lunn M, McNeil D. Applying Cox regression to competing risks. Biomet‑ rics. 1995;51(2):524–32.
23. Olin JW, Sealove BA. Peripheral artery disease: current insight into the disease and its diagnosis and management. Mayo Clin Proc. 2010;85(7):678–92.
24. Criqui MH, Aboyans V. Epidemiology of peripheral artery disease. Circ Res. 2015;116(9):1509–26.
25. UK Prospective Diabetes Study (UKPDS) Group. Intensive blood‑glucose control with sulphonylureas or insulin compared with conventional treat‑ ment and risk of complications in patients with type 2 diabetes (UKPDS 33). Lancet (London, England). 1998;352(9131):837–53.
26. Smith‑Palmer J, Brandle M, Trevisan R, Orsini Federici M, Liabat S, Valen‑ tine W. Assessment of the association between glycemic variability and diabetes‑related complications in type 1 and type 2 diabetes. Diabetes Res Clin Pract. 2014;105(3):273–84.
27. Kosiborod M, Gomes MB, Nicolucci A, Pocock S, Rathmann W, Shestakova MV, Watada H, Shimomura I, Chen H, Cid‑Ruzafa J, et al. Vascular compli‑ cations in patients with type 2 diabetes: prevalence and associated fac‑ tors in 38 countries (the DISCOVER study program). Cardiovasc Diabetol. 2018;17(1):150.
28. Takahashi H, Iwahashi N, Kirigaya J, Kataoka S, Minamimoto Y, Gohbara M, Abe T, Okada K, Matsuzawa Y, Konishi M, et al. Glycemic variability deter‑ mined with a continuous glucose monitoring system can predict prog‑ nosis after acute coronary syndrome. Cardiovasc Diabetol. 2018;17(1):116. 29. Teliti M, Cogni G, Sacchi L, Dagliati A, Marini S, Tibollo V, De Cata P, Bellazzi R, Chiovato L. Risk factors for the development of micro‑vascular compli‑ cations of type 2 diabetes in a single‑centre cohort of patients. Diabetes Vasc Dis Res. 2018;15(5):424–32.
30. Magri CJ, Mintoff D, Camilleri L, Xuereb RG, Galea J, Fava S. Rela‑ tionship of hyperglycaemia, hypoglycaemia, and glucose vari‑ ability to atherosclerotic disease in type 2 diabetes. J Diabetes Res. 2018;2018:7464320–7464320.
31. Caprnda M, Mesarosova D, Ortega PF, Krahulec B, Egom E, Rodrigo L, Kru‑ zliak P, Mozos I, Gaspar L. Glycemic variability and vascular complications in patients with type 2 diabetes mellitus. Folia Med. 2017;59(3):270–8. 32. Lee M‑Y, Hsiao P‑J, Huang Y‑T, Huang J‑C, Hsu W‑H, Chen S‑C, Shin S‑J. Greater HbA1c variability is associated with increased cardiovascu‑ lar events in type 2 diabetes patients with preserved renal function, but not in moderate to advanced chronic kidney disease. PLoS ONE. 2017;12(6):e0178319–e0178319.
33. Dekker RG 2nd, Qin C, Ho BS, Kadakia AR. The effect of cumulative glyce‑ mic burden on the incidence of diabetic foot disease. J Orthop Surg Res. 2016;11(1):143.
34. Canani LH, Copstein E, Pecis M, Friedman R, Leitao CB, Azevedo MJ, Triches C, Rados DR, Moreas RS, Gross JL. Cardiovascular autonomic neuropathy in type 2 diabetes mellitus patients with peripheral artery disease. Diabetol Metab Syndr. 2013;5(1):54.
35. Matsutani D, Sakamoto M, Minato S, Kayama Y, Takeda N, Horiuchi R, Utsunomiya K. Visit‑to‑visit HbA1c variability is inversely related to baroreflex sensitivity independently of HbA1c value in type 2 diabetes. Cardiovasc Diabetol. 2018;17(1):100–100.
36. Nativel M, Potier L, Alexandre L, Baillet‑Blanco L, Ducasse E, Velho G, Marre M, Roussel R, Rigalleau V, Mohammedi K. Lower extremity arterial disease in patients with diabetes: a contemporary narrative review. Cardiovasc Diabetol. 2018;17(1):138–138.
37. Tang X, Zhong J, Zhang H, Luo Y, Liu X, Peng L, Zhang Y, Qian X, Jiang B, Liu J, et al. Visit‑to‑visit fasting plasma glucose variability is an important risk factor for long‑term changes in left cardiac structure and function in patients with type 2 diabetes. Cardiovasc Diabetol. 2019;18(1):50. 38. Cardoso CRL, Leite NC, Moram CBM, Salles GF. Long‑term visit‑to‑visit
glycemic variability as predictor of micro‑ and macrovascular complica‑ tions in patients with type 2 diabetes: The Rio de Janeiro Type 2 Diabetes Cohort Study. Cardiovasc Diabetol. 2018;17(1):33–33.
39. DeVries JH. Glucose variability: where it is important and how to measure it. Diabetes. 2013;62(5):1405–8.
40. Hsu WY, Lin CL, Kao CH. A population‑based cohort study on peripheral arterial disease in patients with schizophrenia. PLoS ONE. 2016;11(2):e0148759.
•fast, convenient online submission
•
thorough peer review by experienced researchers in your field
• rapid publication on acceptance
• support for research data, including large and complex data types
•
gold Open Access which fosters wider collaboration and increased citations maximum visibility for your research: over 100M website views per year
•
At BMC, research is always in progress.
Learn more biomedcentral.com/submissions
Ready to submit your research? Choose BMC and benefit from: failure hospitalization and cardiovascular death: a nationwide cohort
study. Int J Cardiol. 2016;203:204–11.
42. Hooi JD, Kester AD, Stoffers HE, Overdijk MM, van Ree JW, Knottnerus JA. Incidence of and risk factors for asymptomatic peripheral arterial occlu‑ sive disease: a longitudinal study. Am J Epidemiol. 2001;153(7):666–72.
Publisher’s Note