INTERACTION OF DIETARY FAT TYPES AND GUT MICROBIOME ON MODULATION OF
WHOLE BODY ENERGY BALANCE
Xiaomeng You
A thesis submitted to the faculty at the University of North Carolina at Chapel Hill in partial
fulfillment of the requirements for the degree of Master of Science in the Department of
Nutrition in the Gillings School of Global Public Health.
Chapel Hill
2014
iii
ABSTRACT
Xiaomeng You: Interaction of dietary fat types and gut microbiome on modulation of whole
body energy balance
(Under the direction of Steven H Zeisel)
Dietary fats and gut microbes are regarded as environmental factors for the onset of obesity.
However, whether there is a direct association between dietary fat type and gut microbiome that
promotes obesity remains unclear. In this study, we tested the effect of modulation of the gut
microbiome by antibiotics on energy balance in Sprague Dawley rats fed a 45% high fat diet containing
primarily saturated fatty acids (SFA) vs. polyunsaturated fatty acids (PUFA). Antibiotic treatment
successfully decreased the gut microbiome as evidenced by decreased microbiome α-diversity and
β-diversity. We found that food intake was decreased by antibiotic treatment irrespective diet. PUFA-fed
rats gained less weight and consumed less food than those fed SFA independent of microbiome
composition. No differences were seen in energy expenditure among the 4 groups. Gut hormone and
adipokine gene and protein expression was measured in ileum, colon, white adipose tissue (WAT) and
blood serum. Compared with SFA, PUFA fed rats had less ileum peptide YY , colon glucagon-like
peptide-1, WAT sterol regulatory element binding transcription factor 1 and more ileum β-defensins, WAT
adiponectin gene expression. However, no differences were seen in serum protein expression among
the 4 groups. In conclusion, SFA are more obesogenic and promote food intake as compared to PUFA
and this positive energy balance is independent of the gut microbiome. The mechanisms by which SFA
iv
ACKNOWLEGEMENT
First and foremost, I would like to express my sincere gratitude to my advisors Dr. Steven H.
Zeisel and Dr. Andrew Swick for the continuous help, guidance, patience and support throughout the
last two years I have been in this program. They helped me become a better student and scientist,
enabling me to conduct this research and write this thesis. I would like to thank the rest of my thesis
committee: Dr. Mihai Niculescu and Dr. Liza Makowski for their support, encouragement, and insightful
comments. In addition, I would like to thank Dr. Mike Wang at DHMRI and Dr. Raad Gharaibeh at UNCC
for the 16rRNA gene sequencing and bioinformatics analysis. I am grateful to all the past and present
members in Dr. Swick’s lab and Dr. Zeisel’s lab who have helped with my research over the last two
years. A special thanks to Annalouise O’Connor, Stephen Orena, Dr. Karen Corbin, Yanyan Huang, Eneda
Pjetri for your help, support and encouragement. Also, I want to thank all my friends, particularly, Fuli
(Tracey) He, Michael Lee, Daniel Lupu, Guo Hu, Heather Zhao, and George Fan for sincere help and
guidance. Last but not least, I would like to thank my parents and my cousin Sage Wang, for their
unwavering support, love and guidance. I would not have been successful these last two, very
v
TABLE OF CONTENTS
LIST OF TABLES ... vii
LIST OF FIGURES ... viii
CHAPTER 1: BACKGROUND... 1
Introduction ... 1
Central control of energy balance ... 1
Peripheral signals of energy balance ... 2
Endocrine-Immune interaction in gut ... 6
The potential mechanism linking gut microbiome to obesity... 7
The effect of dietary fat types on obesity ... 9
Hypothesis ...12
CHAPTER 2: MANUSCRIPT ...16
Introduction ...16
Methods ...19
Results...23
Discussion ...27
CHAPTER 3: DISCUSSION ...51
The effect of different dietary fat types on body weight, food intake and energy expenditure ...51
Peripheral signals of energy balance in response to dietary fat type...54
The effect of dietary fat types on gut microbiota...56
vi
The effect of knockdown of gut microbiota on body weight, food intake and energy expenditure ...58
Indications of current study and future directions ...60
vii
LIST OF TABLES
Table 1 Gut hormones on appetite control (Summarized from [37, 40, 42, 79]) ...15
Table 2: Macronutrients Composition of the SFA and PUFA Diets...48
Table 3: Detailed nutrients ingredients of SFA and PUFA diets ...48
Table 4 Energy Expenditure Measurement Flowchart...49
Table 5 Effect of Diet Intervention on Energy Expenditure (Mean ± SEM) ...49
viii
LIST OF FIGURES
Figure 1 Brain control of energy balance overview. (Adapted from [4]) ...13
Figure 2 The ARC and the control of energy balance. (Adapted from [4])...14
Figure 3 Study Design ...30
Figure 4 The effect of diet intervention on body weight:...31
Figure 5 The effect of diet intervention on food intake: ...32
Figure 6 The effect of diet intervention on total food intake for 36 days:...33
Figure 7 Effect of diet intervention on food intake normalized to body weight ...33
Figure 8 Effect of diet intervention on gut microbiome richness (α-diversity) and β-diversity ...34
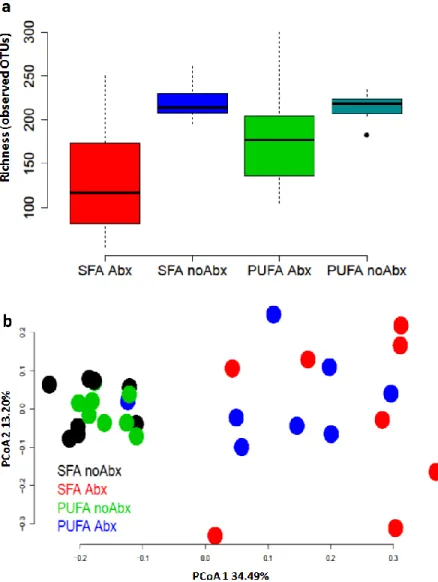
Figure 9 Effect of different diet intervention ± antibiotic treatment on rats’ gut microbiome richness (α-diversity) and β-diversity...35
Figure 10 Effect of different diet intervention ± antibiotic treatment on rats’ body weight ...36
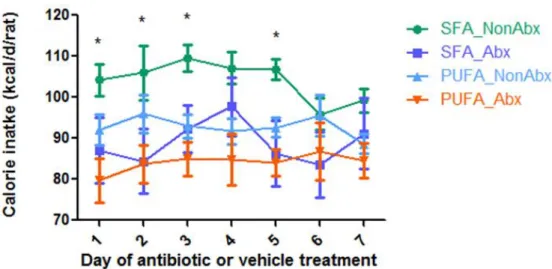
Figure 11 Effect of different diet intervention ± antibiotic treatment on rats’ food intake...37
Figure 12 Effect of different diet intervention ± antibiotic treatment on rats’ food intake normalized to body weight ...38
Figure 13 Effect of different diet intervention ± antibiotic treatment on ileum β-defensin-2 (a), β-defensin-3 (b) and β-defensin-4 (c) gene expression...39
Figure 14 Effect of different diet intervention ± antibiotic treatment on colonβ-defensin-2 (a), β-defensin-3 (b) and β-defensin-4 (c) gene expression...40
Figure 15 Effect of different diet intervention ± antibiotic treatment on serum total β-defensins protein expression...41
ix
Figure 17 Effect of diet intervention ± Abx on ileum PYY (a), ileum GLP-1 (b),
colon PYY (c) and colon GLP-1 (d) gene expression...42
Figure 18 Effect of diet intervention ± Abx on leptin (a), adiponectin (b), PPARγ (c) and SREBP1 (d) gene expression ...43
Figure 19 Effect of diet intervention ± Abx on serum ghrelin expression...44
Figure 20 Effect of diet intervention ± Abx on serum GIP expression ...44
Figure 21 Effect of diet intervention ± Abx on serum glucagon expression ...45
Figure 22 Effect of diet intervention ± Abx on serum insulin expression ...45
Figure 23 Effect of diet intervention ± Abx on serum leptin expression ...46
Figure 24 Effect of diet intervention ± Abx on serum adiponectin expression...46
Figure 25 Effect of diet intervention ± Abx on serum PYY expression ...47
x
LIST OF ABBREVIATIONS
α-MSH Alpha-melanocyte-stimulating hormone
AA Arachidonic acid
Adipor1 Adiponectin receptor 1
Adipor2 Adiponectin receptor 2
ADM Antimicrobial defence molecule
AgRP Agouti-related protein
ALA Alpha-linolenic acid
AMPK AMP-activated protein kinase
ANGPTL4 Angiopoitetin-like 4
Antibiotic treatment Abx
AP Area postrema
ARC Arcuate nucleus
CART Cocaine and amphetamine regulated transcript
CaSR Calcium-sensing receptor
CCK Cholecystokinin
CNS Central nervous system
CO2 Carbon dioxide
DIT Diet-induced thermogenesis
DHA Docosahexaenoic acid
DMH Dorsomedial hypothalamus
EE Energy expenditure
xi
ELISA Enzyme-linked immunosorbent assay
EPA Eicosaentaenoic acid
FFAR1/ GPR40 Free fatty acid receptor 1
FFAR2/ GPR43 Free fatty acid receptor 2
FFAR3/GPR41 free fatty acid receptor 3
Fiaf Fasting-induced adipose factor
GAPDH Glyceraldehyde 3-phosphate dehydrogenase
GHS-R Growth hormone secretagogue receptor
GI track Gastrointestinal tract
GIP Glucose-dependent insulinotropic polypeptide
GLP-1 Glucagon-like peptide-1
GLP-2 Glucagon-like peptide-2
GLUT4 Glucose transporter 4
GPCR G protein coupled receptor
GPR119 G protein-coupled receptor 119
GPR120 G protein-coupled receptor 120
H Heat production
HBD3 Human β-defensin 3
LA Linoleic acid
LH/LHA Lateral hypothalamus
LPAR5/GPR92/GPR93 Lysophosphatidic acid receptor 5
LPS lipopolysaccharides
MC4R Melanocortin 4 receptor
xii
MUFA Monounsatureated fatty acids
NAc Nucleus accumbens
NOD Nucleotide-binding oligomerization domain receptor
NPY Neuropeptide Y
NTS Nucleus of the solitary tract
O2 Oxygen
OXM Oxyntomodulin
PFA Perifornical area
POMC Pro-opiomelanocortin
PP Pancreatic polypeptide
PPAR-α Peroxisome proliferator-activated receptors alpha
PPAR-γ Peroxisome proliferator-activated receptors gamma
PPAR-δ Peroxisome proliferator-activated receptors delta
PUFA Polyunsaturated fatty acids
PVN Paraventricular nucleus
PYY Peptide YY
qRT-PCR Quantitative reverse transcriptase polymerase chain reaction
RER Respiratory exchange ratio
SCFA Short-chain fatty acid
SFA Saturated fatty acids
SREBP-1 Sterol regulatory element-binding protein 1
T1R1-T1R3 Amino acids, the umami (savoury) receptor
T1R2-T1R3 Simple sugars and artificial sweeteners, the sweet taste receptor
xiii
TLR Toll-like receptor
TRPA1 Transient receptor potential cation channel, subfamily A, member 1
VMH Ventromedial hypothalamus
WHO World Health Organization
Y1/5 Neuropeptide Y receptor type 1/type 5
1
CHAPTER 1: BACKGROUND
Introduction
Obesity is a serious public health concern all over the world. According to a World Health
Organization (WHO) report, the incidence of obesity has doubled or even tripled in many countries over
the past 30 years [1]. Obesity lies at the root of many prevalent metabolic disorders and diseases such as
type 2 diabetes, cardiovascular disease, high blood pressure, dyslipidemia and cancer. Despite the fact
that more than 300,000 deaths every year in the United States are due to obesity or its related
metabolic disease, obesity is still one of the 10 most preventable health risks according to WHO [2].
Obesity results from energy imbalance and involves various mechanisms and factors including brain
control, peripheral signals, gut immune system, and as well as dietary fats, discussed as followed.
Central control of energy balance
The core principle causing obesity is energy imbalance because food intake is greater than
energy expenditure. Physiologically, food intake and energy expenditure are tightly regulated through a
multi-level system that connects the brain, peripheral tissues (i.e gut, fat tissue, liver, pancreas), and
hormonal and neural signals. The brain integrates neural afferents and hormonal signals from the
periphery received by hypothalamus and brainstem with energetic needs or anticipated needs, physical
and social environmental factors, memory for past experiences, and many other factors to regulate
appetite and energy expenditure (Figure 1) [3, 4].
The hypothalamus has been a research hotspot in obesity, as this area contains numerous
2
electrical stimulation studies have demonstrated that the lateral hypothalamus (LH) is a feeding center,
the ventromedial hypothalamus (VMH) is a satiety center, and the arcuate nucleus (ARC) is an
integrated center for feeding regulation [6]. The ARC contains two populations of neurons with opposing
effects on food intake: orexigenic and anorexigenic neurons. Orexigenic neurons express neuropeptide Y
(NPY) and Agouti-related protein (AgRP). Anorexigenic neurons express alpha-melanocyte-stimulating
hormone (α-MSH) which is derived from pro-opiomelanocortin (POMC), and cocaine and amphetamine
regulated transcript (CART) [3]. Circulating signals related to energy status are able to influence the
activity of the ARC neurons directly via the underlying median eminence, as this region of the brain is
not protected by the blood–brain barrier [3]. These ARC neurons then in turn project to a number of
extra-hypothalamic and intra-hypothalamic regions. These areas contain secondary neurons which
process the information regarding energy homeostasis.
The melanocortin 4 receptor (MC4R) plays an important role in the downstream pathway of
hypothalamus required to modulate short-term and long-term energy homeostasis by integrating
signals provided by α-MSH and AgRP [7, 8]. MC4R is expressed primarily in the central nervous system
(CNS). Its mRNA was found in multiple sites in virtually every brain region, including the hypothalamus,
brainstem, cortex, thalamus, and spinal cord [9]. Particularly, MC4R is expressed in ARC, VMH and PVN
which are implicated in energy homeostasis [4]. Rodents studies showed that functional loss of MC4R
increased body weight, food intake and white adipose mass [8]. Administration of agonists to the
hypothalamic MC4R suppressed food intake, stimulated the thyroid axis and increased energy
expenditure. Therefore, MC4R agonists are regarded as a target for obesity therapy.
Peripheral signals of energy balance
To date about 100 unique molecules have been identified to have effects on energy balance [5].
3
adiposity signals whose secretion is proportional to body fat [10]. Leptin, adiponectin, insulin, glucagon
and gut hormones will be discussed in detail as followed.
Leptin is a hormone discovered in 1994 that is predominantly produced by adipose tissue [11].
Dietary factors and other hormones are thought to influence its secretion. In vitro, insulin is shown to
simulate leptin secretion in adipocytes [12]. In addition, the rate of glucose uptake into adipose tissue
determines changes in circulating leptin [13]. Other nurients might also influence leptin production.
Rodent studies showed that diets rich in n-6 PUFA increase leptin production [14, 15]. Lack of leptin or
leptin receptor bioactivity is responsible for a phenotype characterized by hyperphagia, reduced energy
expenditure, and severe obesity in both rodents (ob/ob mice and db/db mice) and human [16-18].
Leptin is expressed and secreted in proportion to adipose mass and circulates in plasma in a
concentration highly correlated to body fat mass [19]. The circulating leptin crosses the blood brain
barrier, binds to leptin receptors on neurons throughout the hypothalamus and provides a negative
feedback signal to inhibit food intake and to stimulate energy expenditure [11]. However, the rise in
endogenous leptin, or exogenous leptin given as treatment is unable to prevent weight gain in most
obese humans, a process called “leptin resistance” [20]. Leptin resistance may result from a decrease in
brain transport or attenuation of leptin signaling in the hypothalamus and other central nervous system
targets [21]. Further studies will need to focus on developing therapies aimed at reversing leptin
resistance.
Adiponectin is specifically and abundantly expressed in adipocytes. Epidemiological evidence
has indicated that circulating adiponectin levels are reduced in obese patients [22]. Adiponectin acts in
an autocrine/paracrine manner within adipose tissue, and in an endocrine manner on distal tissues [23].
As an autocrine/paracrine factor in adipose tissue, adiponectin has shown beneficial effects on insulin
4
by 78% through increased glucose transporter 4 (GLUT4) gene expression and increased GLUT4
recruitment to the plasma membrane.[24] Adiponectin also functions as an endocrine factor, influencing
whole-body metabolism via effects on target organs [23]. Adiponectin receptor 1 (Adipor1) expression is
ubiquitous in the rat brain and adiponectin receptor 2 (Adipor2) expression is more limited to
hypothalamus [25]. By binding to the adiponectin receptors in hypothalamus, adiponectin increases
hypothalamic AMP-activated protein kinase (AMPK) phosphorylation to stimulate food intake and
suppress energy expenditure [26]. However, it should be noted that intracerebroventricular
administration of adiponectin decreased body weight with increasing energy expenditure suggesting a
negative regulation pathway for adiponectin effect on energy balance [27].
Insulin is secreted from β-cells of the pancreas. The best known action of insulin is to suppress
the synthesis and secretion of glucose by the liver and as a result, reduce the blood glucose level. Levels
of insulin are determined to a great extent by peripheral insulin sensitivity, and this is related to total
body fat stores and fat distribution, with visceral fat being a key determinant of insulin sensitivity [28,
29]. Therefore, insulin may convey a signal indicating the degree of adiposity to any insulin-sensitive
tissue, providing a key negative feedback signal in the regulation of body fat. It is now generally
accepted that some plasma insulin can be transported into the brain and especially to hypothalamus to
reduce food intake and decrease body weight [30]. Insulin may cross the blood–brain barrier via a
saturable, receptor-mediated process, at levels which are proportional to the circulating insulin [31].
Selective decrease in hypothalamic insulin receptor protein by antisense oligodeoxynucleotide against
the insulin receptor precursor protein results in hyperphagia and increased fat mass indicating that
peripheral insulin acts on hypothalamic nuclei to control energy homeostasis [32].
Glucagon is a pancreatic hormone produced from the preproglucagon precursor molecule by
5
by promoting hepatic glycogenolysis and gluconeogenesis. Thus, the major metabolic functions of
glucagon are opposite to those of insulin. In addition, glucagon has anorectic properties and promotes
satiety. Peripherally administered glucagon decreased food intake and increased c-fos expression in the
brainstem and amygdala indicating that neurons in the brainstem and amygdala are activated in order
to reduce food intake by glucagon [33]. However, the underlying mechanism for how glucagon activates
neurons in brain to reduce food intake is unknown. The anorectic effect following glucagon
administration is blunted in vagotomized animals suggesting this effect is influenced by vagal input [34,
35]. Also, low levels of glucagon receptor mRNA are found in the hypothalamus and brainstem in
rodents indicating the possibility of direct glucagon action in these areas to reduce food intake [36].
Gut hormones are peptides that are synthesized and released from the gastrointestinal tract
[37]. There are at least 15 different types of enteroendocreine cells diffusely distributed throughout the
gastrointestinal epithelium making the gut the most largest endocrine organ in the body [38]. Contrary
to long-acting adiposity signals of leptin and adiponectin, the appetite hormones from gut interact with
receptors at various points in the "gut-brain axis" to affect short-term and intermediate-term feelings of
hunger and satiety [39]. Evidence showed that endocrine cells can directly sense luminal contents
primarily by G protein coupled receptors (GPCRs) [40] (see Table 1). For example, L cells express the
complete range of fatty acid receptors that can sense fats in the intestine lumen and release peptide YY
(PYY) and glucagon-like peptide-1 (GLP-1) into circulation with effect on the hypothalamus to regulate
energy balance [41]. To date, the gastrointestinal (GI) tract releases at least 20 different regulatory
peptide hormones at the same time depending on the quality and quantity of the diet and influences
various physiological processes [40, 42]. A number of gut hormones have been identified as being
involved in appetite control and energy balance. Among them, ghrelin is called “hunger hormone” which
is the only known circulating orexigen principally synthesized in endocrine A(X-like) cells (or ghrelin cells)
6
intake by decreasing hypothalamic orexigenic signaling and increasing anorectic signaling (Listed in Table
1). As gut hormones have been shown to have a fundamental role in energy homeostasis, the use of gut
hormones as anti-obesity treatments is an attractive option and shows considerable promise.
Endocrine-Immune interaction in gut
Intestinal epithelial cells act as the interface between the external environment and the
internal milieu. The content of the intestine is rich in nutrients, chemicals and microorganisms. The gut
processes a range of sensory systems to detect nutrients and defend against pathogens and injurious
chemicals [40]. As discussed previously, the gut functions as an endocrine organ to release gut
hormones by nutrients receptors that can act on other cells locally, or organs at remote sites including
pancreatic islets and the CNS to regulate food intake, gastric empting and intestinal transit, release of
digestive enzymes, induction of nutrient transporters and digestive enzymes, pancreatic insulin
secretion [40].
Also, the gut functions to defend against pathogens and injurious chemicals. In addition to be a
physical barrier against infection by the wealth of opportunistic pathogens that can invade through the
oral-enteric route, intestine serves as an active immune site including adaptive immunity that
lymphocyte mediated secretion of specific antibodies and innate immune response of secretion of
non-antigen specific compounds [45]. Intestinal epithelium constantly monitors both the luminal and
mucosal environments through receptor mediated interactions with the contents therein [46]. In
response to the activation of Toll-like receptors (TLRs) and nucleotide-binding oligomerization domain
receptors (NOD) expressed by intestinal epithelial cells, Paneth cells, and neutrophils, antimicrobial
defence molecules (ADMs) are released as endogenous antibiotics, which are central to both the innate
and adaptive arm of mucosal host defense within the gut [46]. Defensins are one of the major classes of
7
disruption of cell walls. Defensins are classified as α-defensins and β-defensins based on their molecular
distribution of cysteine amino acids and the resulting disulfide bonds [47]. Recent work showed that
β-defensins can bind to the MC4R to control feeding and body weight [48]. Intracerebroventricular
injection of human β-defensin 3 (HBD3) to male Wistar rats had an inhibitory effect on both the food
intake and body weight gain with the potential mechanism of blocking AgRP [49]. As the secretion in
response to bacteria in the intestine, β-defensins link the gut microbiome, intestine immunity and
energy balance together and provide a crosstalk between gut microbiome and obesity.
The potential mechanism linking gut microbiome to obesity
The gut microbiome presents more than 1,000 different molecular species or phylotypes and
90% of the species belong to Firmicutes and Bacteroidetes [50]. Recent work has identified a role for
microbiota in the onset of obesity. The link between microbiota and obesity was first uncovered based
on the observation that germ-free mice contained 42% less body fat than conventional mice regardless
of more food intake [51]. Similarly, pseudo-germ-free mice treated with an ampicillin-neomycin cocktail
are prevented from the development of obesity when fed on a high fat diet, indicating an essential role
for gut microbiota in obesity development [52]. Today the gut microbiota is considered a “microbial
organ” and many studies explore the potential mechanisms of the effect of gut microbiome on host
metabolism and its contribution to obesity.
Low-grade inflammation is a common comorbidity of obesity and its related metabolic
disorder. Lipopolysaccharides (LPS) originating from gram-negative bacteria in the gut is believed to
induce subclinical inflammation and insulin resistance and contribute to obesity [53]. In a study of
genetically identical male rats, infusing a low level of LPS for 4 weeks caused the same amount of weight
8
to LPS, are resistant weight gain [53]. Gut microbiota modulated by antibiotics can reduce circulating LPS
levels, decrease inflammatory signaling and improve insulin signaling [54].
Increasing energy harvest from dietary fibers by gut microbiota is also believed to affect body
weight. It is calculated that the intestinal microbiota breaks down indigestible polysaccharides (i.e., fiber)
to short-chain fatty acids (SCFAs) providing 80 to 200 kcal per day or about 4–10% of daily energy intake
in normal adults [55]. Also, it is proposed that the microbiota of obese individuals may be more efficient
at extracting energy from a given diet than the microbiota of lean individuals. Lean mice have less
short-chain fatty acids in the caeca and excrete more energy by feces, compared with obese mice [56].
Fasting-induced adipose factor (Fiaf, also referred as Angiopoietin-like 4; ANGPTL4) is a
secreted factor involved in regulation of lipid homeostasis by inhibiting lipoprotein lipase [57].
Germ-free mice express excessive Fiaf in the intestine[51], which blocked the disassociation of fatty acids from
triglycerides for uptake into tissues and upregulated fatty acid oxidation and uncoupling proteins, and
reduced the amount of fat storage [57]. Also, germ-free mice lacking Fiaf respond to a high fat diet with
excessive weight gain [58]. Therefore, Fiaf might serve as a circulating mediator between the gut
microbiota and fat storage in adipose tissue.
The activation of AMPK is also thought to be involved in linking the gut microbiome and
obesity, with evidence showing that germ-free mice increased skeletal muscle and liver levels of
phosphorylated AMPK and its downstream targets involved in fatty acid oxidation [58].
These complementary but independent mechanisms indicate that gut microbiota may be a
target for treating obesity. However, the effect of the gut microbiome on food intake and energy
expenditure, the two key factors determine energy balance, are inconclusive with controversial results
due to the different types of animals, the quality of the diet, the period of observation and the sample
9
The effect of dietary fat types on obesity
The effect of dietary fats on human health depends not only on the quantity of ingested fats,
but also on the composition and nature of the fatty acids. Depending on the presence of double bonds,
fatty acids are classified into three main groups: 1) saturated fatty acids (SFA) that do not contain double
bonds 2) monounsaturated fatty acids (MUFA) that contain only one double bond, and 3)
polyunsaturated fatty acids (PUFA) that contain at least two double bonds. Among PUFA, linoleic acid
(LA: 18:2 n-6) and alpha-linolenic acid (ALA: 18:3 n-3), are known as essential fatty acids (EFA). They are
fundamental for the organism, but they cannot be synthesized in the human body and must be obtained
from the diet. Essential biological functions have been attributed to EFA-derivatives, such as arachidonic
acid (AA, 20:4 n-6), docosahexaenoic acid (DHA, 22: 6 n-3) and eicosapentaenoic acid (EPA, 20:5 n-3)
[59].
SFA derive primarily from animal sources, such as fatty meats (pork, beef, veal, lamb, ham),
eggs and dairy products (whole milk, cream, butter and cheese) [60]. Some vegetable products (such as
coconut oil, and palm kernel oil) are also rich in SFA [60]. PUFA are present in many species of nuts,
vegetable oils and fish oil. In particular, n-6 PUFA are abundantly present in corn oil, cotton seed oil,
peanut oil, soybean oil, sunflower oil and safflower oil, while canola oil, linseed oil and fish oil are rich in
n-3 PUFA [59].
Generally, saturated fat of mammalian origin seems to be far more harmful to human health
than unsaturated fat from plants and fish. SFA are associated with an increased risk various diseases
including dyslipidemia, coronary heart disease, and cancer [61-63]. In contrast, a considerable number
of studies have demonstrated the beneficial effects of PUFA on health [60, 64-68].
In many cases, n-3 PUFA and n-6 PUFA can compensate each other’s function in ameliorating
10
In other situations, n-3 PUFA and n-6 PUFA have competitive functions. For example, ingestion of EPA
and DHA from fish or fish oil replaces AA from membrane phospholipids in practically all cells, especially
those of platelets, erythrocytes, neutrophils, monocytes and liver cells [69].
The balance of n-6 PUFA and n-3 PUFA is very important for homeostasis and normal
development. Because of the increased amount of n-6 PUFA in the Western diet (n-6 PUFA to n-3 PUFA
is about 15/1 to 16.7/1) [70], the eicosanoid metabolic products from AA are formed in larger quantities
than those formed from n-3 PUFA. The eicosanoids from AA are biologically active in small quantities.
However, if formed in large amounts, they will contribute to the formation of thrombi and
atherosclerosis, the development of allergic and inflammatory disorders, and cell proliferation [69]. On
the contrary, ingestion of EPA and DHA leads to a more physiologic state characterized by the
production of prostanoids and leukotrienes that have antithrombotic, antichemotactic,
antivasoconstrictive and anti-inflammatory properties [69].
A high-fat diet (≥40 % of energy from fat sources) is regarded as one of the factors associated
with the current obesity epidemic as it contributes to a positive energy balance and a positive fat
balance as well [71]. In the meantime, it is well established that the consumption of different types of
fat is associated with different rates of weight gain in obese animals [72]. It is believed that SFA are
more obesogenic than PUFA [73-75], although there are controversies [76]. Early studies showed that
animals fed with PUFA (from corn oil) have lower weight gain than SFA (from beef tallow) [77]. The
observed difference in weight gain might be explained by the differences in capacity to control appetite
or effects on energy expenditure. Human studies demonstrated that PUFA may exert a relatively
stronger control over appetite than SFA [74]. A diet rich in PUFA also results in increased energy
expenditure with preferential stimulation of the thermogenic activity of brown adipose tissue[77] and
11
In addition, PUFA are oxidized more rapidly than SFA, and as a result, decrease serum
triacylglycerol level and fat accumulation [78, 79]. In rats, the consumption of a PUFA rich (from
safflower oil) diet results in a higher lipoprotein lipase activity in heart and skeletal muscle than does a
SFA diet (from beef tallow) [79]. Compared to SFA, PUFA (both the n-6 and n-3 series, but n-3 PUFA are
more potent ligands for nuclear receptors than n−6 PUFA) are regarded as the preferred activator of
peroxisome proliferator-activated receptors delta, gamma and alpha (PPAR-δ, PPAR-γ and PPAR-α) [59,
80]. More PPAR signaling is able to up-regulate the expression of enzymes involved in conversion of
fatty acids to acyl-coenzyme A esters, fatty acid entry into mitochondria and peroxisomal and
mitochondrial fatty acid catabolism [81]. In addition, PUFA (both the n-6 and n-3 series, but n-3 PUFA
are more potent ligands for nuclear receptors than n−6 PUFA) selectively decreases sterol regulatory
element-binding protein 1 (SREBP-1), which is involved in the transcriptional regulation of lipogenic
enzymes [59, 80, 82].
Recent studies show that dietary fats also affect the populations of gut microbes and their
metabolic end products. A high-fat-fed animal displays a significant shift in both bacterial and
metagenomic profiles as compared to an animal on a normal, chow diet [83]. Western diet-associated
cecal microbiota are characterized by a reduction in Bacteroidetes and an increase in Firmicutes [83].
Animal studies also showed that the composition of the murine gut microbiome was determined by a
high-fat diet independent of obesity [84]. Hildebrandt et al. found that a high-fat diet was associated
with murine gut microbiome alterations characterized by a decrease in Bacteroidetes and an increase in
both Firmicutes and Proteobacteria in the presence and absence of obesity [84]. Thus, gut microbiome
provides another mechanism that connects dietary fats and obesity. However, a direct connection
12
Hypothesis
In this study, we tested the effect of modulation of the gut microbiome by antibiotics
on energy balance in Sprague Dawley rats fed a 45% high fat diet containing primarily saturated
fatty acids SFA vs. PUFA as the main source of lipids. The rats within these two dietary groups
were then treated with either an antibiotics or a vehicle to modulate the microbiome. We
hypothesized that rats fed with a PUFA diet would have less weight gain than those fed a SFA
diet due to less food intake and more energy expenditure due to the modulation of peripheral
energy balance signaling from the gut, adipose tissue, and pancreas to the brain independent of
the gut microbiome. The difference of weight gain would be seen between SFA diet and PUFA
13
Figure 1 Brain control of energy balance overview. (Adapted from [4])
The brain integrates neural afferents and hormonal signals from the periphery received by hypothalamus and brainstem with energetic needs or anticipated needs, physical and social environmental factors, memory for past experiences, and many others to regulate appetite and energy expenditure.
14
Figure 2 The ARC and the control of energy balance. (Adapted from [4])
The ARC contains two populations of neurons with opposing effects on food intake: orexigenic and anorexigenic neurons. Orexigenic neurons express neuropeptide Y (NPY) and Agouti-related protein (AgRP). Anorexigenic neurons express alpha-melanocyte-stimulating hormone (α-MSH) which is derived from pro-opiomelanocortin (POMC), and cocaine and amphetamine regulated transcript (CART). Circulating signals of energy status come across the median eminence to influence the activity of the ARC neurons directly. The ARC neurons then in turn project to a number of extra-hypothalamic and intra-hypothalamic regions. These areas contain secondary neurons which process the information regarding energy homeostasis.
15
Table 1 Gut hormones on appetite control (Summarized from [37, 40, 42, 85])
Gut hormone Cell Luminal
receptors*
Locations Effect on food intake
Ghrelin A(X)-like cells T1R1-T1R3; T2Rs Stomach Increase Cholecystokinin
(CCK)
I cells T2Rs; FFAR1;
GPR120; LPAR5; CaSR; TRPA1; TLRs
Proximal small intestine Decrease Glucose-dependent insulinotropic polypeptide (GIP)
K cells GPR119; GPR120;
FFAR1
Proximal small intestine
Decrease
Peptide YY (PYY) L cells T2Rs; T1R2-T1R3; FFARs 1-3; GPR119, LPAR5, GPR120; CaSR Distal small intestine and colon Decrease Glucagon-like peptide-1 (GLP-1)
L cells T2Rs; T1R2-T1R3; FFARs 1-3; GPR119, LPAR5, GPR120; CaSR Distal small intestine and colon Decrease Glucagon-like peptide-2 (GLP-2)
L cells T2Rs; T1R2-T1R3; FFARs 1-3; GPR119, LPAR5, GPR120; CaSR Distal small intestine and colon Decrease Oxyntomodulin (OXM)
L cells T2Rs; T1R2-T1R3; FFARs 1-3; GPR119, LPAR5, GPR120; CaSR Distal small intestine and colon Decrease
16
CHAPTER 2: MANUSCRIPT
1Introduction
Obesity is a serious public health concern. According to a 2012 World Health Organization
(WHO) report, the incidence of obesity has doubled or even tripled in many countries over the past 30
years [1]. Obesity lies at the root of many prevalent metabolic disorders and diseases such as type 2
diabetes, cardiovascular disease, high blood pressure, dyslipidemia and cancer. Despite the fact that
more than 300,000 deaths every year in the United States are due to obesity or its related metabolic
disease, obesity is still one of the 10 most preventable health risks according to WHO [2].
Obesity results from energy imbalance. The control of energy balance relies upon the brain to
detect and integrate of peripheral signals from gut, adipose tissues, pancreas of energy homeostasis and
social, emotional, circadian, habitual and other situational factors [3, 4].
Recent work has identified a role for gut microbiota in the onset of obesity. The potential
mechanisms of the effect of gut microbiota on the host metabolism, and its contribution to obesity,
include lipopolysaccharides (LPS)- induced low grade inflammation[54], increased energy harvesting
from dietary fibres [56], decreased fasting-induced adipose factor expression [51], changed lipid
metabolism [51], and/or decreased AMP-activated protein kinase (AMPK) activation [58]. However, the
effect of the gut microbiome on food intake and energy expenditure, the two key factors determine
energy balance, are inconclusive with controversial results due to the different type of animals, the
quality of the diet, the period of observation and the sample size in different studies [55].
17
In response to bacterial, antimicrobial defence molecules (ADMs) are released as endogenous
antibiotics, which are central to both the innate and adaptive arm of mucosal host defense within the
gut. β-defensins are one of major classes of ADMs. Recent work showed that β-defensins can bind to the
melanocortin 4 receptor (MC4R) to control feeding and body weight providing another mechanism
linking gut microbiome and energy balance [48].
The current obesity epidemic is associated with the change of diet and sedentary lifestyle in
modern life. A high-fat diet is regarded as a risk factor for obesity as it contributes to a positive energy
balance and a short-term positive fat balance [71]. In the meantime, it is well established that the
consumption of different types of fat is associated with different rates of weight gain in obese animals
[72]. Although there are controversies, it is believed that SFA are more obesigenic than PUFA [73, 74,
76]. Early studies showed that animals fed with PUFA have lower weight gain than SFA [77]. The
observed difference in weight gain might be explained by the differences in capacity to control appetite
or effects on energy expenditure. Human studies demonstrated that PUFA may exert a relatively
stronger control over appetite than SFA [74]. A diet rich in PUFAs also results in increased energy
expenditure with preferential stimulation of the thermogenic activity of brown adipose tissue [77] and
diet-induced thermogenesis (DIT) [72].
In addition, PUFA are oxidized more rapidly than SFA, and as a result, decrease serum
triacylglycerol level and fat accumulation [78, 79]. In rats, the consumption of a PUFA rich (from
safflower oil) diet results in a higher lipoprotein lipase (LPL) activity in heart and skeletal muscle than
does a SFA diet. Compared to SFA, PUFA is regarded as the preferred activator of peroxisome
proliferator-activated receptors delta, gamma and alpha (PPAR-δ, PPAR-γ and PPAR-α). PPAR signaling is
able to up-regulate the expression of enzymes involved in conversion of fatty acids to acyl-coenzyme A
18
In addition, PUFA selectively decrease sterol regulatory element-binding protein 1 (SREBP-1), which is
considered to be strongly involved in the transcriptional regulation of lipogenic enzymes [82].
Recent studies also show that dietary fats also affect populations of gut microbes and their
metabolic end products. A high-fat-fed animal displays a significant shift in both bacterial and
metagenomic profiles as compared to an animal on a normal, chow diet [83]. Western diet-associated
cecal microbiota are characterized by a reduction in Bacteroidetes and an increase in Firmicutes [83].
Also, it has shown that the composition of the murine gut microbiome was determined by a high-fat diet
independent of obesity [84]. Hildebrandt et al. found that a high-fat diet was associated with murine gut
microbiome alterations characterized by a decrease in Bacteroidetes and an increase in both Firmicutes
and Proteobacteria in the presence and absence of obesity. Thus, gut microbiome provides another
mechanism that connects dietary fats and obesity.
In this study, we tested the effect of modulation of the gut microbiome by antibiotics on energy
balance in Sprague Dawley rats fed a 45% high fat diet containing primarily saturated fatty acids
saturated fatty acids (SFA) vs. polyunsaturated fatty acids (PUFA) as the main source of lipids. The rats
within these two dietary groups were then treated with either an antibiotics or a vehicle to modulate
the microbiome. We hypothesized that rats fed with a PUFA diet would have less weight gain than those
fed a SFA diet by less food intake and more energy expenditure due to the modulation of peripheral
energy balance signaling from the gut, adipose tissue, pancreas to the brain independent of the gut
microbiome. The difference of weight change would be seen between SFA diet and PUFA diet when gut
19
Methods
Animals, Diet and Tissue Collection
This study was approved by the University of North Carolina Institutional Animal Care and Use
Committee. 32 Sprague Dawley male rats (aged 7-week, Charles River Laboratories, USA) were
randomized to one of two diet groups (n=16 per group, phase 1) as follows: 1) SFA-rich diet (45% energy
from fat, predominant source butter and lard), and; 2) PUFA-rich diet (45% energy from fat,
predominant source safflower oil rich in n-6 PUFA) (both Research Diets, New Brunskwick, NJ, USA). The
composition of each diet is indicated in Table 2 and Table 3. Animals were housed singly for accurate
measurement of food intake and energy expenditure. Following 36-day of diet intervention, feces were
collected and stored at -80oC for gut microbiome analysis. Then animals were further randomized to
either antibiotic treatment (Abx) or control group (n=8/ group, phase 2) as follows: 1)
Imipenem/cilastatin sodium at 50 mg/kg of body weight/day, or; 2) vehicle control (distilled water), for a
treatment period of 7 days. Treatment and control were given via water. On the morning following the
final treatment day, food was removed from the animals at the end of the dark cycle. Feces were
collected, stored at -80oC for gut microbiome analysis. Animals were euthanized via exsanguination
under isoflurane and death confirmed via bilateral pneumothorax. Whole blood was collected via
cardiac puncture under anesthesia and centrifuged at 3000 RPM for 15 minutes. Serum was collected
after centrifugation, stored at -80 oC. Small intestine and colon were collected and stored in RNAlater
(Life Technologies, Carlsbad, CA, USA) at -20 oC. White adipose tissue, brown adipose tissue, liver were
collected, snap frozen in liquid nitrogen, stored at -80 oC. (see Figure 3 for study design)
Assessment of body weight, food intake and energy expenditure
Body weight and food intake were measured 3 times a week (Monday, Wednesday, Friday 9:00
20
metabolic rate assessment. As much as possible, spillage was accounted for by collecting and measuring
smaller pellets and crumbs from the cage floor. Metabolic rate was assessed on 2 occasions: on the final
day of the 36-day diet intervention period and the 7-day diet and antibiotic treatment period. During
the energy expenditure measurements, animals were housed in individual metabolic cages (TSE systems,
St Louis, MO, USA) for a period of 24-hours. The difference between the oxygen (O2) and carbon dioxide
(CO2) concentrations in the cages were compared with a reference environment, and used to calculate
oxygen consumption volume (VO2), carbon dioxide production volume (VCO2), respiratory exchange
ratio (RER) and heat production (H). Animals were acclimated to the metabolic cages for at least one day
prior to the measurement period. As there were only 8 metabolic cages, 32 animals were divided into 4
groups to measure energy expenditure (EE) for 4 consecutive days (see Table 4). Each group contained 2
rats from each treatment (SFA_NonAbx, SFA_Abx, PUFA_NonAbx and PUFA_Abx treatment). As it took
about 3 hours to calibrate the machine and change animals in acclimated cage and metabolic cage, 21
hours’ data were collected to calculate the EE.
Assessment of microbiome
Fecal pellets were collected on 2 occasions: on the final day of the 36-day diet intervention
period and the 7-day diet and antibiotic treatment period. Between-group differences in microbial
richness and diversity were measured. DNA was extracted from fecal pellets using QIAamp DNA Stool
Mini Kit (Qiagen, Valencia, CA, USA), according to manufacturer’s protocol. After the concentration and
quality were determined with NanoPhotometer (Implen GmbH, Munich, Germany), sequencing of the
16S, V6 region was performed on Illumina sequencing system by Dr. Mike Wang's lab at David H.
Murdock Research Institute (DHMRI, Kannapolis, NC, USA). The bacterial and bioinformatic analysis was
21
Quantitative reverse transcriptase PCR
RNA was extracted from the ileum, colon, white adipose tissue using PureLink® RNA Mini Kit
(Life Technologies, Carlsbad, CA, USA) according to manufacturer’s protocol. After the concentration
and quality were determined with NanoPhotometer (Implen GmbH, Munich, Germany), quantitative
reverse transcriptase polymerase chain reaction (qRT-PCR) method was used for the assessment of gene
expression. First, cDNA synthesis was performed using High-Capacity cDNA Reverse Transcription Kits
(Applied Biosystems, Foster City, CA, USA) on an Eppendorf Mastercycle ProS (Eppendorf, Hamburg,
Germany). The second part was performed on the LightCycler® 480 Real-Time PCR System (Roche,
Penzberg, Upper Bavaria, Germany) using LightCycler® 480 Probes Master (Roche, Penzberg, Upper
Bavaria, Germany). TaqMan® Gene Expression Assays (Applied Biosystems, Foster City, CA, USA) were
purchased for the following genes: Defb1 (β-defensin 1), Defb2(β-defensin 2), Defb3 (β-defensin 3),
Defb4 (β-defensin 4), Pyy (PYY), Gcg (GLP-1), Adipoq (adiponectin), Lep (leptin), Pparg (PPARγ), Srebf1
(SREBP1) and Gapdh (glyceraldehyde 3-phosphate dehydrogenase). The real-time PCR reactions were
run in triplicate, and data were retrieved as CT values normalized to Gapdh and log2 transformed for
subsequent statistical analysis. Final data were expressed as ratios between sample, and the average of
the SFA_NonAbx group for each gene.
Plasma metabolic hormones and β-defensins assessment
Insulin, leptin, GIP, PYY, PP, amylin and ghrelin were analyzed using bead-based multiplex
assays (Millipore, Billerica, MA) on a Luminex 100 TM (LUminex, Austin, TX). Total β-defenins, β-defensin
14, adiponectin were measured by enzyme-linked immunosorbent assay ELISA (Millipore or
22
Bioinformatics analysis
The bioinformatics analysis of gut microbiome was performed by Dr. Raad Gharaibeh (UNCC,
USA) described as follows.
A single Illumina HiSeq2000 sequencing lane was used to generate 74,502,452 paired-end reads,
100 bases long, for a total of 73 multiplexed samples targeting the V6 region of the 16S rRNA gene. The
raw reads were subjected to a QC check using FastQC
(www.bioinformatics.babraham.ac.uk pro ects fast c ) and then processed as described previously [86,
87] except that a minimum of 70 continuous matching nucleotides at 97% similarity across the length of
the ungapped alignment was required to produce each merged sequence. For OTU clustering, we used
the program AbundantOTU+ v.0.93b (http://omics.informatics.indiana.edu/AbundantOTU/otu+.php)
with the “-abundantonly” option and reads from the each comparisons group were clustered together,
i.e. if the comparison was between SFA and PUFA, reads belonging to those samples were clusters alone.
Sequences that were not clustered into an OTU (singletons) were excluded from further analyses. We
employed UCHIME (http://www.drive5.com/uchime/) and the Gold reference database to screen for
the presence of chimeras in our OUT sequences and chimeric sequences were removed.
To facilitate the taxonomic classification and to compensate for the short read length of the
generated OTUs, BLASTn v. 2.2.26+ was used with an expectation value of e-5 to align the OTU
sequences to the Silva database (release 108, http://www.arb-silva.de/). After that, the standalone
version of the RDP classifier [88] v. 2.5 was used to classify the full-length Silva sequences with the best
BLASTn match to the OTU se uence re uiring an RDP confidence score ≥ 80%. A pivot table was
generated where each row represents a sample and each column contains the raw counts for each OTU.
23
〈(
) 〉
Normalized and log transformed OTU counts were used to produce a Bray-Curtis dissimilarity matrix
that was fed into mothur [89] v.1.25.0 for Principle Co-ordinate Analysis (PCoA).
To ensure the results are not pipeline-dependent, a parallel analysis using QIIME v.1.7.0 [90]
was also conducted, utilizing both de novo (at 97% similarity level) and close-reference OTU picking
approaches (at 97% similarity level using the Greengenes 97% reference dataset, release of May 2013)
and yielded similar results.
Statistical analysis
All statistical analysis was carried out using SPSS 15.0 software (IBM). All values were expressed
as mean and standard error of the mean. For body weight and food intake data, results were analyzed
for equal variances, followed by one-way repeated ANOVA in phase 1 and two-way repeated ANOVA in
phase 2. In phase 1, energy expenditure data was analyzed by Student’s t-test. In phase 2, gene
expression data, protein expression data, and energy expenditure data were analyzed by two-way
ANOVA with equal variance or Friedman test with unequal variance. Tukey or Mann Whitney U was used
as post hoc analysis. p<0.05 was considered statistically significant.
Results
The effect of dietary fat type on body weight, food intake and energy expenditure
To determine the effect of different types of high-fat diet with varying saturated and
polyunsaturated fatty acid content on energy balance, body weight and food intake were analyzed with
one-way repeated ANOVA. We found a significantly higher (p=0.016) body weight gain on the SFA diet
24
difference between groups began at day 10 and continued throughout the diet intervention (p<0.05,
Figure 4). After 36 days of diet intervention, the body weight of rats fed with the SFA diet was 8.68%
higher than the PUFA diet (p<0.05, Figure 4). Similarly, we found a significantly higher (p<0.05) food
intake on the SFA diet compared with the PUFA diet (Figure 5). The total food intake per rat on the SFA
diet was 9.12% more than on PUFA diet throughout 36 day diet intervention (p<0.05, Figure 6). However,
when food intake was normalized to body weight (calorie intake per kg body weight of rat), no
difference between groups was observed (Figure 7). Energy expenditure was measured at the end of 36
day diet intervention. No significant difference was seen between groups (Table 5).
Gut microbiome in response to diet intervention and antibiotic treatment
To determine the effect of dietary fatty acids and antibiotic treatment on gut microbiota
richness and diversity, 16S rRNA of fecal microbiota was analyzed. We found that the 36 day different FA
diet intervention did not change gut microbiota α-diversity and β-diversity (Figure 8a and Figure 8b). The
7-day antibiotic treatments changed rat gut microbiota α-diversity (p=0.01) (decreased about 50%) and
β-diversity on SFA diet (Figure 9a and Figure 9b). The effect of antibiotic treatment on gut microbiota of
rats on the PUFA diet was smaller than that seen on the SFA diet. There was a trend that 7-day
antibiotic treatments decreased the gut microbiota richness 28.6% (p=0.06) and changed the β-diversity
on the PUFA diet (Figure 9a and Figure 9b).
Antibiotic treatment on body weight, food intake and energy expenditure
During the 7-day antibiotic treatment, daily body weight and food intake were recorded. We
used two-way repeated ANOVA to see the effect of dietary fat type and antibiotic or their interaction
with energy balance. We found that rats on the SFA diet were heavier (p=0.04) than those on the PUFA
25
on body weight gain during the 7 days (Figure 10). Regarding food intake, we found that antibiotic
treatment significantly decreased total daily food intake per rat (p=0.006) and daily food intake per kg of
body weight in rats irrespective of dietary fat types (p<0.001) (Figure 11 and Figure 12). Daily food
intake per rat and daily food intake per kg of body weight were significantly lower with antibiotic
treatment than vehicle on Day 1, Day 2, Day 3 and Day 5 (p<0.05, Figure 11 and p<0.01, Figure 12).
However, there is no significant difference between SFA diet and PUFA diet on daily food intake per rat
and food intake per kg of body weight during the 7 day of antibiotic or vehicle treatment (Figure 11 and
Figure 12). Energy expenditure was measured at the end of the 7 day antibiotic or vehicle treatment
(Table 6). No significant differences were seen among the treatments.
Gut β-defensins gene expression and serum protein expressions in response to dietary fat
types and antibiotic treatment
To investigate whether the expression of gut β-defensins changed in response to different
dietary fat types and antibiotic treatment, qPCR was used to measure gene expression of β-defensin-1,
β-defensin-2, β-defensin-3, β-defensin-4 , and β-defensin-14 in ileum and colon which are the major
colonization sites of gut microbiota. The gene expression of β-defensin-1 and β-defensin-14 was not
detected in ileum and colon or the gene expression is too low to be detected by the machine (data not
shown). The gene expression of β-defensin-2, β-defensin-3, β-defensin-4 were detectable but at very
low levels. Rats on the PUFA diet increased β-defensin-2 (p=0.009), and β-defensin-3 gene expression
(p=0.012) in ileum compared of rats on the SFA diet with and without antibiotic treatment (Figure 13).
No significant differences between antibiotic and vehicle treatment were seen in β-defensins gene
expression in both ileum and colon (Figure 13 and Figure 14). As it was found β-defensins are the new
potential ligands to MC4R in brain, which might enter into blood and pass through blood brain barrier,
serum total β-defensins and β-defensin 14 protein expression were measured by ELISA. No significant
26
Gut hormone PYY and GLP-1 gene expression in response to dietary fat types and antibiotic
treatment
PYY and GLP-1 are secreted by L cells which are classically thought to be located in the distal
gut, predominantly the ileum and colon. Therefore, we investigated PYY (Pyy) and GLP-1 (Gcg) gene
expression in ileum and colon by qPCR. We found that rats on the SFA diet increased ileum Pyy (p=0.041)
and colon Gcg (p=0.036) compared of rats on the PUFA diet with and without antibiotic treatment
(Figure 17). No significant differences were seen in PYY and GLP-1 gene expression between antibiotic
and vehicle treatment in ileum and colon (Figure 17).
White adipose tissue leptin, adiponectin, PPARγ, and SREBP1 gene expression in response to
dietary fat types and antibiotic treatment
Gene expression of leptin, adiponectin, PPARγ and SREBP1 in white adipose tissue (WAT) were
determined by qPCR. We found that rats on the PUFA diet increased adiponectin (p=0.019) and
decreased SREBP1 (p=0.010) gene expression in WAT with and without antibiotic treatment (Figure 18).
Also, two way ANOVA analyses showed that there is an interaction between dietary fats and antibiotics
treatment on leptin (p=0.029), adiponectin (p=0.027) and PPARγ (p=0.013) gene expression (Figure 18).
Serum peripheral energy balance signals in response to dietary fat types and antibiotics treatment
We measured serum ghrelin, pancreatic polypeptide, PYY, insulin, glucagon, leptin and
27
Discussion
Not only the quantity of ingested fats, but also the composition the fatty acids have an effect
on obesity development. The results from our study supported the hypothesis that SFA diet is more
obesogenic than PUFA diet due to the increased food intake. However, we failed to observe an
association between dietary FA and gut microbiota on energy balance as the knockdown of gut
microbiota decreased rats’ food intake regardless of different dietary FA.
This study failed to find the potential mechanism for rats to increase food intake as no
differences were seen in serum protein expression of ghrelin, pancreatic polypeptide, PYY, insulin,
glucagon, leptin and adiponectin. However, the secretion and circulating levels of these
peripheral signals are all influenced by recent energy intake and dietary macronutrient content as well
as were time-dependent after a single meal [91, 92], it may be necessary to investigate these peripheral
hormone levels at different time points after a meal during the study to get the true whole picture of
peripheral signals in response to different dietary fat types. This is a limitation of our study to be
improved in future.
In this study, there was no effect of dietary fat types on energy expenditure. Total energy
expenditure was measured including obligatory energy expenditure which is required for performance
of cellular and organ functions (also called as resting energy expenditure), physical activity and adaptive
thermogenesis providing a comprehensive picture of the physiological effect of dietary fatty acid
composition on energy expenditure. Thus, data suggests that there is no significant difference between
SFA diet and PUFA diet on long term total energy expenditure.
36-day diet intervention did not change gut microbiota α-diversity and β-diversity. However,
28
It was reported that lard-based high fat diet increased the the abundance of the Mollicutes class of the
Firmicutes phylum and reduced the abundance of Bacteroidetes.[83] But little has been reported on
effects of different fatty acid diet on gut microbiota compositional pattern, which remains to be clarified
in a future study.
Here in, qPCR analysis showed that PUFA diet increased ileum β-defensin 2 and β-defensin 3
gene expression with and without antibiotic treatment. Β-defensins are components of endogenous
antimicrobials which provide a first of line of defence against potentially pathogenic microbes at the
body’s mucosal frontiers [46]. However, as the secretion of β-defensins is also in response to bacteria in
the intestine, the real relationship between β-defensins, dietary fatty acids and gut microbiota remains
to be clarified in a future study.
A 7-day imipenem/cilastatin treatment successfully decreased gut microbiota. Interestingly, the
effect of antibiotics treatment on gut microbiota of rats with the PUFA diet was smaller than those on
the SFA diet. The 7-day antibiotic treatment significantly decreased rats’ gut microbiota richness about
50% on the SFA diet but only decreased 28.6% on the PUFA diet. The result indicated that PUFA diet
might protect gut microbiota from antibiotics due to the proinflammatory property of n-6 PUFA as our
PUFA diet was safflower oil based high fat diet which was composed mainly of n-6 PUFA.
The blunting of gut microbiota significantly decreased the food intake regardless of different
dietary fatty acids. Thus, based on this result, no association was evident between dietary fatty acids on
food intake.
To discover potential mechanisms linking gut microbiota and food intake, we examined
potential mediators. However, no differences between antibiotic and vehicle treatment were seen in
serum protein expression of ghrelin, pancreatic polypeptide, PYY, insulin, glucagon, leptin and
29
peripheral hormones in response to gut microbiota change. Thus, how gut microbiota influenced food
intake remains to be clarified in a future study.
Recent work showed that β-defensins can bind to the MC4R to control feeding and body weight
[48]. Intracerebroventricular injection of human β-defensin 3 (HBD3) to male Wistar rats has an
inhibitory effect on both the food intake and body weight gain with the potential mechanism of blocking
AgRP [49]. Thus, we measured serum total β-defensins level and β-defensin 14 (homologues of HBD3)
[93]. No differences were seen between PUFA diet and SFA diet or between antibiotic and vehicle
treatment. Thus, β-defensins were not involved in mediating the different effects of SFA and PUFA diet
or gut microbiota effects on energy balance regulation.
In summary, SFA are more obesogenic than PUFA due to increased food intake. Decreased gut
microbiota decreased rats’ food intake regardless of dietary fatty acid composition. There is no
association between dietary fat types and gut microbiome on energy balance. The potential mechanisms
for how rats gained more weight with increased food intake and how the ablation of gut micrflora by
30
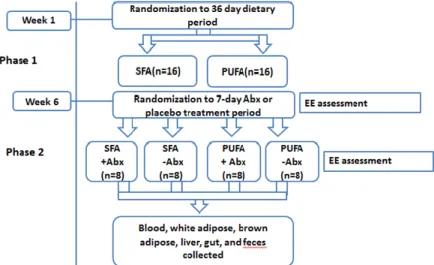
Figure 3 Study Design
32 7-week-old Sprague Dawley male rats were randomized to one of two diet groups (n=16 per group) as follows: 1) SFA-rich diet (45% energy from fat, predominant source butter and lard), and; 2) PUFA-rich diet (45% energy from fat, predominant source safflower oil). Animals were housed singly for accurate measurement of food intake and energy expenditure. Body weight and food intake were measured 3 times a week. Following 36-day of diet intervention, feces were collected and energy expenditure was measured. Then animals were further randomized to either antibiotic treatment or control group (n=8/ group) as follows: 1) Imipenem/cilastatin sodium at 50 mg/kg of body weight/day, or; 2) vehicle control (distilled water), for a treatment period of 7 days. Treatment and placebo were given via water. On the final day of 7-day antibiotic or vehicle treatment, feces were collected and energy expenditure was measured. Animals were euthanized via exsanguination under isoflurane and death confirmed via bilateral pneumothorax. Whole blood, white adipose tissue, brown adipose tissue, and liver were collected for further analysis.
31
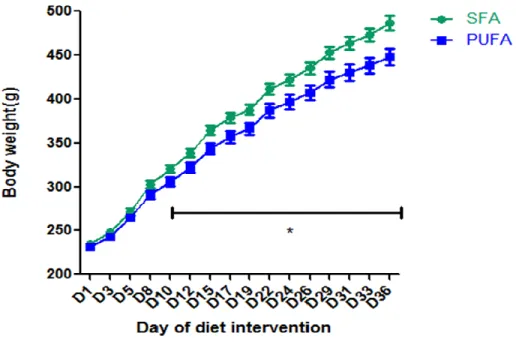
Figure 4 The effect of diet intervention on body weight:
During phase 1 of the study, 32 7-week-old Sprague Dawley male rats were randomized to two diet groups: SFA diet group (n=16) and PUFA diet group (n=16). Rats’ body weight was measured 3 times a week. Mean ± SEM is shown. One-way repeated ANOVA was used. Rats treated with SFA diet gained more body weight compared with those with PUFA diet (p=0.016). *T-test was used. The weight of rats treated with SFA diet is significantly higher than those with PUFA diet from D10 to D36 (p<0.05).
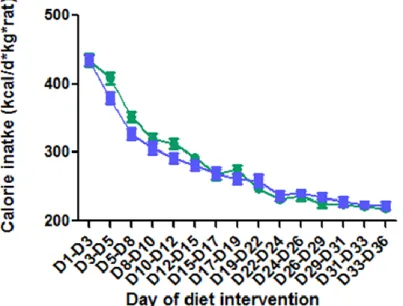
32 Figure 5 The effect of diet intervention on food intake:
During phase 1 of the study, 32 7-week-old Sprague Dawley male rats were randomized to two diet groups: SFA diet group (n=16) and PUFA diet group (n=16). Rats’ food intake was measured 3 times a week. Mean ± SEM is shown. One-way repeated ANOVA was used. Rats treated with SFA diet took in more food than those with PUFA diet. (P<0.05)
33
Figure 6 The effect of diet intervention on total food intake for 36 days:
During phase 1 of the study, 32 7-week-old Sprague Dawley male rats were randomized to two diet groups: SFA diet group (n=16) and PUFA diet group (n=16). 36 days’ of food intake was added up. Mean ± SEM is shown. Student’s t test was used. Rats treated with SFA diet took in more food than those with PUFA diet (*P<0.05).
Abbreviation: SFA, saturated fatty acids; PUFA, polyunsaturated fatty acids.
Figure 7 Effect of diet intervention on food intake normalized to body weight
During phase 1 of the study, 32 7-week-old Sprague Dawley male rats were randomized to two diet groups: SFA diet group (n=16) and PUFA diet group (n=16). Rats’ food intake and body weight were measured 3 times a week. Rats’ food intake was normalized to their body weight. Mean ± SEM is shown. One-way repeated ANOVA was used. No significant differences were seen.
34
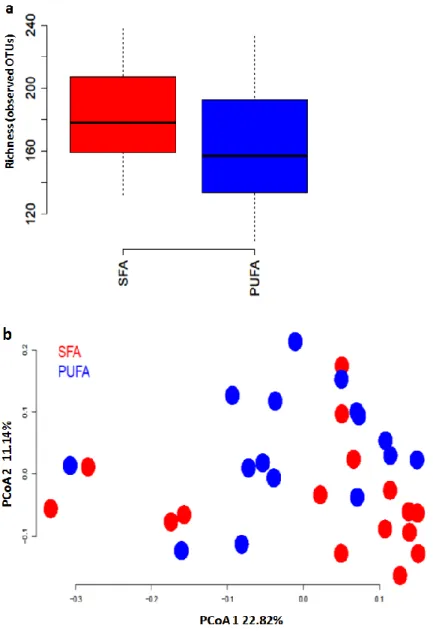
Figure 8 Effect of diet intervention on gut microbiome richness (α-diversity) and β-diversity 32 7-week-old Sprague Dawley male rats were randomized to two diet groups: SFA diet group (n=16) and PUFA diet group (n=16) for 36 days. At the end of 36 day diet intervention, rats’ feces were collected. DNA was extracted from feces. Sequencing of the 16S, V6 region was performed on Illumina sequencing system to determine the effect of difference diet on gut microbiome richness (α-diversity) and β-diversity. Figure 8a: Mann-Whitney U test was used to compare α-diversity between groups. Figure 8b: PCoA was used to compare β-diversity betw een groups. No significant differences were seen.
35
Figure 9 Effect of different diet intervention ± antibiotic treatment on rats’ gut microbiome richness (α-diversity) and β-diversity
32 7-week-old Sprague Dawley male rats were randomized to two diet groups: SFA diet group (n=16) and PUFA diet group (n=16) for 36 days. At the end of 36-day diet intervention, animals were further randomized to either antibiotic treatment or control group (n=8/ group) as follows: 1) Imipenem/cilastatin sodium at 50 mg/kg of body weight/day, or; 2) vehicle control (distilled water), for a treatment period of 7 days. At the end of 7 day antibiotic or vehicle treatment, rats’ feces were collected. DNA was extracted from feces. Sequencing of the 16S, V6 region was performed on Illumina sequencing system to determine the effect of antibiotic treatment on rats’ gut microbiome richness (α-diversity) and β-diversity on the SFA diet or the PUFA diet. Figure 9a: Mann-Whitney U test was used to compare α-diversity between groups. Figure 9b: PCoA was used to compare β-diversity between groups. Antibiotic treatment decreased
α-diversity compared with vehicle treatment (p=0.01 on the SFA diet and p=0.06 on the PUFA diet). Abbreviation: SFA Abx, saturated fatty acids diet with antibiotic treatment; SFA noAbx,
36
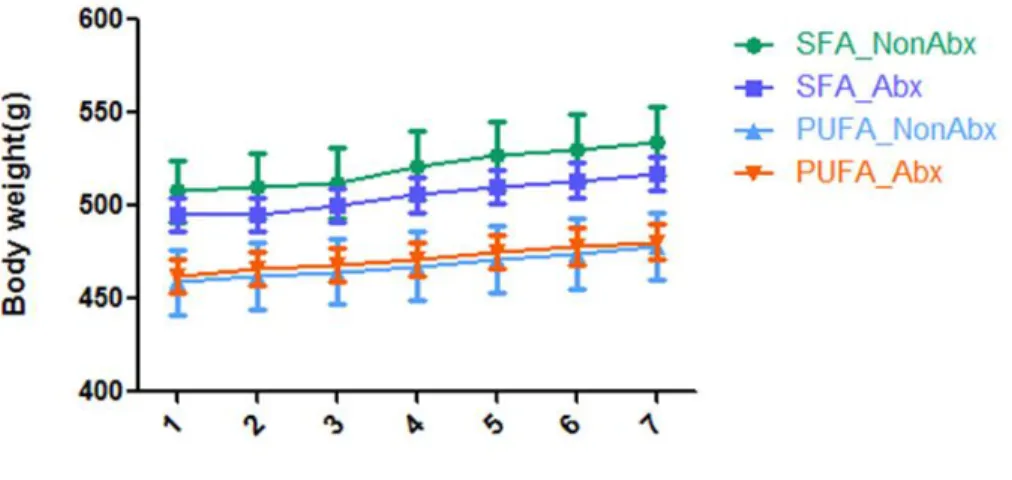
Figure 10 Effect of different diet intervention ± antibiotic treatment on rats’ body weight 32 7-week-old Sprague Dawley male rats were randomized to two diet groups: SFA diet group (n=16) and PUFA diet group (n=16) for 36 days. At the end of 36-day diet intervention, animals were further randomized to either antibiotic treatment or control group (n=8/ group) as follows: 1) Imipenem/cilastatin sodium at 50 mg/kg of body weight/day, or; 2) vehicle control (distilled water), for a treatment period of 7 days. Daily body weight was measured. Mean ± SEM is shown. Two-way repeated ANOVA was used. Rats on SFA-rich diet had higher body weight than those on the PUFA (p=0.006). No significant differences were seen between antibiotics and vehicle treatment on body weight during 7 days.
![Figure 1 Brain control of energy balance overview. (Adapted from [4])](https://thumb-us.123doks.com/thumbv2/123dok_us/8224219.2180356/26.918.135.451.104.372/figure-brain-control-energy-balance-overview-adapted.webp)
![Figure 2 The ARC and the control of energy balance. (Adapted from [4])](https://thumb-us.123doks.com/thumbv2/123dok_us/8224219.2180356/27.918.134.463.144.438/figure-arc-control-energy-balance-adapted.webp)
![Table 1 Gut hormones on appetite control (Summarized from [37, 40, 42, 85])](https://thumb-us.123doks.com/thumbv2/123dok_us/8224219.2180356/28.918.128.847.142.674/table-gut-hormones-appetite-control-summarized.webp)