Sinusoidal
Functions
GOALS
You will be able to
•
Identify situations that can be modelled using sinusoidal and other periodic functions•
Interpret the graphs of sinusoidal andother periodic phenomena
•
Understand the effect of applying transformations to the functionsand where xis
measured in degrees
•
Determine the equations of sinusoidal functions in real-world situations and use those equations to solve problemsg(x) 5cosx, f(x) 5sinx
This picture of NASA’s mission control shows the flight path of the space shuttle as it orbits Earth. What type of function would model this path?
6
Chapter
SKILLS YOU NEED
1. Marcus sells 100 T-shirts per week at a price of $30 per shirt. A survey indicates that if he reduces the price of each shirt by $2, he will sell 20 more shirts per week. If xrepresents the number of times the price is reduced by $2, then the revenue generated from T-shirt sales can be modelled by the
function .
a) Explain what the factors and represent
in .
b) How many times will the price have to be dropped for the total revenue to be 0?
c) How many times will the price have to be dropped to reach the maximum revenue?
d) What is the maximum revenue?
e) What price will the T-shirts sell for to obtain the maximum revenue? f ) How many T-shirts will be sold to obtain the maximum revenue?
2. An air hockey puck is shot to the opposite end of the table and ricochets back. The puck’s distance in centimetres from where it was shot in terms of time in seconds can be modelled by the graph shown at the left.
a) How far did the puck travel?
b) When was the puck farthest away from where it was shot? c) How fast was the puck travelling in the first 0.25 s? d) State the domain and range of the function.
3. Determine to the nearest degree.
a) b)
4. Determine the value of xin the triangle at the left to the nearest tenth of a metre.
5. Use transformations of the graph to sketch the graphs of the following:
a) c)
b) d)
6. An aerial photograph shows that a building casts a shadow 40 m long when the angle of elevation of the Sun was How tall is the building?
7. List all the different types of transformations that you know. For each one, describe how a graph of would change if the transformation is applied to it.
f(x) 5x2 32°. y5 22f(x23) y53f(x)
y5f(x) 14 y5 2f(x)
f(x) 52x
52° 9 cm
11 cm
40°
15 cm 22 cm
u R(x)
(100120x)
(3022x) R(x) 5 (3022x) (100120x)
6
Getting Started
60 120 180
0
Time (s) Puck Motion
D
is
ta
n
ce
(
cm
)
0.25 0.50
t d(t)
• For help, see Essential Skills Appendix.
Study
Aid
Question Appendix
3, 4, 5 A-16
6, 7 A-14
40 m 35°
x
How can you describe the flight of the arrow using this function?
A. What is the initial height of the arrow?
B. Calculate Explain what this value represents in this situation.
C. When will the arrow strike the ground?
D. When will the arrow reach its maximum height?
E. What is the maximum height reached by the arrow?
F. State the domain and range of the function in this situation.
G. Summarize what you determined about the relationship between the height of the arrow and time.
h(2). ?
APPLYING
What You Know
Flying Arrows
An arrow is shot into the air from the edge of a cliff. The height of the arrow above the ground is a function of time and can be modelled by
Periodic Functions and
Their Properties
6.1
YOU WILL NEED
• graph paper
Interpret and describe graphs that repeat at regular intervals.
GOAL
LEARN ABOUT
the Math
The number of hours of daylight at any particular location changes with the time of year. The table shows the average number of hours of daylight for approximately a two-year period at Hudson Bay, Nunavut. Note: Day 15 is January 15 of year 1. Day 74 is March 15 of year 1. Day 411 is February 15 of year 2.
Day 15 74 135 166 258 349 411 470 531 561 623 653 684 714
Hours of
6.7 11.7 17.2 18.8 12.9 5.9 9.2 14.6 18.8 18.1 12.9 10.2 7.5 5.9
Daylight
How many hours of daylight will there be on August 1 of year 3?
?
EXAMPLE
1
Representing data in a graph to make predictionsI drew a scatter plot with the day as the independent variable and the hours of daylight as the dependent variable. I drew a smooth curve to connect the points.
The data and graph repeat every 365 days. I can tell because the greatest number of hours of daylight occurs on days 166 and 531, and
The least number of hours of daylight occurs on days 349 and 714, also 365 days apart.
I used the pattern to extend the graph to year 3. That would be 1095 days.
I used the graph to estimate the number of hours of daylight for day 943.
53121665365.
Jacob’s Solution
The number of hours of daylight for day 943 is about 17 h.
24
18
12
365 730
Day number
Hours of Daylight in Hudson Bay
H
o
u
rs
o
f
d
ay
li
gh
t
Aug 1 day: 943
1095 6
Reflecting
A. Why does it make sense to call the graph of the hours of daylight a periodic function?
B. How does the table help you predict the periodof the graph?
C. Which points on the graph could you use to determine the range of this function?
D. How does knowing the period of a periodic graph help you predict future events?
APPLY
the Math
periodic function
a function whose graph repeats at regular intervals; the y-values in the table of values show a repetitive pattern when the
x-values change by the same increment
period
the change in the independent variable (typically x)
corresponding to one cycle; a cycle of a periodic function is a portion of the graph that repeats
period
1 cycle
x y
0
EXAMPLE
2
Interpreting periodic graphs and connecting them to real-world situationsPart A: Analyzing a Cutting Blade’s Motion
This is a periodic function.
It’s a periodic function because the graph repeats in exactly the same way at regular intervals.
Tanya’s mother works in a factory that produces tape measures. One day, Tanya and her brother Norman accompany their mother to work. During manufacturing, a metal strip is cut into 6 m lengths and is coiled within the tape measure holder. A cutting machine chops the strips into their appropriate lengths. Tanya’s mother shows a graph that models the motion of the cutting blade on the machine in terms of time.
0 0.5
1.0
Time (s) Cutting Blade Motion
H
e
ig
h
t
(c
m
)
9.0 8.0 7.0 6.0 5.0 4.0 3.0 2.0 1.0
How can Norman interpret the graph and relate its characteristics to the manufacturing process?
The cutting blade cuts a new section of metal strip every 4 s because the graph has a pattern that repeats every 4 s.
The y-value is always 0.5 cm or less, so the blade can’t be higher than this. When the height is 0 cm, the blade is hitting the cutting surface.
Flat sections, like the ones from 0 to 3.0 and 4.0 to 7.0, must mean that the blade stops for these intervals. The machine is probably pulling the next 6 m section of metal strip through before it’s cut.
Parts of the graph, like from to show that the blade takes 0.5 s to go down.
Other parts of the graph, like from to show that the blade takes 0.5 s to go up.
Since the graph repeats every 4 s and the blade hits the surface at 3.5 s and 7.5 s, I can figure out the next time it will hit the surface.
t54.0, t53.5
t53.5,
t53.0
The period of this function is 4 s.
The maximum height of the blade is 0.5 cm. The minimum height is 0 cm.
The blade stops for 3 s intervals.
The blade takes 1 s to go up and down.
The blade will strike the cutting surface again at 11.5 s and every 4 s after that.
0 0.5 1.0
Time (s)
H
e
ig
h
t
(c
m
)
4.0 4
3.0 2.0 1.0
Part B: Analyzing the Motion of the Tape as It Is Spooled
Farther down the assembly line, the metal strip is raised and spooled onto a rotating cylinder contained within the tape measure.
It’s a periodic function because the graph repeats in exactly the same way at regular intervals. This time the action is smooth.
The highest the graph goes is 9 mm, and the lowest is 1 mm. The heights are always at or between these two values.
The first troughis at The next trough is at The distance between the two troughs gives the period.
I could also have measured the distance between the first two peaks
to get that value.
The period represents the time it takes for the rotating cylinder to make one complete revolution.
t50.25. t50. This is a periodic function.
The range for this function is
The period of this function is 0.25 s. 5h[R| 1#h#96.
Tanya’s mother shows them a graph that models the height of the end of the strip in terms of time.
2.0 4.0 6.0 8.0 10.0
0
Height of the End of the Metal Strip
H
e
ig
h
t (
m
m
)
0.25 0.75
Time (s)
0.50 1.00 1.25 1.50
t h
How can Tanya interpret the graph and relate its characteristics to the manufacturing process?
Tanya’s Solution
trough
the minimum point on a graph
peak
the maximum point on a graph
end of strip
peak trough
I calculated the halfway point between the maximum and minimum values of the graph, giving me the
equation of the axis.
The amplitudeof a function is the vertical distance from its axis to its maximum value (9 mm).
(h55) The equation of the axis for this
function is
The amplitude of this function is 4 mm.
92554 h 55. 911
2 55
equation of the axis
the equation of the horizontal line halfway between the maximum and the minimum; it is determined by
y5maximum value12 minimum value
amplitude
half the difference between the maximum and minimum values; it is also the vertical distance from the function’s axis to the maximum or minimum value
EXAMPLE
3
Identifying a periodic function from its graphThe graph looks like a series of waves that are the same size and shape. The waves repeat at regular intervals, so the function is periodic.
The graph repeats its pattern every 365 days. That is the period of the function.
To get the equation of the axis, I calculated the halfway point between the maximum and minimum values of the height.
The amplitude is the vertical distance from its axis to the maximum value (18 h) or minimum value (6 h).
(h512)
Determine whether the term periodiccan be used to describe the graph for each situation. If so, state the period, equation of the axis, and amplitude.
a) the average number of b) the motion of a piston on an c) a student is moving a metre stick hours of daylight over a automated assembly line back and forth with progressively
three-year period larger movements
a) periodic
amplitude56 h 1821256 equation of the axis: h512
1816
2 512
period51 year
6 12
H
o
u
rs
18
0 365 730
Days
1095 Daylight Hours
⫺1
⫺3
0
6 12 18
1
⫺5
H
e
ig
h
t
(c
m
)
Time (s) Piston Motion
2 2
⫺02
6
⫺6
4 6 8 10
D
is
ta
n
ce
(
cm
)
Time (s) Metre Stick Motion
In Summary
Key Ideas
• A function that produces a graph that has a regular repeating pattern over a constant interval is called a periodic function. It describes something that happens in a cycle, repeating in the same way over and over.
• A function that produces a graph that does not have a regular repeating pattern over a constant interval is called a nonperiodic function.
Need to Know
• Extending the graph of a periodic function by using the repeating pattern allows you to make reasonable predictions by extrapolating.
• The graph of a periodic function permits you to figure out the key features of the repeating pattern it represents, such as the period, amplitude, and equation of the axis.
The shape of the graph repeats over the same interval, so the function is periodic.
The graph repeats every 6 s, so that’s the period of the function.
The equation of the axis is halfway between the maximum of 1 and the minimum of
The distance between the maximum and the axis is 3.5.
The shape of the graph does not repeat over the same interval, so the function is not periodic.
26. b) periodic
period s
equation of the axis:
amplitude cm
c) nonperiodic
This means that the function does not have a period, amplitude, or equation of the axis.
53.5 12 (22.5) 53.5
h 5 22.5 11 (26)
2 5 22.5
56
2 4 6
0
2 4 6 8 10 12 14 16 18 20 22
Time (s)
H
e
ig
h
t
ab
o
ve
gr
o
u
n
d
(
m
)
CHECK
Your Understanding
1. Which of the following graphs are periodic? Explain why or why not.
a) c)
b) d)
2. Determine the range, period, equation of the axis, and amplitude of the function shown.
3. The motion of an automated device for attaching bolts to a household appliance on an assembly line can be modelled by the graph shown at the left.
a) What is the period of one complete cycle?
b) What is the maximum distance between the device and the appliance? c) What is the range of this function?
d) If the device can run for five complete cycles only before it must be turned off, determine the domain of the function.
e) Determine the equation of the axis. f ) Determine the amplitude.
g) There are several parts to each complete cycle of the graph. Explain what each part could mean in the context of “attaching the bolt.”
6
2 4 8 10
0
x f(x)
16 18 20 14
12 10 8 6 4 2
0
f(x)
x
1
5 10
0
f(x)
x
5
5
0
f(x)
x
4
–4
5 10
0 20
–20
1 2
f(x)
x
0.5 1.0 1.5
0
x y
3 2 Time (s)
Bolt Machine Motion
1
D
is
ta
n
ce
b
e
tw
e
e
n
d
e
vi
ce
an
d
a
p
p
li
an
ce
(
cm
PRACTISING
4. Identify which graphs are periodic. Estimate the period of the functions that you identify as periodic.
a) d)
b) e)
c) f )
5. Which of the following situations would produce periodic graphs?
a) Sasha is monitoring the height of one of the cutting teeth on a chainsaw. The saw is on the ground, and the chain is spinning.
• independent variable: time
• dependent variable: height of tooth above the ground b) Alex is doing jumping jacks.
• independent variable: time
• dependent variable: Alex’s height above the ground
c) The cost of riding in a taxi varies, depending on how far you travel. • independent variable: distance travelled
• dependent variable: cost
d) Brittany invested her money in a Guaranteed Investment Certificate whose return was 4% per year.
• independent variable: time
• dependent variable: value of the certificate
0
⫺2
⫺4
⫺6
10 20 30 40 50 60
f(x)
x
2
2 4 6 8 10 12
0
⫺2
⫺4
f(x)
x
2
0
⫺2
⫺4
4
2 4 6 8 10 12
f(x)
x
2
2 4 6 8 10 12
0
⫺2
⫺4
4 f(x)
x
2
2 4 6 8 10
0 4 6 8
f(x)
x
2 2
0
⫺2
⫺4
4
6 10 14 18 22
f(x)
e) You throw a basketball to a friend, but she is so far away that the ball bounces on the ground four times.
• independent variable: distance • dependent variable: bounce height
f ) The antenna on a radar tower is rotating and emitting a signal to track incoming planes.
• independent variable: time
• dependent variable: intensity of the signal
6. Which of the tables of values might represent periodic functions? Justify.
a) x y b) c) d)
9
4
1
0
1
0 4
1 9
2 16
21 22
23 24
25
x y
0.7 5
0.9 6
1.1 7
1.3 5
1.5 6
1.7 7
1.9 5
2.1 6
x y
23 ⫺6
26 ⫺6.5
29 ⫺7
32 ⫺7.5
35 ⫺8
38 ⫺8.5
41 ⫺9
44 ⫺9.5
x y
1 5
2 6
4 5
7 6
11 5
16 6
22 5
29 6
7. Chantelle has a submersible pump in her basement. During a heavy rain, the pump turned off and on to drain water collecting under her house’s foundation. The graph models the depth of the water below her basement floor in terms of time. The depth of the water decreased when the pump was on and increased when the pump was off.
6
2 4 8 10
0 6 8 10 12 14 16 18 20 22
Time (min)
Depth of Water under Basement Floor
D
e
p
th
(
cm
)
4 2
a) Is the function periodic?
b) At what depth does the pump turn on? c) How long does the pump remain on?
d) What is the period of the function? Include the units of measure. e) What is the range of the function?
f ) What will the depth of the water be at 3 min? g) When will the depth of the water be 10 cm? h) What will the depth of the water be at 62 min?
water enters here water
pumped to
surface cable
pump
intake
8. While riding on a Ferris wheel, Trevor’s height above the ground in terms of time can be represented by the graph shown.
0 6
2 4
16 18 14
12
10 20 22
8 6
Time (s)
Trevor’s Height above the Ground
H
e
ig
h
t
ab
o
ve
gr
o
u
n
d
(
m
)
4 2
a) What is the period of this function, and what does it represent? b) What is the equation of the axis?
c) What is the amplitude?
d) What is the range of the function?
e) After 24 s, when will Trevor be at the lowest height again? f ) At what times is Trevor at the top of the wheel?
g) When will his height be 4 m between 24 s and 30 s?
9. Sketch the graph of a periodic function with a period of 20, an amplitude of 6, and whose equation of the axis is
10. Sketch the graph of a periodic function whose period is 4 and whose range is
11. Maria’s bicycle wheel has a diameter of 64 cm. As she rides at a speed of 21.6 km/h, she picks up a stone in her tire. Draw a graph that shows the stone’s height above the ground as she continues to ride at this speed for 2 s more.
12. A spacecraft is in an elliptical orbit around Earth. The spacecraft’s distance above Earth’s surface in terms of time is recorded in the table.
5 y[R|22#y#56.
y57.
Time
0 6 12 18 24 30 36 42 48 54 60 66 72 78
(min)
Distance
550 869 1000 869 550 232 100 232 550 869 1000 869 550 232
(km)
a) Plot the data, and draw the resulting curve. b) Is the graph periodic?
c) What is the period of the function, and what does it represent? d) What is the approximate distance between the spacecraft and Earth at
8 min?
e) At what times is the spacecraft farthest from Earth?
f ) If the spacecraft completes only six orbits before descending to Earth, what is the domain of the function?
A
13. Water is stored in a cylindrical container. Sometimes water is removed from the container, and other times water is added. The table records the depth of the water at specific times.
a) Plot the data, and draw the resulting curve. b) Is the graph periodic?
c) Determine the period, the equation of the axis, and the amplitude of the function.
d) How fast is the depth of the water increasing when the container is being filled?
e) How fast is the depth of the water decreasing when the container is being drained?
f ) Is the container ever empty? Explain.
14. Write a definition of a periodic function. Include an example, and use your definition to explain why it is periodic.
Extension
15. A Calculator-Based Ranger (CBR) is a motion detector that can attach to a graphing calculator. When the CBR is activated, it records the distance an object is in front of the detector in terms of time. The data are stored in the calculator. A scatter plot based on those recorded distances and times can then be drawn using the graphing calculator. Distance is the dependent variable, and time is the independent variable. Denis holds the paddle of the CBR at 60 cm for 3 s and then, within 0.5 s, moves the paddle so that it is 30 cm from the detector. He holds the paddle there for 2 s and then, within 0.5 s, moves the paddle back to the 60 cm location. Denis repeats this process three times.
a) Draw a sketch of the resulting graph. Include a scale. b) What is the period of the function?
c) Determine the range and domain of the function.
16. Describe the motion of the paddle in front of a CBR that would have produced the graph shown.
1
Time (s)
D
is
ta
n
ce
(c
m
)
2 3 4
0 10 20 30 40 50 6070 Time
0 1 2 3 4 5 6 7 8 9 10 11 12 13 14 15 16 17 18 19
(min)
Depth
10 20 30 40 40 40 25 10 20 30 40 40 40 25 10 20 30 40 40 40
(cm)
YOU WILL NEED
• cardboard • ruler • protractor • metre stick • thumbtack • graphing calculator
Examine the two functions that are associated with all sinusoidal functions.
GOAL
INVESTIGATE
the Math
Paul uses a generator powered by a water wheel to produce electricity. Half the water wheel is submerged below the surface of a river. The wheel has a radius of 1 m. A nail on the circumference of the wheel starts at water level. As the current flows down the river, the wheel rotates counterclockwise to power the generator. The height of the nail changes as the wheel rotates.
Investigating the Properties
of Sinusoidal Functions
6.2
nail angle of rotation
1 m 1 m
current
height height
How can you describe the position of the nail using an equation?
A. Construct a scale model of the water wheel. On a piece of cardboard, cut out a circle with a radius of 10 cm to represent the water wheel’s 1 m radius.
B. Locate the centre of the circle. Use a protractor to divide your cardboard wheel into increments through the centre. Draw a dot to represent the nail on the circumference of the circle at one of the lines you drew to divide the wheel.
C. On a rectangular piece of cardboard about 100 cm long and 30 cm wide, draw a horizontal line to represent the water level and a vertical line both through the centre. Attach the cardboard wheel to the centre of the rectangular piece of cardboard with a thumbtack, with the rectangle behind the wheel.
30°
?
30°
D. Rotate the cardboard wheel counterclockwise. Measure the height, h, of the nail: the perpendicular distance from the nail to the horizontal line. Copy the table, and record the actualdistance the nail is above the horizontal line at
by multiplying the scale height by 10 and converting to metres. Continue to rotate the wheel in increments, measuring hand recording the actual heights. If the nail goes below the horizontal line, record the height as a negative value. Continue until the nail has rotated 720°.
30°
30°
30°
E. Use your data to graph height versus angle of rotation.
F. Use your model of the water wheel to examine the horizontal distance, d, the nail is from a vertical line that passes through the centre of the water wheel. Start with the nail initially positioned at water level.
h
1
d
Rotate the cardboard wheel counterclockwise, and measure the distance the nail is from the vertical line. Copy the table, and record the actual distance the nail is from the vertical line at again adjusting for the scale factor. Continue to rotate the wheel in increments, and record the actual distances. If the nail goes to the left of the vertical line, record the distance as a negative value. Continue until the nail has rotated 720°.
30°
30°, 30°
sinu
360°
330°
300°
270°
240°
210°
180°
150°
120°
90°
60°
30°
0°
u cosu
360°
330°
300°
270°
240°
210°
180°
150°
120°
90°
60°
30°
0°
u You can generate the tables using the List feature on your graphing calculator. Try putting degrees in L1, replacing L2 with “cos(L1)” and L3 with “sin(L1).”
Tech
Support
G. Use your data to graph horizontal distance versus angle of rotation.
H. Use your graphing calculator to determine the cosine and sine of each rotation angle. Make sure your calculator is in DEGREE mode and evaluate to the nearest hundredth.
Angle of Rotation, (º) 0 30 60 90 120 • • • 690 720
Actual Height of
0 1
Nail, h(m)
u
Angle of Rotation, (º) 0 30 60 90 120 • • • 690 720
Actual Distance from
0 1
I. Based on the tables you created in parts D, F, and H, select the appropriate equation that describes the height, h, of the nail on the water wheel in terms of the rotation. Also, identify another equation that describes the distance, d, the nail is from the vertical line in terms of the rotation.
Reflecting
J. Use your graphing calculator to graph and where and compare these graphs to the graphs from parts E and G. Use words such as amplitude, period, equation of the axis, increasing intervals, decreasing intervals, domain, and rangein your comparison.
K. State the coordinates of five key points that would allow you to draw the sinusoidal function quickly over the interval to
L. State the coordinates of five key points that would allow you to draw the sinusoidal function quickly over the interval to
M. What transformation can you apply to the cosine curve that will result in the sine curve?
N. What ordered pair could you use to represent the point on the wheel that corresponds to the nail’s location in terms of , the angle of rotation?
APPLY
the Math
u
360°. 0°
y5cosx
360°. 0°
y5sinx 0°#x#360°,
y5cos x, y5sin x
h(u) 5cosu u(d) 5sinh
h(u) 50.5 u h(u) 5sinu
d(u) 5cosu u(d) 5sind
d(u) 50.5 u d(u) 5sinu
sinusoidal function
a periodic function whose graph looks like smooth symmetrical waves, where any portion of the wave can be horizontally translated onto another portion of the curve; graphs of
sinusoidal functions can be created by transforming the graph of the function or y5cosx
y5sinx
2
2 4 6 8 10
0
⫺2
4 y
x EXAMPLE
1
Identifying the functionDetermine whether the graph represents a periodic function. If it does, determine whether it represents a sinusoidal function.
a) c)
b) d)
⫺4 ⫺2
2
10 20 30 40 50 0
f(x)
x
2 2
⫺4 ⫺2
0
4 6 8 10
f(x)
x
5 0 10 20
10 15 20 25
f(x)
x
2
⫺4
⫺6 ⫺2
0
4 6 8 10
f(x)
x
For help graphing
trigonometric functions on your graphing calculator, see Technical Appendix, B-14.
a) periodic and sinusoidal The function repeats, so it’s periodic. It looks like smooth symmetrical waves, where any portion of the wave can be
horizontally translated onto another portion of the curve.
The pattern repeats but the waves aren’t symmetrical.
It looks like smooth symmetrical waves; however, I can’t horizontally translate any portion of the wave onto another portion of the curve.
The pattern repeats but the waves aren’t smooth curves.
b) periodic
c) neither periodic nor sinusoidal
d) periodic
Bridget’s Solution
EXAMPLE
2
Identifying the properties of a sinusoidal functionGraph the function on a graphing calculator using the WINDOW settings shown in DEGREE mode.
a) Is the function periodic? If it is, is it sinusoidal?
b) From the graph, determine the period, the equation of the axis, the amplitude, and the range.
c) Calculate
Beth’s Solution
f(20°).f(x) 54sin(3x) 12
Because it repeats, the graph is periodic.
Since it forms a series of identical, symmetrical smooth waves, it is sinusoidal.
b)
equation of the axis: y5 2216 2
period5120° The graph completes three cycles in so one cycle, which is the period, must be
The axis is halfway between the minimum of and the maximum of 6.
22
120°. 360°,
For the range, the greatest y-value on the graph (the maximum) is 6, and the least y-value (the minimum) is 22.
range: 5y[R |22#y#66
To get the amplitude, I calculated the vertical distance between a maximum and the axis. It’s 4.
c)
55.464
84(0.866) 12 54sin(60°)12 f(20°) 54sin(3(20°) )12
f(x) 54 sin(3x)12 means find ywhen I substituted 20 for xand then calculated y.
x520°. f(20°)
amplitude54 62254 y52
EXAMPLE
3
Determining the coordinates of a point from a rotation angleDetermine the coordinates of the point
resulting from a rotation of centred at the origin and starting from the point (3, 0).
70°
P(x, y)
(0, 0) 70°
(3, 0)
P(x, y)
and
P(x, y) 5 (3 cos u, 3 sin u) y53sinu x53cosu
3 15
y sinu 3
1 5 x cosu sinu 5 y
r sinu 5 opp
hyp
The water wheel solution was based on a circle of radius 1. The coordinates of the nail after a rotation of were
But this circle doesn’t have a radius of 1. Its radius is 3.
I used similar triangles to figure out the coordinates of the larger triangle.
(cosu,sinu).
u
This means that the coordinates of the new point after a rotation of from the point (r, 0) about (0, 0) can be determined from
I substituted the radius and angle of rotation into the ordered pair
( ) and got the coordinates of the image point.
rcosu,rsinu
(rcosu,rsinu). u The coordinates for any point
on a circle of radius rare
8 (1.03, 2.82)
P(x, y) 5 (3cos70°,3sin70°) P(x, y) 5 (rcos u,rsinu). P(x, y)
sin cos
3
1
x
y
In Summary
Key Idea
• The function is a periodic function that represents the height
(vertical distance) of a point from the x-axis as it rotates about a circle with radius 1. • The function is a periodic function that represents the horizontal
distance of a point from the y-axis as it rotates about a circle with radius 1.
Need to Know
• The graph of has these characteristics: • The period is
• The amplitude is 1, the maximum value is 1, and the minimum value is • The domain is and the range is
• The zeros are located at 0°,180°,360°,....
21#f(u) #1.
5u[R6,
21.
360°.
f(u)5sinu
u° f(u)5cosu
u° f(u)5sinu
Anne’s Solution
90° 1
⫺1
0 180° 270° 360°
f( )
f( ) = sin
• The graph of has these characteristics: • The period is
• The amplitude is 1, the maximum value is 1, and the minimum value is • The domain is and the range is
• The zeros are located at ....
• The sine function and cosine function are congruent sinusoidal curves; the cosine curve is the sine curve translated to the left.
• Any point on a circle centred at (0, 0) with radius rand rotated through an angle ucan be
expressed as an ordered pair (rcosu,rsinu). P(x,y)
90°
450°, 270°, 90°,
21#f(u) #1.
5u[R6,
21.
360°.
f(u)5cosu
90° 1
⫺1
0 180° 270° 360°
f( )
f( ) = cos
CHECK
Your Understanding
1. Using a graphing calculator in DEGREE mode, graph each sinusoidal function. Use the WINDOW settings shown. From the graph, state the amplitude, period, and equation of the axis for each.
a) b)
2. a) If calculate
b) If and list the values of xwhere
3. A buoy rises and falls as it rides the waves. The equation
models the displacement of the buoy, h(t), in metres at tseconds. a) Graph the displacement from 0 s to 20 s, in 2.5 s intervals. b) Determine the period of the function from the graph. c) What is the displacement at 35 s?
d) At what time, to the nearest second, does the displacement first
reach m?
4. Determine the coordinates of the new point after a rotation of about (0, 0) from the point (2, 0).
PRACTISING
5. Using a graphing calculator and the WINDOW settings shown, graph each function. Use DEGREE mode. State whether the resulting functions are periodic. If so, state whether they are sinusoidal.
a) c) e)
b) d) f )
6. Based on your observations in question 5, what can you conclude about any function that possesses sine or cosine in its equation?
7. If and where calculate each and
explain what it means.
a) b)
8. Using a graphing calculator in DEGREE mode, graph each sinusoidal function. Use the WINDOW settings shown. From the graph, state the amplitude, period, increasing intervals, decreasing intervals, and equation of the axis for each.
a) c) e)
b) y53sinx11 d) y5sin(2x) 21 f ) y53sin(0.5x) 12 y52sin(0.25x) y5sin(0.5x) 12
y52sinx13
h(90°)
g(90°)
0° #x #360°, h(x) 5cosx,
g(x) 5sinx
y5sin90° y50.005x1sinx
y5 (0.004x)sinx
y50.5cosx21 y5cos (2x) 2sinx
y53 sinx11
50°
20.8
h(t) 5cos(36t)° 0°#x#360°. f(x) 50,
f(x) 5cosx
h(25°). h(x) 5sin(5x) 21,
y54cos(0.5x) 22 y53sin(2x) 11
9. a) If calculate
b) If calculate
c) If calculate
d) If and calculate xfor
e) If and calculate xfor
10. Determine all values where for .
11. a) Determine the coordinates of the new point after a rotation of about (0, 0) from the point (1, 0).
b) Determine the coordinates of the new point after a rotation of about (0, 0) from the point (5, 0).
c) Determine the coordinates of the new point after a rotation of about (0, 0) from the point (4, 0).
d) Determine the coordinates of the new point after a rotation of about (0, 0) from the point (3, 0).
12. Sketch the sinusoidal graphs that satisfy the properties in the table. 230°
120°
80°
25°
2360°#x#360° sinx5cosx
0°#x#360°. f(x) 5 21,
f(x) 5sinx
0°#x#360°. f(x) 5 21,
f(x) 5cosx
h(20°). h(x) 5cos(3x) 11,
g(10°). g(x) 5sin(2x),
f(35°). f(x) 5cosx,
Equation of
Period Amplitude the Axis Number of Cycles
a) 4 3 y55 2
b) 20 6 y54 3
c) 80 5 y5 22 2
13. Jim is riding a Ferris wheel, where tis time in seconds. Explain what each of the following represents.
a) where
b) where
14. Compare the graphs for and , where .
How are they the same, and how are they different?
Extending
15. If the water level in the original water wheel situation was lowered so that three-quarters of the wheel was exposed, determine the equation of the
sinusoidal function that describes the height of the nail in terms of the rotation.
16. A spring bounces up and down according to the model
where is the displacement in centimetres from the rest position and tis time in seconds. The model does not consider the effects of gravity.
a) Make a table for Use 0.5 s intervals. b) Draw the graph.
c) Explain why the function models periodic behaviour.
d) What is the relationship between the amplitude of the function and the displacement of the spring from its rest position?
0#t#9. d(t)
d(t) 50.5cos (120t)° , 0°#x#360° y5cosx
y5sinx h(t) 55 sin(18t)° h(10),
h(t) 55 cos(18t)° h(10),
T
A
Interpreting Sinusoidal
Functions
6.3
Relate details of sinusoidal phenomena to their graphs.
GOAL
LEARN ABOUT
the Math
Two students are riding their bikes. A pebble is stuck in the tire of each bike. The two graphs show the heights of the pebbles above the ground in terms of time.
Glen’s Solution: Comparing Periods
50 40 30 20 10 60
0
Time (s)
Height of a Pebble
H
e
ig
h
t
(c
m
)
1 2
Bike A Bike B
3
t h
The graph for Bike A completes 5 cycles in 3 s, so the period, or length of one cycle, is 0.6 s.
The graph for Bike B completes 2 cycles in 1 s, so the period is 0.5 s.
The wheel on Bike A takes 0.6 s to complete one revolution. The wheel on Bike B takes 0.5 s to complete one revolution.
The period of Bike A is 0.6 s. The period of Bike B is 0.5 s.
What information about the bikes can you gather from the graphs of these functions?
?
EXAMPLE
1
Connecting the graph of a sinusoidal function to the situationFor Bike A, the graph starts at a peak. For Bike B, the graph starts at a trough.
I noticed that the peaks on the graph are different. The peak for Bike A is at which is greater than the peak for Bike B, which is at The troughs, however, are the same, h50.
h550. h560, Joanne’s Solution: Comparing Peaks of a Sinusoidal Function
For Bike A, the pebble was initially at its highest height of 60 cm. For Bike B, the pebble was initially at its lowest height of 0 cm.
Speed is equal to distance divided by time, so first I had to figure out how far each bike travels when the wheel completes one revolution. This distance is the
circumference. I calculated the two circumferences.
To calculate the speed, I divided each circumference by the time taken to complete one revolution.
The bikes are travelling at the same speed.
Circumference:
Bike A Bike B
sB83.14m>s
sA83.14m>s
sB5
1.571 0.5 sA5
1.885 0.6
sB5
d t sA5
d t
CB81.571m
CA81.885m
CB8157.1cm
CA8188.5cm
CB550p
CA560p
CB52p(25)
CA52p(30)
CB52prB
CA52prA
Scott’s Solution: Comparing Equations of the Axes in Sinusoidal Functions
Karen’s Solution: Comparing Speeds
The axis is halfway between a peak (or maximum) and a trough (or minimum). I added the maximum and the minimum and then divided by 2.
The equation of the axis for Bike A is
The equation of the axis for Bike B is
The axle for the wheel on Bike A is 30 cm above the ground. The axle for the wheel on Bike B is 25 cm above the ground.
h525. h530. Bike B: 5010
2 525
Bike A: 6010
APPLY
the Math
Reflecting
A. How would changing the speed of the bike affect the sinusoidal graph?
B. For a third rider travelling at the same speed but on a bike with a larger wheel than that on Bike A, how would the graph of the resulting sinusoidal
function compare with that for Bike A and Bike B?
C. What type of information can you learn by examining the graph modelling the height of a pebble stuck on a tire in terms of time?
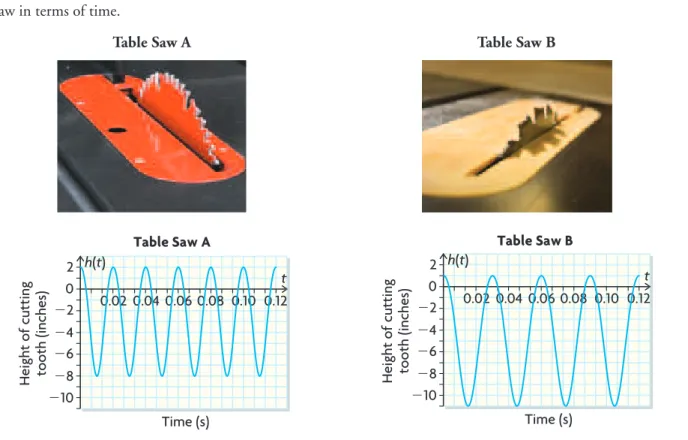
EXAMPLE
2
Comparing graphs and situationsAnnette’s shop teacher was discussing table saws. The teacher produced two different graphs for two different types of saw. In each case, the graphs show the height of one tooth on the circular blade relative to the cutting surface of the saw in terms of time.
Table Saw A Table Saw B
What information about the table saws can Annette gather from the graphs? ⫺6
⫺8
⫺10 ⫺2
⫺4
0 2
Time (s)
Table Saw B
H
e
ig
h
t
o
f
cu
tt
in
g
to
o
th
(
in
ch
e
s) 0.02 0.04 0.060.08 0.10 0.12 t h(t)
⫺6
⫺8
⫺10 ⫺2
⫺4
0 2
Time (s)
H
e
ig
h
t
o
f
cu
tt
in
g
to
o
th
(
in
ch
e
s) 0.02 0.04 0.060.08 0.10 0.12 t h(t)
Repko’s Solution
The peaks on the graph are different. The peak for A is at the peak for B is at
One of the easiest ways to find the period is to figure out how long it takes to go from one peak on the graph to the next.
On graph A, the first peak is at 0 s, and the next is at 0.02 s. This means that the period of graph A is 0.02 s.
On graph B, the first peak is at 0 s, and the next is at 0.03 s. The period of graph B is 0.03 s.
For graph A, I found the equation of the axis by adding 2 and and then dividing by 2. That gave me The equation of the axis for graph A is
For graph B, I added 1 and and then divided by 2. That gave me The equation of the axis for graph B is
For graph A, I got the amplitude by taking the difference between 2 and The amplitude for graph A is 5.
For graph B, the amplitude is the difference between 1 and The amplitude for graph B is 6.
In both cases, the distance from the axis to a peak represents the radius of the circular cutting blade.
25.
23. h5 25.
25.
211
h5 23. 23.
28
h51. h52;
The blade on Table Saw A is set higher than the blade on Table Saw B.
The blade on Table Saw A takes 0.02 s to complete one revolution.
The blade on Table Saw B takes 0.03 s to complete one revolution.
The axle for the blade on Table Saw A is 3 in. below the cutting surface.
The axle for the blade on Table Saw B is 5 in. below the cutting surface.
The radius of the circular cutting blade on Table Saw A is 5 in.
I sketched all the cycles the window showed.
To calculate the cycle, I calculated the x-interval between the first and second peak.
I looked for a trough on the graph and read the j-coordinate.
I looked for the place where the
t-coordinate was 10.
a)
b)
The employment cycle is 5.56 years, the distance between peaks or troughs.
c) The minimum number of applications per week is 170.
d)
There were 188 applications in May 2002. j(10) 51.88
6.921.3455.56
12
8
5 10
Time (years)
Jo
b
a
p
p
li
ca
ti
o
n
s/
w
e
e
k (
h
u
n
d
re
d
s)
15 4
0
t j(t)
In Summary
Key Idea
• The sine and cosine functions can be used as models to solve problems that involve many types of repetitive motions and trends.
Need to Know
• If a situation can be described by a sinusoidal function, the graph of the data should form a series of symmetrical waves that repeat at regular intervals. The amplitude of the sine or cosine function depends on the situation being modelled. • One cycle of motion corresponds to one period of the sine function.
• The distance of a circular path is calculated from the circumference of the path. The speed of an object following a circular path can be calculated by dividing the distance by the period, the time to complete one rotation.
EXAMPLE
3
Using technology to understand a situationThe function where tis time in years since
May 1992 and is the number of applications for jobs each week (in hundreds), models demand for employment in a particular city.
a) Using graphing technology in DEGREE mode and the WINDOW settings shown, graph the function and then sketch the graph.
b) How long is the employment cycle? Explain how you know. c) What is the minimum number of applications per week in this city? d) Calculate and explain what it represents in terms of the situation.
Karl’s Solution j(10),
j(t)
CHECK
Your Understanding
1. Olivia was swinging back and forth in front of a motion detector when the detector was activated. Her distance from the detector in terms of time can be modelled by the graph shown.
a) What is the equation of the axis, and what does it represent in this situation?
b) What is the amplitude of this function?
c) What is the period of this function, and what does it represent in this situation?
d) How close did Olivia get to the motion detector?
e) At s, would it be safe to run between Olivia and the motion detector? Explain your reasoning.
f ) If the motion detector was activated as soon as Olivia started to swing from at rest, how would the graph change? (You may draw a diagram or a sketch.) Would the resulting graph be sinusoidal? Why or why not?
2. Marianna collected some data on two paddle wheels on two different boats and constructed two graphs. Analyze the graphs, and explain how the wheels differ. Refer to the radius of each wheel, the height of the axle relative to the water, the time taken to complete one revolution, and the speed of each wheel.
3. Draw two sinusoidal functions that have the same period and axes but have different amplitudes.
0 2 1
⫺1
3 5 4 67
Time (s)
H
e
ig
h
t
o
f
p
ad
d
le
(
m
)
48 24
Paddle Wheeler A Paddle Wheeler B
x y
t57
0 4 8
Time (s)
Olivia’s Motion
D
is
ta
n
ce
(
m
)
12 16
14
2 6 10
PRACTISING
4. Evan’s teacher gave him a graph to help him understand the speed at which a tooth on a saw blade travels. The graph shows the height of one tooth on the circular blade relative to the cutting surface relative to time.
a) How high above the cutting surface is the blade set?
b) What is the period of the function, and what does it represent in this situation?
c) What is the amplitude of the function, and what does it represent in this situation?
d) How fast is a tooth on the circular cutting blade travelling in inches per second?
5. An oscilloscope hooked up to an alternating current (AC) circuit shows a sine curve on its display.
a) What is the period of the function? Include the units of measure. b) What is the equation of the axis of the function? Include the units
of measure.
c) What is the amplitude of the function? Include the units of measure.
6. Sketch a height-versus-time graph of the sinusoidal function that models each situation. Draw at least three cycles. Assume that the first point plotted on each graph is at the lowest possible height.
a) A Ferris wheel with a radius of 7 m, whose axle is 8 m above the ground, and that rotates once every 40 s
b) A water wheel with a radius of 3 m, whose centre is at water level, and that rotates once every 15 s
c) A bicycle tire with a radius of 40 cm and that rotates once every 2 s d) A girl lying on an air mattress in a wave pool that is 3 m deep, with
waves 0.5 m in height that occur at 7 s intervals
7. The tables show the varying length of daylight for Timmins, Ontario, located at a latitude of and Miami, Florida, located at a latitude of The length of the day is calculated as the interval between sunrise and sunset.
25°. 48°,
⫺1.5
1.5 4.5 3.0
0
⫺3.0 ⫺4.5
Time (s)
Oscilloscope Display
C
u
rr
e
n
t
(a
m
p
e
re
s)
0.04 0.08
x y
⫺6 ⫺8 ⫺10 ⫺2 ⫺4
0 2
Time (s)
Height of a Saw Tooth
H
e
ig
h
t
(i
n
.)
0.04 0.08 0.12
t h(t)
Day of Year 15 46 74 105 135 165 196 227 258 288 319 349
Hours of Daylight 8.8 10.2 11.9 13.7 15.2 16.1 15.7 14.4 12.6 10.9 9.2 8.3
Timmins, at latitude 488
Day of Year 15 46 74 105 135 165 196 227 258 288 319 349
Hours of Daylight 10.7 11.3 12.0 12.8 13.6 13.8 13.6 13.1 12.3 11.6 10.9 10.5
Miami, at latitude 258
a) Plot the data on separate coordinate systems, and draw a smooth curve through each set of points.
b) Compare the two curves. Refer to the periods, amplitudes, and equations of the axes.
c) What might you infer about the relationship between hours of daylight and the latitude at which you live?
8. The diameter of a car’s tire is 52 cm. While the car is being driven, the tire picks up a nail.
a) Draw a graph of the height of the nail above the ground in terms of the distance the car has travelled since the tire picked up the nail.
b) How high above the ground will the nail be after the car has travelled 0.1 km?
c) How far will the car have travelled when the nail reaches a height of 20 cm above the ground for the fifth time?
d) What assumption must you make concerning the driver’s habits for the function to give an accurate height?
9. In high winds, the top of a signpost vibrates back and forth. The distance the tip of the post vibrates to the left and right of its resting position can be
defined by the function where represents the
distance in centimetres at time tseconds. If the wind speed decreases by 20 km/h, the vibration of the tip can be modelled by the function
Using graphing technology in DEGREE mode and the WINDOW settings shown, produce the two graphs. How does the reduced wind speed affect the period, amplitude, and equation of the axis?
10. The height, , of a basket on a water wheel at time tcan be modelled by where tis in seconds and is in metres. a) Using graphing technology in DEGREE mode and the WINDOW
settings shown, graph and sketch the graph.
b) How long does it take for the wheel to make a complete revolution? Explain how you know.
c) What is the radius of the wheel? Explain how you know.
d) Where is the centre of the wheel located in terms of the water level? Explain how you know.
e) Calculate and explain what it represents in terms of the situation.
11. The equation models the displacement of a buoy in metres at tseconds.
a) Using graphing technology in DEGREE mode and the WINDOW settings shown, graph and sketch the graph.
b) How long does it take for the buoy to travel from the peak of a wave to the next peak? Explain how you know.
c) How many waves will cause the buoy to rise and fall in 1 min? Explain how you know.
d) How far does the buoy drop from its highest point to its lowest point? Explain how you know.
h(t)
h(t) 52.5sin(72t)° h(10),
h(t)
h(t)
h(t) 52sin(12t) 11.5°, h(t)
d(t) 52sin(1080t)°.
d(t)
d(t) 53sin(1080t)°, T
12. The average monthly temperature, in degrees Celsius in Kingston, Ontario, can be modelled by the function
where trepresents the number of months. For the month is January; for the month is February; and so on.
a) Using graphing technology in DEGREE mode and the WINDOW settings shown, graph and sketch the graph.
b) What does the period represent in this situation? c) What is the average temperature range in Kingston? d) What is the mean temperature in Kingston?
e) Calculate and explain what it represents in terms of the situation.
13. Two wrecking balls attached to different cranes swing back and forth. The distance the balls move to the left and the right of their resting positions in terms of time can be modelled by the graphs shown.
a) What is the period of each function, and what does it represent in this situation?
b) What is the equation of the axis of each function, and what does it represent in this situation?
c) What is the amplitude of each function, and what does it represent in this situation?
d) Determine the range of each function.
e) Compare the motions of the two wrecking balls.
14. How many pieces of information do you need to know to sketch a sinusoidal function. What pieces of information could they be?
Extending
15. A gear of radius 1 m turns counterclockwise and drives a larger gear of radius 4 m. Both gears have their axes along the horizontal.
a) In which direction is the larger gear turning?
b) If the period of the smaller gear is 2 s, what is the period of the larger gear? c) In a table, record convenient intervals for each gear, to show the vertical
displacement, d, of the point where the two gears first touched. Begin the table at 0 s and end it at 24 s. Graph vertical displacement versus time. d) What is the displacement of the point on the large wheel when the drive
wheel first has a displacement of m?
e) What is the displacement of the drive wheel when the large wheel first has a displacement of 2 m?
f ) What is the displacement of the point on the large wheel at 5 min? 20.5
4
2
0
⫺2
⫺4
Time (s)
Ball A
Ball B
D
is
ta
n
ce
(
m
)
8 16 24
t d(t)
T(30), T(t)
t52,
t51, 5.9,
T(t) 514.2sin(30(t24.2))° 1 T(t),
6
Mid-Chapter Review
FREQUENTLY ASKED
Questions
Q: What are sinusoidal functions, and what characteristics are often used to describe them?
A: Sinusoidal functions, like other periodic functions, repeat at regular
intervals. Unlike other periodic functions, sinusoidal functions form smooth symmetrical waves such that any portion of a wave can be horizontally translated onto another portion of the curve. Sinusoidal functions are formed from transformations of the functions and .
The three characteristics of a sinusoidal function, as well as any periodic function, are the period, the equation of the axis, and the amplitude.
y5cosx y5sinx
Period Equation of the Axis Amplitude
The period is the change in xcorresponding to one cycle. (A cycle of a sinusoidal function is a portion of the graph that repeats.) One way to determine the period is to look at the change in xbetween two maxima.
The equation of the axis is the equation of the line halfway between the maximum and minimum values on a sinusoidal function. It can be determined with the formula
y5 (maximum value 1 minimum value)
2
The amplitude is the vertical distance from the function’s axis to the minimum or maximum value. It is always positive.
EXAMPLE
y
⫺2
1 2
⫺1 90°
f(x) ⫽ sin x
180° 270° 360° 0
amplitude axis
period
x
For the function the period is the equation of the axis is and the amplitude is 1.
y50,
360°, f (x) 5sinx,
• See Lesson 6.2, Examples 1 and 2. • Try Mid-Chapter Review
Question 3.
A: Similarities The period is
The equation of the axis is
The amplitude
The range is
Differences A maximum for occurs at and at increments of from that point.
A maximum for occurs at and at increments of from that point.
A minimum for occurs at and at increments of from that point.
A minimum for occurs at and at increments of from that point.
The graph of the function can be changed to a graph of the function by applying a horizontal translation of to the left.
The graph of the function can be changed to a graph of the function by applying a horizontal translation of to the right.
Q: Why might it be useful to learn about sinusoidal functions?
A: Many real-world phenomena that have a regular repeating pattern can be modelled with sinusoidal functions. For example,
• the motion of objects in a circular orbit
• the motion of swinging objects, such as a pendulum • the number of hours of sunlight for a particular latitude • the phase of the Moon
• the current for an AC circuit
90°
y5sinx
y5cosx
90°
y5cosx
y5sinx 360°
180°
y5cosx 360°
270°
y5sinx 360°
0°
y5cosx 360°
90°
y5sinx
5y [R|21#y#16. 51.
y50. 360°.
x y
y = sin x
y = cos x
180° 360°
1 2
⫺2 ⫺1
0
• See Lesson 6.3, Examples 1, 2, and 3.
• Try Mid-Chapter Review Questions 5 and 6.