Salters-Nuffield Advanced Biology Resources
Activity 3.1 Student SheetCELL STRUCTURE AND FUNCTION
Purpose
To describe the ultrastructure of a typical eukaryotic animal cell.
To recognise organelles from electron micrograph images.
To make measurements from electron micrograph images.
3D cell structure
In this activity you will look at the 3D structure of cells and at how structures in cells are related to their functions. Use the Student Book and the interactive cell to help you complete this activity.
Questions
Q1 For each of the 2D shapes in Figure 1 below, decide which of the 3D shapes could be sectioned (cut through) to produce that 2D shape. Write the letters of the appropriate 3D shapes beside the 2D shapes. You may find you have more than one letter for some of the shapes.
Figure 1 2D and 3D shapes.
Q2 Look at the three electron micrographs of mitochondria in the interactive cell. Describe and explain any differences that you observe between these three micrographs.
Q3 Here are five features associated with membranes in cells: (1) contains pores
(2) selective permeability (3) may be stacked or folded (4) fluid
(5) may surround organelles.
a Write the appropriate number (1–5) beside each characteristic below to show which of the characteristics are associated with the features above.
Provides large surface area for attachment of enzymes Determines which molecules enter or leave the cell Allows passage of large molecules through the membrane Can fuse with itself
Salters-Nuffield Advanced Biology Resources
Activity 3.1 Student Sheetb Which of the features 1–5 above are associated with the following functions of cell membranes?
The balance of ions inside and outside a cell can be controlled Membrane can pinch off sections and reseal itself
Enzymes can be isolated for specific chemical reactions at a particular location in the cell
mRNA can pass out of the nucleus
Large molecules can be directed and transported quickly about the cell Components of ribosomes can pass to the cytoplasm from the
nucleolus
c Which of the features 1–5 above are important for the following components and activities of cells? (More than one feature may be important for each.)
Nucleus Mitochondria Chloroplasts Vesicle formation
Exocytosis and endocytosis Endoplasmic reticulum Cell surface membrane
Look at the microscope images of organelles in the interactive cell before trying to identify the organelles in the electron micrograph photographs shown in Figures 2, 3 and 4.
Q4 Identify the organelles A to E in the frog white blood cell (Figure 2).
Figure 2 Electron micrograph of a frog white blood cell. Magnification ×12 300.
A
B
C
D
Salters-Nuffield Advanced Biology Resources
Activity 3.1 Student SheetQ5 Figure 3 shows a bat pancreas cell. Identify the organelles A to C. A colour version of this figure is available in the mediabank on SNAB Online.
Figure 3 Electron micrograph of bat pancreas cell. Magnification ×12 300.
Q6 Identify the organelles labelled A to C. A colour version of this figure is available in the mediabank on SNAB Online.
Figure 4 Electron micrograph of part of a cell.
A
C
B
B
Salters-Nuffield Advanced Biology Resources
Activity 3.1 Student SheetCalculating the size of electron micrograph images
To calculate the size of an electron micrograph image, you need to: measure the length of the image in mm
convert this length to µm (×1000)
calculate the actual size of the image by dividing the length of image in µm by the magnification. To calculate the magnification of an electron micrograph image using a scale bar, you need to:
measure the length of the scale bar in mm
convert the length into µm
Work out the magnification by dividing the measured length of the scale bar by the number written on the scale bar.
Q7 Calculate:
a the width of the nucleus in Figure 2 (horizontally across the centre)
b the mean width of the mitochondria in Figure 2.
Q8 Calculate the length of the mitochondrion shown in Figure 3.
Q9 a Work out the magnification of Figure 4.
Salters-Nuffield Advanced Biology Resources
Activity 3.1 Teacher SheetCELL STRUCTURE AND FUNCTION
Purpose
To describe the ultrastructure of a typical eukaryotic animal cell. To recognise organelles from electron micrograph images. To make measurements from electron micrograph images.
Notes on the activity
In this activity students will look at the 3D structure of cells and at how structures in cells are related to their functions. This activity could be carried out using the interactive cell on SNAB Online. The activity is suitable for group work. The activity provides a maths opportunity in working out the size of organelles on electron microscope images.
Answers
Q1
Q2 The first picture is a scanning electron micrograph, showing detail of the surface and 3D shape of a mitochondrion.
The second is a longitudinal section so the shape is elongated and the edges of the folded membranes are visible.
Salters-Nuffield Advanced Biology Resources
Activity 3.1 Teacher SheetQ3 a
Provides large surface area for attachment of enzymes 3 Determines which molecules enter or leave the cell 2 Allows passage of large molecules through the membrane 1
Can fuse with itself 4
Can change shape and fold 4
Forms an extensive channel system 3 Forms a separate compartment within a cell 5 b
The balance of ions inside and outside a cell can be controlled 2 Membrane can pinch off sections and reseal itself 4 Enzymes can be isolated for specific chemical reactions at a particular location in the cell
5
mRNA can pass out of the nucleus 1 Large molecules can be directed and transported quickly about the cell 3 Components of ribosomes can pass to the cytoplasm from the nucleolus 1 c
Nucleus 1, 5, (2)
Mitochondria 3, 5, (2), (4)
Chloroplasts 3, 5, (2), (4)
Vesicle formation 4
Exocytosis and endocytosis 4
Endoplasmic reticulum 3
Plasma membrane 2, 4
Q4
A Ribosomes/endoplasmic reticulum (ER)/rough ER/granular cytoplasm (quite hard to distinguish)
B Mitochondrion C Golgi apparatus
D Nuclear membrane/nuclear envelope/nucleus E Nucleus/chromatin
Q5
A Ribosomes/rough endoplasmic reticulum B Mitochondrion
C Secretory vesicle
Q6
A Golgi apparatus B Secretory vesicle
C Ribosomes/granular cytoplasm
Q7 a Width of nucleus: 55 mm; 55 000 µm; 55 000/12 300 = 4.5 µm.
b For the six mitochondria that can clearly be identified, average width when measured horizontally across image: 9.7 mm; 9700 µm; 9700/12 300 = 0.8 µm.
Q8 82 mm; 82 000 µm; 82 000/12 300 = 6.6 µm.
Salters-Nuffield Advanced Biology Resources
Activity 3.2 Student SheetPROTEIN TRANSPORT WITHIN CELLS
Purpose
To explain the role of the rough endoplasmic reticulum (RER) and the Golgi apparatus in moving proteins around cells.
Moving proteins through the cell
In Topic 2 we saw how mRNA made it possible to transfer the DNA code from the nucleus to the cytoplasm where the instructions are used to make polypeptides. In this activity you find out what happens after a protein is made. You will see how the endoplasmic reticulum and Golgi apparatus are involved in processing and moving proteins through the cell to where they are needed.
Procedure
Use the interactive tutorial or read the Student Book (pages 109–110) before completing the tasks that follow.
1 The flowchart shows the sequence of events that occur when a digestive enzyme is made,
processed and released from a cell. Answer the questions in the flowchart to complete the details of the sequence.
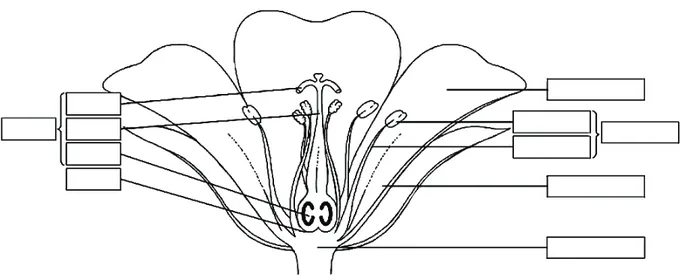
2 Indicate where each event in the sequence occurs by adding arrows and the letters used in the flowchart to the diagram below.
Salters-Nuffield Advanced Biology Resources
Activity 3.2 Teacher SheetPROTEIN TRANSPORT WITHIN CELLS
Purpose
To explain the role of the rough endoplasmic reticulum (RER) and the Golgi apparatus in moving protein around cells.
Notes on the procedure
Students use the interactive tutorial or the Student Book (pages 109–110) to complete the flowchart, and add arrows and annotations to the diagram to show the route of a protein through the cell. In this case a digestive enzyme is made, processed and released from the cell.
Answers
C Translation of the mRNA to form a protein.
E It is processed. It assumes its 3D shape.
F A vesicle containing the protein is pinched off the ER sac.
H The vesicle fuses with the Golgi apparatus on the receiving face.
I Proteins are modified within the Golgi apparatus.
K The secretory vesicles that have pinched off the Golgi apparatus fuse with the cell surface membrane and release their contents.
Salters-Nuffield Advanced Biology Resources
Activity 3.3 Student SheetGAMETES AND FERTILISATION
Purpose
To explain how mammalian gametes are specialised for their functions.
To describe the acrosome and cortical reactions.
Use the Student Book and the interactive tutorial that accompanies this activity to complete this worksheet.
Questions
Q1 Label and annotate in detail both the structures and the events in Figure 1 below that show the acrosome and cortical reactions.
Figure 1 The acrosome reaction and fertilisation.
Q2 Put scale bars onto Figure 1 for the egg and the sperm.
Q3 The egg and sperm are not drawn to scale, by what factor is the sperm drawn out of scale?
Q4 In a woman, where does fertilisation normally take place?
Q5 Suggest reasons for the different sizes of egg and sperm cells.
Q6 What is the function of the middle section of a sperm?
Q7 In humans the sperm have to travel from the top of the vagina, where they are deposited during intercourse, to the top of the fallopian tube – a distance of about 15 cm. If the journey takes 2 hours, what is the average speed of the sperm’s journey in cm per hour and metres per second?
Salters-Nuffield Advanced Biology Resources
Activity 3.3 Teacher SheetGAMETES AND FERTILISATION
Purpose
To explain how mammalian gametes are specialised for their functions.
To describe the acrosome and cortical reactions.
Answers
Q1 and 2
Q3 The sperm are too big compared with the egg in this diagram by a factor of approximately 10. Bright students may realise that the nucleus of the sperm and egg are the same size. The egg nucleus should actually be 10 times smaller in this diagram, but has been made larger for labelling purposes.
Q4 In the fallopian tube.
Q5 The egg is large as it contains a food store for the developing embryo. The sperm are small in order to increase the efficiency of their locomotion.
Q6 Contains mitochondria to provide energy for locomotion.
Q7 7.5 cm per hour; 2.1 10–5 m s–1
Q8 They both contain hydrolytic enzymes, which digest parts of a cell. A lysosome digests parts of a cell during cell apoptosis (cell death) or in the normal recycling of cell organelles, whereas the acrosome enzymes only digest the passage into an egg cell. Lysosomes are distributed throughout the cell, whereas the acrosome is at the front of the sperm head only.
Salters-Nuffield Advanced Biology Resources
Activity 3.4 Student SheetFERTILISATION IN A MARINE WORM
Purpose
To observe sperm, eggs and fertilisation.
YOU NEED
● Microscope
● Blunt seeker
● 6 Petri dishes
● 2 cavity slides
● Coverslips
● Fine pipette
● Sea water at 10 °C
● Live Pomatoceros on stones
SAFETY
Do not use a daylight illuminated microscope where direct sunlight may strike the mirror as this could damage your eyes.
Cover any cuts in your skin with waterproof plasters. Wash your hands thoroughly after handling Pomatoceros and associated equipment.
Where to look
Pomatoceros is a marine worm found on rocky shores around the UK coast. The worm lives within a
curved, white case, which is triangular in cross-section. This distinctive casing is attached to rocks – see Figure 1.
You can watch the video clip that accompanies this activity on SNAB Online or undertake the experiment yourself to complete the tasks within the procedure.
Figure 1 The worm’s triangular case is attached to rocks.
Salters-Nuffield Advanced Biology Resources
Activity 3.4 Student SheetProcedure
Observing the production of gametes
1 Find a pebble or piece of rock with one or more Pomatoceros worms attached. Using a pair of forceps, break off the posterior (narrow) end of the tube of one of the worms, taking care not to damage the animal.
2 Insert a blunt seeker into the anterior (front) end of the tube and gently push the worm out of the broken end of its tube into a Petri dish of sea water at approximately 10 °C.
3 Identify whether the worm is male or female. Adult males are yellow at their rear ends, adult females almost violet.
4 Repeat steps 1–3, using separate Petri dishes of sea water, until you have one adult male and one adult female. Put to one side any worms of uncertain sex.
5 Observe the dishes at frequent intervals. Gametes will probably be shed very quickly and almost certainly within 40 minutes.
6 Remove a few eggs with a pipette and examine them on a cavity slide with a coverslip under low power and high power.
7 Estimate approximately how many eggs were released by the female.
8 Make an annotated sketch of a single egg, showing the position of the pigmented area and the nucleus.
9 Remove some sperm with a pipette and examine them on a cavity slide with a coverslip under high power and low power. Do the sperm stick together? How do they move?
10 Estimate approximately how many sperm were released by the male.
11 Make a sketch of a single sperm as best you can.
Observing fertilisation
Fertilisation usually occurs rapidly, so you will need to have everything ready in position before adding the sperm in step 2 below.
1 By means of a fine pipette put some sea water containing one or two unfertilised eggs on a cavity slide.
2 Add some water containing sperm. Put on a coverslip and examine under high power and low power.
3 Make annotated sketches at intervals after fertilisation. Note particularly the behaviour of the pigmented region of the egg and any changes that can be seen in the nuclei.
4 Compare fertilised eggs with others shed at the same time that remain unfertilised. Interpret your findings as far as you are able.
This procedure is modified from Roberts, M.B.V. and King, T.J. (1987) Biology: A Functional
Salters-Nuffield Advanced Biology Resources
Activity 3.4 Teacher SheetFERTILISATION IN A MARINE WORM
Purpose
To observe sperm, eggs and fertilisation. SAFETY
Students should be reminded about the hazard of using daylight illuminated microscopes where direct sunlight may strike the mirror. Demonstrate how to insert the slide correctly onto the stage. Ramming the slide may produce glass shards.
Ensure any cuts to the skin are covered with waterproof plasters. Students should wash their hands thoroughly after the activity.
Notes on the procedure
Pomatoceros is a marine worm found on rocky shores around the UK’s coast. It is easy to identify
with a distinctive curved, white case, which is triangular in cross-section.
A video clip of fertilisation accompanies the activity. Students can use either the video on SNAB Online or the experiment to observe fertilisation.
Students may be upset by the death of the worms. It is very hard to avoid killing some worms during the experiment and most die afterwards. Therefore completion of the experiment raises an ethical issue with regard to not causing suffering to experimental animals. Centres may choose to instead use this as an ethical discussion opportunity, using the video as an acceptable alternative.
Centres that are not located at the coast can obtain the worms from Blades Biological Supplies. Students should appreciate the importance of neither causing suffering to experimental animals nor of damaging biodiversity or the environment (for example, through over-collecting).
The procedure is modified from Roberts, M.B.V. and King, T.J. (1987) Biology: A Functional
Salters-Nuffield Advanced Biology Resources
Activity 3.4 Technician SheetFERTILISATION IN A MARINE WORM
Purpose
To observe sperm, eggs and fertilisation.
SAFETY
Wear eye protection when preparing Pomatoceros for the activity. Ensure any cuts to the skin are covered with waterproof plasters. Wash hands thoroughly afterwards.
Ensure microscopes are not placed where direct sunlight may strike the mirror.
Requirements per student or
group of students Notes
Live Pomatoceros on stones Centres that are not located on the coast can purchase Pomatoceros on stones from Blades Biological Suppliers.
Sea water at 10 °C Sea water salt can be purchased from marine aquarium shops. Ice To pack around the sea water container. Do not put in the sea water. Microscope Sea water is extraordinarily corrosive. Check and clean all
microscopes before storing. 6 Petri dishes
2 cavity slides
Coverslips
2 fine pipettes Use separate pipettes for eggs and sperm. Blunt seeker
Salters-Nuffield Advanced Biology Resources
Activity 3.5 Student SheetCHROMOSOME ASSORTMENT
Purpose
To model how chromosomes behave during meiosis.
To explain how meiosis introduces variation through independent assortment and crossing over.
YOU NEED
● A length of string (approximately 60 cm long)
● 12 ‘chromosome’ strands (cards, straws, pipe cleaners or string) – four of each size, small, medium and large. Your teacher/lecturer will give you ‘chromosomes’ of the right colour – depending on whether you start with a cell from an ovary or from a testis.
● 6 paperclips
Procedure
1 Make an ovary or testis cell by laying out the string to represent the cell surface membrane. (Half the group should be making ovary cells while the other half are making testis cells. All the cells come from two individuals – one male and one female.)
2 Place two ‘chromosome’ strands of each of the three sizes randomly inside the cell.
3 Replicate all chromosomes in the cell by placing an additional strand alongside each. Link the two strands with a paperclip to represent two chromatids joined at the centromere.
4 Pair up chromosomes of the same size so they lie next to each other across the centre of the cell (called the equator).
5 Separate each pair of chromosomes with one chromosome going to opposite ends of the cell, making a cluster of chromosomes at each end. Think of a way to ensure that which of the pair goes to each end is completely random, for example, by one person putting the pair behind their back, one in each hand, and another person selecting one hand at random.
6 Draw the string together across the centre of the cell so that two cells are formed.
7 In each of the two new cells line the chromosomes up across the centre of the cell at right angles to the line of the previous cell division.
8 Remove the paperclips and separate the two strands making up each chromosome. Move the strands to opposite ends of the new cells.
9 Pinch the cells to create four cells in total.
10 Now each person randomly selects one of these four egg or sperm cells. Then randomly find another person who has the opposite type of cell – sperm or egg – needed for fertilisation.
11 Together make a fertilised egg and place in one central ‘maternity unit’ (the front bench or equivalent). The group should view all cells created and answer the following questions.
Questions
Q1 How many different combinations of chromosomes are possible in the fertilised egg cells you have produced?
Q2 Do any of the fertilised egg cells contain the same combination of chromosomes?
Q3 Is it likely that two of the fertilised egg cells that your class produced have the same combination of chromosomes?
Q4 What would be the chances of two fertilised egg cells having the same combination if there were:
a four chromosomes in the cell
b 23 chromosomes in the cell?
Q5 Suggest how you would modify this model to illustrate the effect of crossing over.
Salters-Nuffield Advanced Biology Resources
Activity 3.5 Teacher SheetCHROMOSOME ASSORTMENT
Purpose
To model how chromosomes behave during meiosis.
To explain how meiosis introduces variation through independent assortment and crossing over.
Prior knowledge
Students need to be aware of the process of meiosis as a reduction division that introduces variation by random independent assortment and crossing over. This activity aims to show these features of
meiosis. Students do not need to learn all the stages of meiosis.
Notes on the procedure
The students are split into two groups; one will make ovary cells and the other testis cells. Within each group the students work in pairs. The string is laid out in a circle on the bench to represent the cell membrane and the correct coloured chromosomes for an ovary or testis cell are placed within. It would be worth highlighting to the students that all cells they construct come from two individuals, one male and one female.
The chromosomes can be made from any suitable material such as card, modelling clay, pipe cleaners or straws. There are master sheets within the Technician Sheets that can be copied onto card.
The chromosomes are shown with different patterns, these could be copied onto pink card for the female chromosomes and blue card for the male chromosomes. This would allow the origin of the chromosomes, from mother or father, to be identified in the final fertilised egg.
Oral instructions could be given rather than using the worksheet, with the class working through the activity together. Students could produce stop-go animations to record the process.
1 Make an ovary or testis cell by laying out the string to represent the cell membrane.
2 Place two ‘chromosome’ strands of each of the three sizes randomly into the cell. Each pair of students uses either the chromosomes in a male or the chromosomes in a female.
Male Female
Salters-Nuffield Advanced Biology Resources
Activity 3.5 Teacher Sheet3 Replicate all chromosomes in the cell by placing an additional strand alongside each. Link the two strands with a paperclip to represent the centromere.
4 Pair up chromosomes of the same size so they lie next to each other across the centre of the cell (called the equator).
5 Separate each pair of chromosomes with one chromosome going to each end of the cell, making a cluster of chromosomes at opposite ends. Think of a way to ensure that which of the pair goes to each end is completely random, for example, by one person putting the pair behind their back, one in each hand, and another person selecting one hand at random.
6 Draw the string together across the centre of the cell so that two cells are formed.
7 In each of the two cells line the chromosomes up across the centre of the cell at right angles to the line of the previous cell division.
Female
Female
Salters-Nuffield Advanced Biology Resources
Activity 3.5 Teacher Sheet8 Remove the paperclips and separate the two strands making up each chromosome. Move the strands to opposite ends of the new cells.
9 Pinch the cells to create four cells in total.
10 Now each person randomly selects one of these four egg or sperm cells. Then randomly find another person who has the opposite type of cell, sperm or egg, needed for fertilisation.
Salters-Nuffield Advanced Biology Resources
Activity 3.5 Teacher SheetAnswers
Q1 64.
Q2 Probably not because there are 64 possible combinations and our class has produced (insert number of cells produced by the class) fertilised egg cells.
Q3 This will depend on the size of the class in relation to the number of different combinations of chromosomes (i.e. 64).
Q4 a 1 in 28 = 1 in 256. b 1 in 246.
Q5 Insert a step between stages 4 and 5 where you cut off a short length from two chromosomes of the same size and swap them. Stick the switched bits back with sticky tape:
Salters-Nuffield Advanced Biology Resources
Activity 3.5 Technician SheetCHROMOSOME ASSORTMENT
Purpose
To model how chromosomes behave during meiosis.
To explain how meiosis introduces variation through independent assortment and crossing over.
Requirements per student or group of students
Notes
A length of string (approximately 60 cm long)
Ensure string will lie flat on a table. Heavy cotton twine is best.
One set of 12 chromosome strands (a male or female set)
These can be made of any suitable material, for example, pipe cleaners, straws, modelling clay, string or popper beads. There needs to be three different sizes and four different patterns, see below.
The master sheet on pages 2 and 3 can be used to photocopy patterns onto card – pink for females and blue for males. 6 paperclips
Notes
Salters-Nuffield Advanced Biology Resources
Activity 3.5 Technician SheetFemale
Female
Female
Female
Female
Female
Salters-Nuffield Advanced Biology Resources
Activity 3.5 Technician SheetMale Male
Male Male
Male Male
Salters-Nuffield Advanced Biology Resources
Activity 3.6 Student SheetFRUIT FLIES, LINKAGE AND CROSSING OVER
Purpose
To explain linkage of genes.
To explain how crossing over introduces variation.
Fruit flies reveal linkage of genes
Work through the questions below to discover for yourself the evidence about gene location revealed by fruit fly mating experiments. As you go along you can perform some of the experiments for yourself using the virtual fruit flies labs available via the weblinks, or work though the animation available on the DNA from the Beginning website (concept 10 and 11 in classical genetics), which describes this research.
Fruit fly mating experiments
Thomas Morgan and his colleagues at Colombia University studying the inheritance of characteristics in fruit flies found a male fly with an unusual white-eye mutation. They mated this white-eyed male with a wild-type red-eyed female (homozygous for the characteristic).
Q1 The observed outcome was that all the offspring had red eyes. What would you conclude from this finding?
………
………
………
Q2 The researchers went on to mate two of the first generation (F1) red-eyed offspring together. Predict the outcome of this cross.
………
………
Q3 The red eyes did appear in the 3:1 ratio that would be expected if parents are heterozygous and red eyes was a dominant allele. However, they found that only white eyed males were
produced, no white-eyed females were ever produced. What would you conclude from these observations?
………
Salters-Nuffield Advanced Biology Resources
Activity 3.6 Student SheetQ4 Morgan and his colleagues concluded that the gene for eye colour must occur on the X chromosome, now known as sex-linked. They drew out a Punnett square to show how a cross between two F1 red-eyed flies results in only white-eyed males if the gene is sex-linked. Complete the Punnett square below as they would have done to show the inheritance of the sex-linked gene. They used XR to represent the dominant X-linked red-eyes allele, Xw to represent the recessive X-linked white-eyes allele and Y, which does not have a locus for the eye-colour gene.
Parent flies F1 Male F1 Female
Parent phenotypes red-eyed red-eyed
Parent genotype ………… …………
(remember sex-linked) Offspring genotypes
Female gametes from red-eyed offspring
……… ………
Q5 The researchers went on to cross the white-eyed males and red-eyed females from this second generation to check their idea that the gene is sex-linked.
Work out what the outcome of this cross will be, both in terms of the fly genotypes and phenotypes produced. Draw out Punnett squares for yourself.
Q6 Explain whether this evidence supports or refutes the idea that the gene for eye-colour is sex-linked.
………
……… Male gametes
from red-eyed offspring
……
……
Offspring phenotypes
………
Salters-Nuffield Advanced Biology Resources
Activity 3.6 Student SheetLinkage groups
Morgan and his colleagues also noticed that certain combinations of characteristics occurred together and suggested that the genes for these features were linked. They found that there were four groups of characteristics, which matched the number of chromosomes found in fruit flies, suggesting that the linked characteristics occur on separate chromosomes. These are now known as linkage groups.
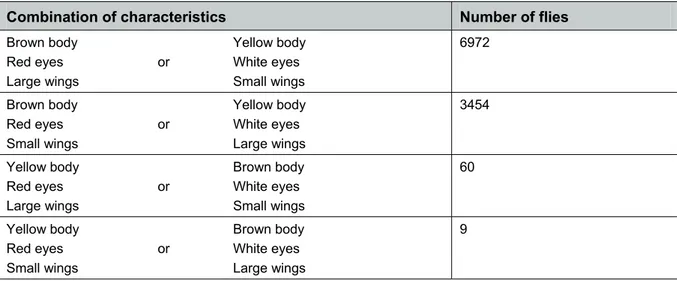
They bred female flies that were heterozygous for body colour, eye colour and wing size: all three genes are located on the X chromosome, that is they are X-linked. The recessive alleles produce yellow bodies, white eyes and small wings; the dominant alleles produce brown bodies, red eyes and large wings. The flies were mated with a male recessive for all these characteristics on their X chromosome.
Q7 If the genes are part of a linkage group what would be the outcome of the cross described above?
………
………
………
………
The researchers examined 10 495 offspring, the results are shown in Table 1.
Combination of characteristics Number of flies
Brown body
Red eyes or Large wings Yellow body White eyes Small wings 6972 Brown body
Red eyes or Small wings Yellow body White eyes Large wings 3454 Yellow body
Red eyes or Large wings Brown body White eyes Small wings 60 Yellow body
Red eyes or Small wings
Brown body White eyes Large wings
9
Table 1 The number of flies with each combination of features, 6972 of the flies having either all the dominant characteristics or all the recessive characteristics.
Q8 What can be concluded from the presence of the offspring with combinations of dominant and recessive phenotypes?
Try to explain what the frequency of the different combinations tells you about the location of genes on the chromosome.
………
………
Salters-Nuffield Advanced Biology Resources
Activity 3.6 Teacher SheetFRUIT FLIES, LINKAGE AND CROSSING OVER
Purpose
To explain linkage of genes.
To explain how crossing over introduces variation.
Fruit flies reveal linkage of genes
The questions on the sheet guide students to think about sex-linked genes, linkage groups and the introduction of variation when crossing over separates linked genes. The DNA from the Beginning website (concept 10 and 11 in classical genetics) includes animations that describe this research. Mating experiments can be performed using virtual fruit flies labs available via the weblinks. The sheet frequently asks a question to encourage students to think through ideas and it goes on to give the answer. The sheet is designed to develop understanding rather than assessing knowledge and understanding.
Answers
Fruit fly mating experiments
Q1 The white-eye mutation is recessive, the male fly must be homozygous for this allele, the female is homozygous for red eyes so all offspring are heterozygous, red-eyed.
Q2 3:1 red-eyed to white-eyed offspring, if assumptions in Q1 are correct.
Q3 Students may suggest that they just did not do enough experiments and no females were produced by chance, or suggest sex-linked. Even with thousands of crosses the result does not change, suggesting that the gene is in some way associated with the sex chromosomes, sex-linked.
Q4
Parent flies F1 Male F1 Female
Parent phenotypes red-eyed red-eyed
Parent genotype XRY XRXw
(remember sex linked) Offspring genotypes
Female gametes from red-eyed offspring
XR Xw
XRXR XRXw
XRY XwY
Male gametes from red-eyed offspring
XR
Y
Salters-Nuffield Advanced Biology Resources
Activity 3.6 Teacher SheetOffspring phenotypes: One red-eyed female One red-eyed male One white-eyed female One white-eyed male
Q5
Parent flies Male Female
Parent phenotypes white-eyed red-eyed
Parent genotype XwY XRXw or XRXR
Female gametes from heterozygous red-eyed offspring
XR Xw
XRXw XwXw
XRY XwY
Female gametes from homozygous red-eyed offspring
XR XR
XRXw XRXw
XRY XRY
Q6 White-eyed female offspring are only produced if the male is white-eyed and the female also carries the allele for white eyes. If it was not sex-linked white-eyed offspring could be produced by two individuals heterozygous for the characteristic as both would carry the red and white eye alleles. This evidence supports the idea that the gene is sex-linked.
Linkage groups
Q7 If the genes are part of a linkage group that is always inherited together, 50% of the offspring would show all the dominant characteristics and 50% would show all the recessive
characteristics.
Female gametes heterozygous
XBRL Xyws
XBRL Xyws Xyws Xyws
XBRL Y Xyws Y
Q8 They are not always passed on together as a unit; alleles swap between the homologous chromosomes at crossing over during meiosis and result in the different combinations. The more frequently the combinations occur, the further apart the genes are located on the chromosome, so crossing over is more likely to occur. Note that the nine flies occur due to a double crossing over, with chiasmata forming between body colour and eye colour, and between eye colour and wing size. This is rare, which is why the number of this phenotype is so low.
Male gametes from white-eyed offspring
Xw
Y
Male gametes from white-eyed
offspring
Xw
Y
Offspring phenotypes: Two red-eyed females Two red-eyed males No white-eyed offspring
Male gametes recessive
Xyws
Salters-Nuffield Advanced Biology Resources
Activity 3.7 Student SheetMITOSIS FLICK BOOK
Purpose
To understand that mitosis is a continuous process followed by cytoplasmic division. To understand how it can be separated into a series of distinct stages.
Procedure
You will be provided with a set of chromosome cards that make up a flick book showing the chromosomes moving around the cell. The cell contains only four chromosomes. Ensure your cards are fully shuffled before you start.
1 Place the cards in the correct order so that when the pack is ‘flicked’ the moving picture created shows the chromosomes going through the process of mitosis and cytoplasmic division to form two new cells, each containing the same number of chromosomes as the original parent cell. The cards can be held together with a large bulldog clip to make ‘flicking’ easier.
2 Flick the cards several times and then identify five stages in the sequence. Divide the cards into these five groups that represent the four stages of mitosis plus cytoplasmic division.
3 Draw an annotated cell or write a short description of what appears to happen in each of the stages.
4 Use the Student Book (section 3.2 ‘From one to many: the cell cycle’) and the interactive tutorial for Activity 3.8 to check if your stages are the same as the ones traditionally identified by
Salters-Nuffield Advanced Biology Resources
Activity 3.7 Teacher SheetMITOSIS FLICK BOOK
Purpose
To understand that mitosis is a continuous process followed by cytoplasmic division.
To understand how it can be separated into a series of distinct stages.
Notes on the procedure
Students are provided with a set of chromosome cards. The cards come on master sheets that should be cut up in advance (see Technician Sheet). They show a cell that contains four chromosomes. The students follow the instructions on the Student Sheet; these could be given orally. The cards are not numbered so the students have to think about what is happening within the cell to put the cards in a valid order. Make sure students shuffle the cards before they begin.
The cards can be held together with a large bulldog clip to make ‘flicking’ easier.
When flicked, the chromosomes move through the cell undergoing mitosis and cytoplasmic division. The students then split the cards into five groups, which may correspond to prophase, anaphase, metaphase, telophase and cytoplasmic division. Note that the cards show an animal cell dividing. Students can complete the flick book successfully without any teaching about mitosis beyond what they have learnt at GCSE and telling them that the cards, when correctly ordered, will make a flick book showing what happens when a single cell undergoes nuclear division by mitosis and then splits to form two new cells. Used as an introduction, the activity encourages students to see mitosis and cytoplasmic division as a continuous process with phases identified and described by biologists. The instruction on the Student Sheet is to make drawings and notes before checking that the
stages are correct. Teachers may want to advise the students to check the stages with the Student Book (pages 122–123) before spending time making notes that could be partly erroneous. Alternatively, the group could discuss where they decided to divide the cards as a method of checking that they have the traditional stages before making the notes.
Salters-Nuffield Advanced Biology Resources
Activity 3.7 Technician SheetMITOSIS FLICK BOOK
Purpose
To understand that mitosis is a continuous process followed by cytoplasmic division.
To understand how it can be separated into a series of distinct stages.
Requirements per student or
group of students Notes
One set of chromosome cards Master sheets are best photocopied onto card. If making a class set, use different coloured card for each pack, to make sorting out stray cards easier.
Scissors (if cards not yet cut up) One bulldog clip
Mitosis flick book
Mitosis flick book
Mitosis flick book
Salters-Nuffield Advanced Biology Resources
Activity 3.7 Technician SheetMitosis flick book
Mitosis flick book
Mitosis flick book
Mitosis flick book
Salters-Nuffield Advanced Biology Resources
Activity 3.7 Technician SheetMitosis flick book
Mitosis flick book
Mitosis flick book
Mitosis flick book
Salters-Nuffield Advanced Biology Resources
Activity 3.7 Technician SheetMitosis flick book
Mitosis flick book
Mitosis flick book
Salters-Nuffield Advanced Biology Resources
Activity 3.8 Student SheetTHE CELL CYCLE
Purpose
To understand the role of DNA replication and mitosis in the cell cycle.
Procedure
Watch the cell cycle interactive tutorial that accompanies this activity or read the Student Book (section 3.2 ‘From one to many: the cell cycle’) before attempting the following tasks.
1 Draw on the graph a plot of the quantity of DNA in a cell during the cell cycle. Assume that a cell contains two arbitrary units of DNA just after cell division.
Salters-Nuffield Advanced Biology Resources
Activity 3.8 Teacher SheetTHE CELL CYCLE
Purpose
To understand the role of DNA replication and mitosis in the cell cycle.
Notes on the activity
Students watch the interactive tutorial that accompanies this activity or read the section in the Student Book (section 3.2 ‘From one to many: the cell cycle’) prior to completing the Student Sheet.
Salters-Nuffield Advanced Biology Resources
Activity 3.9 Student Sheet Core PracticalOBSERVING MITOSIS
Purpose
To prepare some slides of actively dividing plant tissue.
To observe the stages of the cell cycle in living tissue.
To determine the duration of the stages of mitosis in relation to the whole cell cycle.
To develop practical skills.
Preparing the cells
To see mitosis in action you need to look at living cells. Garlic bulbs grow roots that have actively dividing cells in their tips. Each cell has only eight chromosomes so it is relatively easy to see the chromosomes once they have condensed.
In order to see the chromosomes inside the cells, the cells must be separated and spread out into a layer that is ideally just one cell thick. Plant cells are glued together by a middle lamella of pectins. Hydrochloric acid will break down these pectins allowing the cells to be separated. Follow the procedure in Methods 1 or 2 to stain chromosomes. Your teacher will guide you on which method to use. Before you start, read the method carefully and consider any safety issues and how you will minimise any risks.
Interpreting what you see on your cell preparation
Examine your preparation carefully for cells undergoing different stages of mitosis. Identify the different stages by comparison with labelled pictures or photographs of cells during mitosis. Bear in mind that mitosis is a dynamic process so cells may have been fixed in transition from one stage to the next – you will have to interpret what you see. Follow the steps below to help you record and interpret your results.
1 Identify cells in the following stages of mitosis: interphase, prophase, metaphase, anaphase and telophase. Draw one cell to illustrate each stage. Your drawings will be simple outlines of the cells and the groups of chromosomes in them as few other structures will be visible. Aim to show the relative sizes and positions of the chromosomes in the cell accurately. Annotate to describe what is happening. See Practical Skills Support Sheet 8 – using a microscope – for guidance on biological drawing.
2 Count the number of cells in the area visible under the microscope when viewed at ×400 (the field of view). Count the number of cells in each stage of mitosis. Record your results in an appropriate table.
3 Calculate the percentage of the cells in each stage of mitosis. Rank these values from highest to lowest. Given that your preparation freezes the process of mitosis at one point of time, what do these values suggest to you about the length of time a cell spends in each stage of mitosis? Explain how you arrive at your conclusion.
4 If a group of cells is dividing rapidly, a high proportion of the cells will be undergoing mitosis. A group of cells that is not dividing will have all cells in interphase of the cell cycle. The amount of cell division occurring in a tissue can be quantified using the mitotic index. Using the formula below, calculate the mitotic index for your root tip. If you have time, compare this value with the mitotic index of an area of cells away from the tip and comment on your findings.
Mitotic index =
view of field in the cells of number total s chromosome visible containing cells of number
The mitotic index is useful in studies of cell division in many different types of tissues, for example in examining tumour growth in cancer patients.
Salters-Nuffield Advanced Biology Resources
Activity 3.9 Student Sheet Core PracticalEvaluation
After completing the practical work, evaluate the method used and results obtained. In this evaluation you should:
comment on the suitability of the procedure
describe and explain any changes you made to the method provided
explain the safety precautions taken during this practical
discuss the quality of your results, including comments on the validity of the results, and the repeatability, accuracy and precision of any measurements made
Salters-Nuffield Advanced Biology Resources
Activity 3.9 Student Sheet Core PracticalMethod 1 Using toluidine blue stain
SAFETY
1 M hydrochloric acid is an irritant. Wear eye protection, lab coats and disposable gloves. Toluidine blue is harmful if ingested and will also stain skin and clothes.
Wear lab coats and disposable gloves.
Always use the fine forceps to move the root tip sample to/from solutions.
Be aware of the risk of using microscopes where direct sunlight may strike the mirror.
YOU NEED ● Garlic roots ● 1 M hydrochloric acid ● Toluidine blue stain ● Cold distilled water
● 2 watch glasses or small sample tubes ● Hollow glass block or small sample tube ● Pipettes (and pipette fillers) or small measuring
cylinders
● Microscope slides and coverslips ● Pair of fine forceps
● Filter paper or soft tissue paper
● Microscope with magnifications of 100 and
400
● Fine scissors
Procedure
1 Cut off about 5 mm from several root tips of some growing garlic roots using fine scissors. Choose root tips that are white and have a firm, rounded end; tips that are turning brown will give poor results.
2 Put the root tips into a hollow glass block or small sample tube containing 2 cm3 1 M hydrochloric acid for exactly 5 minutes.
3 Put the root tips in a watch glass containing approximately 5 cm3 cold water. Leave the root tips for 4–5 minutes, then dry them on filter paper. Take care – the root tips will be very fragile.
4 Transfer one of the root tips to a clean microscope slide.
5 Gently break up the root tip with a mounted needle (this is called maceration). Add one small drop of toluidine blue and leave to stain for 2 minutes.
6 Cover with a coverslip and blot firmly with several layers of tissue or filter paper. Press gently to spread the root tip, or tap gently on the coverslip with the end of a pencil.
7 View under the microscope (400 magnification) and look for cells with visible chromosomes. If cells are overlapping, squash the slide again between two wads of filter paper. Avoid lateral movement of the coverslip.
8 Look for regularly shaped, actively dividing cells. DNA stains dark blue with toluidine blue stain so you should be able to see blue groups of chromosomes against a paler background.
Salters-Nuffield Advanced Biology Resources
Activity 3.9 Student Sheet Core PracticalMethod 2 Using orcein ethanoic stain
SAFETY
Wear eye protection, lab coats and disposable gloves throughout. 1 M hydrochloric acid is an irritant.
Orcein ethanoic stain is corrosive, irritant, causes burns, has an irritating vapour and stains. Avoid contact with skin. If contact does occur, wash the area thoroughly with water for 10 minutes. Mop up spillages immediately.
Acetic alcohol is both corrosive and highly flammable. Avoid skin contact. Always use the fine forceps to move the root tip sample to/from solutions.
Be aware of the risk of using microscopes where direct sunlight may strike the mirror.
YOU NEED ● Garlic roots ● 1 M hydrochloric acid
● Acetic alcohol (ethanoic alcohol) ● Orcein ethanoic stain (acetic orcein) ● Ice-cold distilled water
● Water bath at 60 °C
● 2 watch glasses or small sample glasses ● Test tube
● 2 pipettes (and pipette fillers) or small measuring cylinders
● Microscope slides and coverslips ● Pair of fine forceps
● Filter paper or soft tissue paper
● Microscope with magnifications of 100 and
400
● Fine scissors
Procedure
1 Put a test tube containing 2 cm3 1 M hydrochloric acid into a water bath at 60 °C.
2 Cut off about 5 mm from several root tips of some growing garlic roots using fine scissors. Choose root tips that are white and have a firm, rounded end; tips that are turning brown will give poor results.
3 Put the root tips in a watch glass containing approximately 2 cm3 of acetic alcohol for a minimum of 10 minutes.
4 Remove the root tips and place them in a second watch glass with approximately 5 cm3 ice-cold water. Leave for 4–5 minutes, then dry the root tips on filter paper. It is important to blot the tips well to remove the water at this stage or a precipitate may form when staining.
5 Put the root tips into the pre-heated hydrochloric acid for exactly 5 minutes.
6 Repeat step 3. Take care – the root tips will be very fragile.
7 Transfer one of the root tips to a clean microscope slide.
8 Gently break up the root tip cells with a mounted needle (this is called maceration). Add one small drop of acetic orcein stain and leave to stain for 2 minutes.
9 Cover with a coverslip, and blot firmly with several layers of tissue or filter paper. Press gently to spread the root tip, or tap gently on the coverslip with the end of a pencil.
10 View under the microscope (×400 magnification) and look for cells with visible chromosomes.
11 Look for regularly shaped, actively dividing cells. DNA stains dark red/black with acetic orcein stain so you should be able to see red/purple groups of chromosomes against a paler pink background.
Salters-Nuffield Advanced Biology Resources
Activity 3.9 Teacher Sheet Core PracticalOBSERVING MITOSIS
Purpose
To prepare some slides of actively dividing plant tissue.
To observe the stages of the cell cycle in living tissue.
To determine the duration of the stages of mitosis in relation to the whole cell cycle.
To develop practical skills.
SAFETY
Wear eye protection, lab coats and disposable gloves throughout.
Review the students’ risk assessments and discuss any safety considerations. 1 M hydrochloric acid is an irritant.
Toluidine blue is harmful if ingested and will also stain skin and clothes.
Orcein ethanoic stain is corrosive, irritant, causes burns, has an irritating vapour and stains. Avoid contact with skin. If contact does occur wash the area thoroughly with water for 10 minutes. Mop up spillages immediately.
Acetic alcohol is both corrosive and highly flammable. Avoid contact with skin. Keep stock bottles of orcein ethanoic stain and acetic alcohol in a fume cupboard.
Ensure direct sunlight cannot shine on the microscope mirrors. Demonstrate how to insert the slide correctly onto the stage. Ramming the slide may produce glass shards.
Make sure students always use the fine forceps to move the sample to/from the solutions.
Notes on the procedure
This is a Core Practical so students need to be familiar with how the stages of mitosis can be observed practically.
It is assumed that the students will be familiar with the stages of mitosis before undertaking this activity.
Two alternative practical schedules are provided. One uses toluidine blue stain. The other is the traditional one using orcein (orcein ethanoic). The technique described using toluidine blue stain is simple, cheap, safe, reliable and quick. The meristem tip is usually a denser white and is more rounded than the cut end. In the orcein ethanoic stain method, root tips may be kept for several months after step 3. Delay squashing for several hours. This allows the cells to harden, reducing the danger of them bursting. It also allows more time for them to take up the stain.
Avoid placing too much material on a slide. If cells are overlapping, squash the slide again between two wads of filter paper. Avoid lateral movement of the coverslip.
Salters-Nuffield Advanced Biology Resources
Activity 3.9 Teacher Sheet Core PracticalNotes on developing practical skills
The activity gives students the opportunity to develop practical skills, in particular microscope skills. Once the practical work is completed students could use the Developing Practical Skills
Self-evaluation Sheet in Practical Skills Support 1 to reflect on the skills that have been addressed through this practical work.
The notes below relate to the numbered points in the Interpreting what you see on your cell preparation section.
1 Scientific drawing from observation with annotations is a required skill that students should have the opportunity to develop. They need to draw clearly and accurately, showing the relative sizes and positions of the chromosomes in relation to the rest of the cell. In examination questions students could be asked to annotate a diagram or drawing; they need to develop a clear
understanding of what this involves. See Practical Skills Support Sheet 8 – using a microscope – for guidance on biological drawing.
2 Students need to present their results in an appropriate table. For guidance on presentation of results see the Maths and Stats Support section of SNAB Online.
3 and 4 Students do some simple calculations and then interpret their findings in relation to the process of mitosis. The length of different phases can be deduced from the number of cells present in each stage. Results will vary. The mitotic index near the tip will be higher than that further along the root because of the higher rate of division in the apical meristem. The results students obtain can be used in the interactive tutorial on mitosis counting in Activity 3.10.
5 Students make measurements using a stage micrometer and eyepiece graticule. Guidance on their use can be found in Practical Skills Support Sheet 9 – size and scale – see the support section of SNAB Online.
In the evaluation of the practical work the Student Sheet guides students to comment on a range of practical skills. The discussion about quality of results is likely to focus on the measurements made. It may include comments on how the validity of results can be ensured by carefully using an eyepiece graticule that has been calibrated correctly using a stage micrometer. Students may comment on the precision of the results and the use of the smallest divisions on the graticule scale. Comments on any repeated measurements might include that there is not a single true value so repeats will show variability and allow means to be compared. An appropriate statistical test can be completed if sufficient data is available.
Toluidine blue method adapted from SAPS Student Sheet 17 – Mitosis in root tips. Acknowledgement: Ashby Merson-Davies, Sevenoaks School, Kent.
Salters-Nuffield Advanced Biology Resources
Activity 3.9 Technician Sheet Core PracticalOBSERVING MITOSIS
Purpose
To prepare some slides of actively dividing plant tissue. To observe the stages of the cell cycle in living tissue.
To determine the duration of the stages of mitosis in relation to the whole cell cycle. To develop practical skills.
Additional points to note
The meristem tip is usually a denser white and is more rounded than the cut end.
Avoid placing too much material on a slide. If cells are overlapping, squash the slide again between two wads of filter paper. Avoid lateral movement of the coverslip.
Method 1 Using toluidine blue stain
This technique is said to be simple, cheap, safe, reliable and quick.
SAFETY
1 M hydrochloric acid is an irritant. Wear eye protection, lab coats and disposable gloves. Toluidine blue stain is harmful if ingested and will stain clothes and skin.
See website version of CLEAPSS Hazcard 32 ‘Dyes, indicators and stains’ for further information.
Requirements per student or group of students
Notes
Root tips Growing garlic roots
This can be done using one of two methods:
● Pushing a garlic clove into the top of a test tube of water. ● Cutting small holes in a polystyrene ceiling tile and pushing the
garlic cloves part-way through these holes, then floating the tile in a tray of water.
Leave until roots develop (3–4 days). The best results are obtained from roots that have just emerged from the clove; roots less than 1 cm in total length are reported to work well.
1 M hydrochloric acid
Toluidine blue stain Toluidine blue stain can be purchased in powder form. Make up a 0.5% solution in McIlvaine buffer (0.1 M citric acid, 0.2 M sodium hydrogen phosphate at pH 4). This should keep for many months at room temperature.
Cold distilled water
2 watch glasses or small sample tubes Hollow glass block or small sample tube
2 pipettes (and fillers) or small measuring cylinders
To measure 2 and 5 cm3.
Microscope slides and coverslips All slides and coverslips should be cleaned with alcohol. Pair of fine forceps
Filter paper or soft tissue paper Microscope with magnifications of 100 and 400
Salters-Nuffield Advanced Biology Resources
Activity 3.9 Technician Sheet Core PracticalMethod 2 Using orcein ethanoic stain
SAFETY
Wear eye protection, lab coats and disposable gloves. 1 M hydrochloric acid is an irritant.
Ethanoic acid is corrosive and very irritating to the respiratory system. Industrial alcohol is toxic and highly flammable. Carry out preparation in a fume cupboard.
The stock solution should be labelled ‘CORROSIVE’ and kept within the fume cupboard.
See website version of CLEAPSS Hazcard 32 ‘Dyes, indicators and stains’ for further information. Set up microscopes in an area without direct sunlight.
Requirements per student or
group of students Notes
Root tips Growing garlic roots
This can be done using one of two methods:
● Pushing a garlic clove into the top of a test tube of water. ● Cutting small holes in a polystyrene ceiling tile and pushing the
garlic cloves part-way through these holes, then floating the tile in a tray of water.
Leave until roots develop (3–4 days). The best results are obtained from roots that have just emerged from the clove; roots less than 1 cm in total length are reported to work well.
1 M hydrochloric acid
About 2 cm3 of acetic alcohol 3 parts of absolute alcohol: 1 part of glacial ethanoic (acetic) acid,
which should be freshly mixed. Industrial spirit or 95% ethanol can be used in place of absolute alcohol, but chromosomes may not be as clearly defined. Root tips may be kept for several months after step 3. Delaying squashing for several hours allows the cells to harden, reducing the danger of them bursting.
A small drop of orcein ethanoic stain Lacto-propionic orcein or acetic orcein can be used. Concentrated lacto-propionic orcein stain is diluted to a 45% solution by volume with distilled water. The stain must be filtered prior to each use. Orcein ethanoic stock solution contains 2.2 g orcein dissolved in 100 cm3 glacial ethanoic acid. Dilute 10 cm3 of stock solution with 12 cm3 of water before use. The diluted solution does not keep.
5 cm3 of ice-cold distilled water
Water bath at 60 C
2 watch glasses or small sample tubes Test tube
2 pipettes (and fillers) or small measuring cylinders
To measure 2 and 5 cm3.
Microscope slides and coverslips All slides and coverslips should be cleaned with alcohol. Pair of fine forceps
Filter paper or soft tissue paper Microscope with magnifications of 100 and 400
Salters-Nuffield Advanced Biology Resources
Activity 3.10 Student SheetMITOSIS CELL COUNT IN A ROOT TIP
Purpose
To determine the length of time each stage of mitosis lasts in a root tip.
In this activity you will investigate the dynamic nature of mitosis by looking at cells in a root tip. The root tip is a meristem, part of a plant where cells are actively dividing.
Preparing for the activity
Counting the number of cells in one phase, for example, telophase, and dividing this number by the total number of cells will give the proportion of cells in that phase. This allows the length of each phase to be calculated if we assume that the proportion of cells in each phase of the cell cycle represents the proportion of time spent by individual cells in each phase.
The cell counts you will need to complete the calculation can come from practical work completed in Activity 3.9, or from the first part of the interactive tutorial that accompanies this activity. In the second part of the interactive tutorial a spreadsheet is used to analyse the data. If you do not have access to a spreadsheet, the exercise can be done without one.
Questions
Q1 Explain how the cells in a root tip photomicrograph (see the interactive tutorial that accompanies this activity or the Student Book, page 124, for an example) or in a root tip squash that you have prepared suggest that there is a sequence of phases to mitosis.
Q2 Why is it fair to assume that the proportion of cells in each phase of the cell cycle represents the proportion of time spent by individual cells in each phase?
Q3 Enter the figures for your cell count into a spreadsheet. Use the spreadsheet to answer the following:
a Calculate the % time spent by cells in each phase (cells in one phase divided by total number of cells, multiplied by 100).
b Assume the cell cycle is completed in 15 hours. Calculate the actual time spent in each phase and produce a pie chart to show this.
Q4 In which phase of the cell cycle do the cells appear to spend most time? Suggest a reason for this.
Q5 Compare your recorded frequencies of the different stages of the cell cycle with the data below that show the observed occurrence in representative microscopic fields. How are these results similar/different from your own cell count?
Phase Number of cells % of total cells
Interphase 2250 83
Prophase 268 10
Metaphase 76 3
Anaphase 51 2
Telophase 79 3
Salters-Nuffield Advanced Biology Resources
Activity 3.10 Teacher SheetMITOSIS CELL COUNT IN A ROOT TIP
Purpose
To determine the length of time each stage of mitosis lasts in a root tip.
Notes on the procedure
In this activity students will investigate the dynamic nature of mitosis by determining the length of time each stage lasts in a root tip. The cell counts needed to complete the calculation can come from practical work or the first part of the interactive tutorial that accompanies this activity. A spreadsheet is used to analyse the data in the second part of the interactive tutorial. The exercise can be done without a spreadsheet if there is no access to one.
Answers
Q1 In a large enough sample of cells, it should be possible to recognise that there are cells in each phase of mitosis. These are actually convenient reference points in a continuous sequence and some cells will show the intermediate positions of chromosomes.
Q2 As long as the sample is large enough, this assumption should be correct. The longer a phase, the more cells are likely to be going through that phase at any point in time.
Q3 If students use the photomicrograph within the interactive tutorial there will be some variation in their answers because identifying the phases of all the cells is very difficult.
Q4 Interphase – few of the cells are undergoing mitosis, reflecting the period of time needed for growth and synthesis between cell divisions.
Q5 The answers for this will refer to the results obtained by students for question 4.