Controller Area Network (CAN) Bus Simulator and Data-logger
for In-Vehicle Infotainment Testing
Sandra Roksic
Senior Project Report
ELECTRICAL ENGINEERING DEPARTMENT
California Polytechnic State University
Table of Contents
Section Page
List of Tables ………...………....………..3
List of Figures………....………....…3
Abstract………..………...4
Chapter 1 – Background and Introduction……...………...5
On-Board Diagnostic (OBD-II)………..……....6
Controller Area Network (CAN) Bus………...7
In-Vehicle Infotainment……...………...9
Infotainment Workbench………...………...10
Chapter 2 – Requirements and Specifications………...11
Customer Needs Assessment………...11
Market Research and Analysis………...12
Requirements and Specifications………...13
Chapter 3 – Functional Decomposition………16
Level 0 Block Diagram……….16
Level 1 Block Diagram……….16
Chapter 4 – Project Planning……….18
Gantt Chart………..18
Cost Estimates………..20
Chapter 5 – Design Implementation……….21
Design Overview………..21
Hardware………..22
Chapter 6 – Testing and Verification……….24
CAN-Bus Message Frame……….24
CAN-Bus Simulator………..28
Speed………...29
Lane Change Indicators………...30
Four-State Transmission Status………....31
CAN-Bus Data-Logger……….32
Chapter 7 – Extension and Future Work ……….………....36
CAN-Bus DBC………...36
Vehicle Implementation………..………..37
Chapter 8 – Conclusion………...39
References………....40
Appendix A – ABET Senior Project Analysis………....42
Appendix B – CAN-bus Simulator Arduino Code………....46
Appendix C – CAN-bus Data-logger Arduino and MATLAB Code………...51
Arduino………....51
MATLAB……….53
List of Tables
Table Page
Table I: Requirements and Specifications………....14
Table II: Deliverables……….………...15
Table III: Cost Estimates………...20
List of Figures
Figure Page Figure 1: OBD-II Pinout demonstrating CAN-bus Location………....6Figure 2: Car with 3 ECUs .……….7
Figure 3: Car with 3 ECUs and CAN-bus System………...………...7
Figure 4: Audi A6 In-Vehicle Infotainment System………...9
Figure 5: Audi Q7 Infotainment Workbench………10
Figure 6: 2001 Audi A6 In-Vehicle Infotainment………..11
Figure 7: 2019 Audi A6 In-Vehicle Infotainment……….………...…...11
Figure 8: In-Vehicle Computer System by Value………...12
Figure 9: In-Vehicle Computer System by Volume …………..…………...12
Figure 10: Level 0 Block Diagram……….…..………...16
Figure 11: Level 1 Block Diagram………...………....16
Figure 12: Gantt Chart Winter 2020 - EE460………..…...18
Figure 13: Gantt Chart Winter 2020 - EE461……….18
Figure 14: Gantt Chart Spring 2020 - EE462……….19
Figure 15: Final Product - CAN-Bus Simulator and Data-logger………....21
Figure 16: Arduino Leonardo Micro-controller Board……….22
Figure 17: Seeed Studio CAN-Bus Shield V2………23
Figure 18: DB-9 Connector Pinout………...23
Figure 19: CAN-Bus Fields………...24
Figure 20: User Controlled Simulator Inputs………....28
Figure 21: Simulated CAN-Bus Signal for Speed……….29
Figure 22: Simulated CAN-Bus Signal for Lane Change Indicator………....30
Figure 23: Simulated CAN-Bus Signal for Four State Transmission State………..…………...31
Figure 24: Simulated CAN-Bus Data-logging Process………....………..…………...32
Figure 25: Analog Discovery List of Custom CAN-Bus Generated Waveforms…....……..…………...33
Figure 26: Analog Discovery Unlock Door State CAN-H Signal…………....………..…………...33
Figure 27: Arduino Serial Plot Unlock Door State CAN-H Signal………….………..…………...34
Figure 28: CAN-Bus Simulator and Data-logger Configuration…....……….………..…………...37
Figure 29: Suggested CAN-Bus Simulator and Data-logger Hardware Set-up………….……..…...38
ABSTRACT
In the infotainment testing environment, various tools simulate a select range of Controller Area Network (CAN) bus signals onto the infotainment workbench. The integration of signal input devices and
trace-gathering tools often results in a cluttered workspace and an inefficient testing environment. This project eliminates the need for multiple signal simulators and allows for a single system source for various input CAN-bus messages. This system enables the tester to store output CAN-bus data from the test vehicle for future reference and analysis through the same integrated system. It optimizes the time it takes the tester to complete testing catalogs and minimizes the need for redundant devices thus reducing cost and energy usage. This project permits the tester to gather and source data using a single device both in the lab and in the vehicle during test drives.
The system involves a micro-controller and CAN-bus shield to send and receive CAN-bus messages. The programmed micro-controller simulates vital signals onto the infotainment workbench. Additionally, the micro-controller and shield can act as a data-logger to store the changing CAN-bus messages sourced from the test vehicle. This project develops a method to log data offline into a CSV file for later processing. CSV stands for “comma-separated values” and allows tabular data formatting. The scope of this project focuses on a select few CAN messages: speed, transmission status, door unlock state, cruise control, and lane change indicators. The project cumulatively provides the tester with the ability to simulate CAN-bus messages and log data within the vehicle.
CHAPTER 1 – BACKGROUND AND INTRODUCTION
The early beginnings of CAN-bus communication were presented by the German automotive company, Bosch, at the Society of Automotive Engineers congress in Detroit in 1986 [1]. Prior to this, vehicles primarily operated using a point-to-point wiring system. Each essential component was directly wired to the next. The increasing complexity of the sensors, actuators, and electronic control units (ECUs) present within modernized vehicles contributed to a high noise environment and added excess weight to the vehicle. By implementing the CAN-bus as a two-wired pair, the signals become more robust against the noisy
environment and dramatically decrease the weight of the vehicle by simplifying the wired path between the various components [1].
This simplification of the wiring system and implementation of the CAN-bus became the new standard of vehicle communication [2]. It has enabled engineers to develop more complex and robust systems that are easily configured to the existing CAN, such as new and integrated in-vehicle infotainment systems. In-vehicle infotainment faced a rapid technological evolution as a result of the CAN-bus. With fewer wires and a more resilient form of data transmission, engineers can implement highly complex systems within the vehicle without dramatically impacting its core functions. This has resulted in more imaginative vehicle designs that are highly sophisticated and elaborate computing systems which alter a standard drive into a full driving experience with many displays, notifications, and customizable settings.
This introduction describes the following key terms and technologies used in modern in-vehicle infotainment testing.
On-Board Diagnostic (OBD-II)
Beginning in 1962, each vehicle in the U.S. was designed with an on-board diagnostic (OBD-II) system [3]. The OBD allows the vehicle to self-diagnose and provide status reports to a universal output port commonly presented on the bottom left section of the driver’s cabin. The OBD-II pinout is shown in Figure 1. It contains 16 pins and utilizes various tools within the vehicle in order to provide the driver with further information on the vehicle’s status. Pins 6 and 14, shown in green in Figure 1, contain the CAN-H and CAN-L signals vital for the functionality of this project. CAN-H and CAN-L are critical in diagnostics and are the main form of communication within the vehicle. Although there are various other vehicle
communication protocols, such as: LIN, FlexRay, K-line, ethernet, and MOST, this project focuses on the widely used CAN-bus for vehicle communication. Further information regarding this CAN-bus is presented in the following section.
Figure 1: OBD-II Pinout demonstrating CAN-bus Location [3]
Controller Area Network (CAN) Bus
A Controller Area Network (CAN) bus is a communication standard used to allow micro-controllers and other devices to communicate within a vehicle. The CAN-bus links various electronic control units (ECUs) within the vehicle and allows for more efficient and faster data transfer, in comparison to standard single strand transmission wires, by prioritizing which signals are processed per each ECU. Each main function of the vehicle corresponds to a specific ECU [4]. For modern vehicles, there can be close to 100 distinct ECUs, 50 actuators, and nearly 250 sensors relating to the overall functionality of the car [5].
In Figure 2, the vehicle is shown using a communication method without the CAN-bus. There are large amounts of wires contributing to the total weight of the vehicle. Additionally, this wiring contributes to added noise in the signals due to the large noise environment developed within the vehicle from engine noise, wind resistance, radio interferences, and other added factors. In Figure 3, the vehicle has implemented the
CAN-bus. This minimizes the wiring in the vehicle and is better optimized for noise, due to the two-wire pair of the CAN line. Additionally, the reduced wiring lowers the total weight of the vehicle which minimizes fuel consumption based on the reduction of torque in the wheels and motor [6].
Figure 2: Car with 3 ECUs [6] Figure 3: Car with 3 ECUs and CAN-bus System [6]
A message on the CAN-bus consists of two main components: the message ID and the message data. The message ID corresponds to the specific ECU that the signal is sourced from. The ECU’s communicate with each other via the CAN-bus line. The message data is the specific content message generated by the ECU [2]. Within the vehicle, there is a gateway control unit. The gateway navigates and regulates the sending and receiving of messages along the CAN-bus line and serves as the common node for all messages to pass
In Figure 3, the blue blocks represent ECU’s and the yellow blocks are sensors and actuators. It is the ECU’s job to translate data from the sensors and actuators onto the CAN-bus line. In application, the ECU for the driver’s door is separate from the cruise control ECU. When the driver opens the door of the vehicle, the door ECU sends a message onto the CAN-bus line which transmits the signal to all other ECUs, including the cruise control ECU. However, the cruise control ECU, despite recognizing that there is a message, does not do anything because the message ID of the door ECU does not match that of the cruise control ECU. Only messages directed towards the cruise control ECU can be interpreted by the cruise control ECU. This is determined based on the message ID on the CAN-bus frame as well as the ACK bit explained in the section titled “CAN-Bus Message Frame” presented in Chapter 6 of this report.
The CAN-bus system is primarily composed of 3 types: Drive-train CAN-bus, Convenience CAN-bus, and Infotainment CAN-bus.The transmission of the Drive-train CAN-bus is at a higher speed (500 kbps) in comparison to the low speed of the Convenience and Infotainment CAN-bus (100 kbps) [2][6]. The Drive-train CAN-bus contains ECUs relating to systems such as: engine control unit, brake control unit, steering angle sensor, and airbag control unit. The Convenience CAN-bus contains ECUs relating to systems such as: climate control unit, tire pressure check, and driver door control unit. The Infotainment CAN-bus contains ECUs relating to systems such as: radio, navigation, and phone interface box [6]. The Infotainment CAN-bus differs from the in-vehicle infotainment discussed in the following section. The Infotainment CAN-bus is responsible for processing and communicating with rest of the vehicle in terms of the software and hardware components of the in-vehicle infotainment system
In-Vehicle Infotainment
The in-vehicle entertainment is referred to as “infotainment” [3]. This is composed of various hardware and software elements that serve to notify and assist the driver. The infotainment system consists of components such as the instrument cluster, the center screen, and any steering wheel controls [3].
An example of a modern in-vehicle infotainment system can be observed in Figure 4. The infotainment system in modern vehicles is a vital component responsible for a significant portion of the interactions between the driver and the vehicle. It is used to display navigation routes, speed, passenger seat belt states, driver assist modes, and other necessary information that the driver needs to be aware of during the drive.
1. Blind-spot warning 4. Head-up display
Indicator
5. Instrument cluster 2. Window + mirror
Controls 6. Steering wheel
Controls 3. Lighting controls
7 7. Center Console
Figure 4: 2019 Audi A6 In-Vehicle Infotainment System adopted from [7]
Infotainment Workbench
In order to easily accommodate the test engineer during the infotainment testing process, many automotive companies have established an alternative form of testing dependent on the key components of the in-vehicle infotainment system which eliminates the need for direct in-vehicle testing. By extracting the instrument cluster, speakers, microphones, steering wheel controls, and the center screen from the test vehicle, test engineers have developed an infotainment workbench, like the one shown in Figure 5. This workbench allows the test engineers to test the functionality of the infotainment system without having to be in the actual vehicle.
The software developed for the in-vehicle infotainment system is uploaded onto the infotainment workbench in the same manner it is uploaded onto test vehicles: through a USB interface. It is the test engineers’ job to ensure that the software loaded onto the infotainment workbench and vehicle is correct according to the company’s specifications. This includes ensuring the accurate display of navigation routes, timely speedometer updates, speech recognition, confirming the accuracy of the colors displayed and many other functions.
Figure 5: Audi Q7 Infotainment Workbench [8]
CHAPTER 2 – REQUIREMENTS AND SPECIFICATIONS
The requirements and specifications for the CAN-bus simulator and data-logger are dependent on the customer needs assessment and the market research presented in the following pages. This analysis is intended to help define consumer motives and is proposed to be adjusted based on customer feedback and suggestions.
Customer Needs Assessment
Due to the growing innovations in the automotive industry, there is a noticeable rise in the sophistication of infotainment systems within vehicles [5]. This can especially be seen in Figure 6 and Figure 7 below. The 2001 model presented in Figure 6 demonstrates a primarily elementary infotainment system in comparison to the infotainment found in the 2019 model shown in Figure 7. The demand for comfort, speed, and the
electrification of today’s consumer vehicles has resulted in a more integrated and fully immersive driving experience. Vehicles today possess complex, highly skilled computing systems. This especially holds true in infotainment systems. The multifaceted infotainment system today is responsible for far more than just updating the driver on their speed or displaying the current radio station. It informs the driver of speed limits, navigation routes, current road conditions, displays a 360° view around the vehicle, and many other
sophisticated operations.
Figure 6: 2001 Audi A6 In-Vehicle Infotainment [9] Figure 7: 2019 Audi A6 In-Vehicle Infotainment [7]
Market Research and Analysis
There are various simulators available on the market currently that supply vehicle infotainment test engineers with limited CAN signals such as speed. However, these speed simulators are bulky and typically simulate only one signal (speed) compared to the various simulation capabilities presented in this project utilizing a small and portable encasing. These speed simulators are compatible with infotainment workbenches and are specifically used to test speed related functions by the infotainment test engineer with little to no other simulation capabilities. The speed simulators allow the test engineer to verify certain infotainment software test cases without needing to go into the actual vehicle itself.
Additionally, the vehicle infotainment industry is highly dependent on a select few data-logging software applications implemented to categorize and decode the incoming CAN-bus messages from the vehicle. Tools such as CANoe are highly sophisticated data processing software that enable the test engineer to understand vital vehicle feedback from a test drive [10]. In various automotive companies, CANoe data is logged using a device called blue piraT [11]. Blue piraT is an expensive yet highly reliable device used inside the vehicle. However, its functionality is limited without a data processing software such as CANoe and these tools together are very costly.
The market value of in-vehicle systems is growing rapidly and is proposed to reach an industry value of 980 million U.S. dollars by the year 2025. In 2020, the industry value is reported as 565 million U.S. dollars. This is a proposed compound annual growth rate of 11.6% over the next five years [12]. This market trend is
demonstrated in Figures 8 and 9. This project aims to condense the size and portability of the simulator, increase the number of CAN-bus simulated signals to include more than just speed, and greatly reduce the cost of the data logging process. This design is developed in anticipation of the growing complexity of in-vehicle infotainment systems which would require test engineers to verify a larger number of test cases with greater complexity.
Figure 8: In-Vehicle Computer System Figure 9: In-Vehicle Computer System by Value derived from [12] by Volume derived from [12]
Requirements and Specifications
The marketing requirements presented in Table I correspond to the outlined engineering requirements mentioned in the same table. This project utilizes the CAN-bus to send simulated communication signals to the infotainment workbench. Additionally, it extracts CAN-bus messages from the test vehicle. In order to access this data, the device developed in this project must comprise a CAN capable micro-controller small enough to fit safely within the vehicle’s center console and within the lab’s workbench. This portability requirement is outlined as the first marketing requirement in Table I. The portability of the resulting device enables the tester to implement the tool in various settings and thus optimize the logging and data gathering time.
Typical to most developing technologies, this project must create a low cost and energy efficient device that ensures optimal profit for the customer as shown in the second and third marketing requirements of Table I. The low cost enables the customer to generate greater revenue and promote the accessibility of the CAN-bus simulator and data-logger to a vast majority of users. If the device is cost effective, then potentially each test engineer can be equipped with their own CAN-bus simulator and data-logger. Enabling the test engineer to have this readily accessible tool will ensure greater productivity and faster completion of test cases.
Additionally, the device’s operating input power must be compatible with the output capabilities of the electric battery of the vehicle. The standard voltage for an electric battery inside the vehicle is 12V [2]. The device shall not exceed this limit in order to ensure the proper operation of the device and promote a more efficient usage. Having the capability of powering the device through the vehicle while data logging eliminates the need for an external power supply to the device in this mode thus adhering to the energy efficient
marketing requirement.
Compatible with the requirement to be portable and low cost, the resulting product of this project must be versatile and multifunctional in order to generate a more efficient and streamlined infotainment testing process. This project combines multiple CAN-bus signal generators and a data-logger in one compact device. Having this versatility allows the test engineer to focus more of their time on the testing process rather than the configuration of testing instruments and data-loggers.
As defined by the fifth marketing requirement in Table I, the resulting device must be intuitive and easily user implemented such that the input signals easily transmit onto the infotainment workbench through switches and dials. The output signals must promote understanding and clearly display the desired changes and logging process occurring at the time of testing.
The resulting timeline of deliverables is shown in Table II. This project should take approximately 144 hours to meet the marketing and engineering requirements presented in Table I and adhere to the deliverable dates presented in Table II.
TABLE I
CAN-BUS SIMULATOR AND DATA-LOGGER REQUIREMENTS AND SPECIFICATIONS
Marketing Requirements
Engineering Specifications
Justification
1, 4 Simulator and data-logger
dimensions should not exceed 5”x8”x3”
The simulator/data-logger can fit within the vehicle’s center console and the lab’s workbench. It interacts with any vehicle operating on the CAN-bus.
2, 3, 5 Display test signals onto the PC
screen
The display emulates the vehicle and workbench; displaying and confirming the proper CAN-bus message transmission. This displays simple graphs in an energy efficient and cost-effective way through the computer.
1, 2, 5 Send/read CAN-bus data
through a micro-controller
The micro-controller implements CAN-bus messages into a readable form. Arduino micro-controllers are inexpensive and portable devices.
3 Process CAN-bus signals in 100
– 500 kbps range
The CAN-bus shield sends and receives CAN messages in the 100-500 kbps range which does not require high voltage (does not exceed 12V).
2, 3, 5 Emulate input signal
transmission through switches and rotary dials
Having switches and dials enables the user to
intuitively send selected CAN-bus messages and does not require much operational space.
1, 2, 5 Implement Arduino Leonardo
micro-controller for data processing
The Arduino allows simple user interface and implementation methods for new/inexperienced users.
3 Micro-controller must operate at
12V ± 2V
The system should be capable of eventual vehicle implementation utilizing the car’s 12V battery at different levels of charge.
Marketing Requirements 1. Portable
2. Low cost 3. Energy efficient
4. Multi-functional / versatile 5. Intuitive user interface
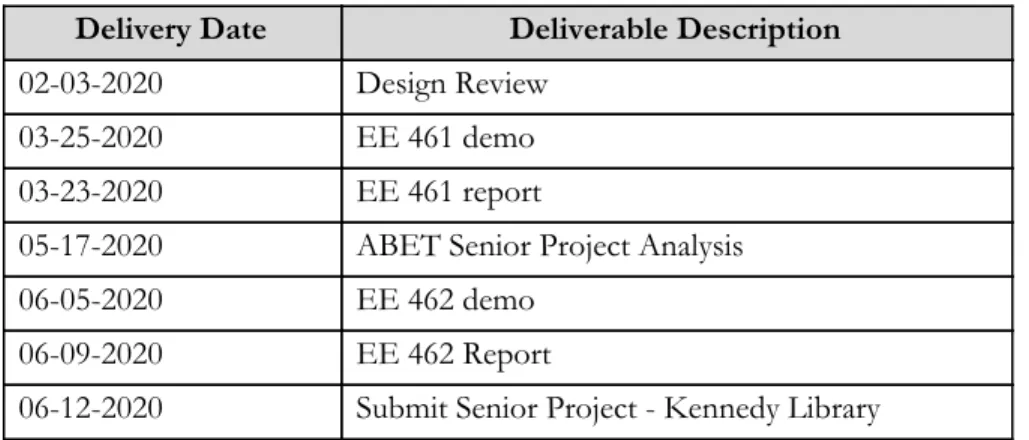
TABLE II
CAN-BUS SIMULATOR AND DATA-LOGGER DELIVERABLES
Delivery Date Deliverable Description
02-03-2020 Design Review
03-25-2020 EE 461 demo
03-23-2020 EE 461 report
05-17-2020 ABET Senior Project Analysis
06-05-2020 EE 462 demo
06-09-2020 EE 462 Report
06-12-2020 Submit Senior Project - Kennedy Library
CHAPTER 3 – FUNCTIONAL DECOMPOSITION
The following chapter includes the function decomposition of the project in both a Level 0 and Level 1 diagram. These diagrams are illustrated in Figure 10 and Figure 11 respectively. The Level 1 diagram provides a distinction between the two main modes of operation: the CAN-bus simulator and the CAN-bus
data-logger. Both demonstrate the overall functionality of the device and aim to clarify the input and output expectations.
Level 0 Block Diagram
Figure 10: Level 0 Block Diagram
Level 1 Block Diagram
Figure 11 demonstrates the functionality of the CAN-bus simulator and data-logger. The dashed line defines the extent of this project's scope. The level 1 block diagram from Figure 11 demonstrates the following:
Inputs:
· Analog speed derived from user entered dial/knob.
· Digital door lock/unlock, cruise control, lane change indicator, send/receive control derived from user manipulated switches
· Digital transmission state derived from user manipulated multi-state switch.
· CAN-bus message derived from the vehicle. The vehicle functionality in this project is emulated using an Analog Discovery custom waveform generator
Outputs:
· CAN-bus signal capable of being implemented onto the infotainment workbench and vehicle
The CAN-bus simulator contains five hardware components that the user can control via dials and switches. These inputs give the user the ability to simulate speed, door lock/unlock states, transmission state, cruise control, and lane change indicators as shown in Figure 10. In the level 0 diagram, shown in Figure 10, the plant is the vehicle in the receive case and the infotainment workbench in the send case. The signals are output via the CAN-bus which enables communication to the infotainment workbench and vehicle. In Figure 11, the “send CAN-bus” signal that would enter the infotainment workbench is verified using an oscilloscope and is explained further in the “CAN-Bus Simulator” section in Chapter 6. Additionally, for the purpose of this project, the “receive CAN-bus” signal, in Figure 11, is verified utilizing a custom waveform generator to act as the vehicle.
CHAPTER 4 – PROJECT PLANNING
The following schedules and cost estimates are designed to provide a clear timeline and structure to the project deliverables. These define the project constraints in terms of time and expenses.
Gantt Chart
The Gantt Charts shown in Figures 12, 13, and 14 demonstrate the timeline of this project. The red blocks indicate a design-build-test iteration present in Winter and Spring quarter. For Winter 2020, the Gantt Chart for EE460 demonstrated in Figure 12 is concurrent with the Gantt Chart for EE461 meaning the project and planning aspect is run at the same time to ensure the timely completion of the project. In Winter 2020, the Gantt in Figure 13 accounts for purchasing parts, implementation of the signal simulator, and testing time with an adjustment period for unforeseen setbacks. The Spring 2020 Gantt, in Figure 14, accounts for the implementation of the data-logger, further market research, and reporting.
Figure 12: Gantt Chart Winter 2020 – EE460
Figure 13: Gantt Chart Winter 2020 – EE461
Figure 14: Gantt Chart Spring 2020 – EE462
Cost Estimates
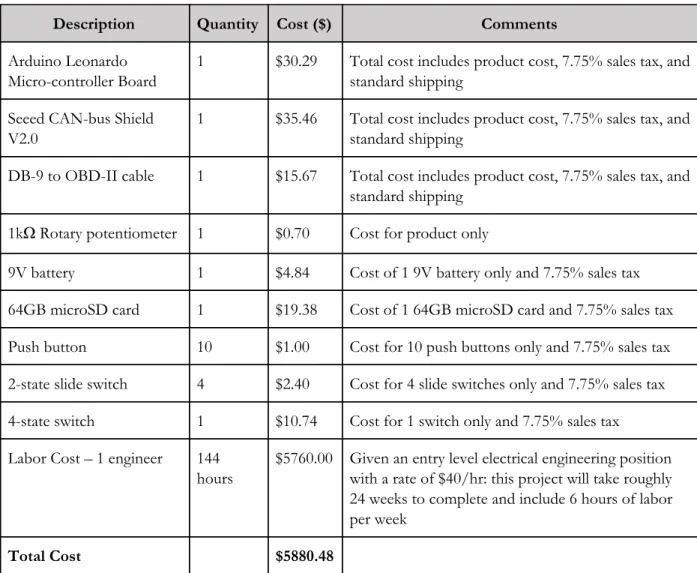
The cost estimates presented in Table III relate to the culmination of the electronic components, technologies and labor costs involved in the development and implementation of this project. The labor cost is calculated based on the standard, entry-level electrical engineering position. The rate is $40/hr and it is estimated that this project entails 6 hours of labor per week for 24 weeks. This results in a total of $5760.00 in labor costs. Each hardware component’s price includes a sales tax of 7.75%.
TABLE III
CAN-BUS SIMULATOR AND DATA-LOGGER COST ESTIMATES
Description Quantity Cost ($) Comments
Arduino Leonardo Micro-controller Board
1 $30.29 Total cost includes product cost, 7.75% sales tax, and
standard shipping
Seeed CAN-bus Shield V2.0
1 $35.46 Total cost includes product cost, 7.75% sales tax, and
standard shipping
DB-9 to OBD-II cable 1 $15.67 Total cost includes product cost, 7.75% sales tax, and
standard shipping
1kΩ Rotary potentiometer 1 $0.70 Cost for product only
9V battery 1 $4.84 Cost of 1 9V battery only and 7.75% sales tax
64GB microSD card 1 $19.38 Cost of 1 64GB microSD card and 7.75% sales tax
Push button 10 $1.00 Cost for 10 push buttons only and 7.75% sales tax
2-state slide switch 4 $2.40 Cost for 4 slide switches only and 7.75% sales tax
4-state switch 1 $10.74 Cost for 1 switch only and 7.75% sales tax
Labor Cost – 1 engineer 144
hours
$5760.00 Given an entry level electrical engineering position with a rate of $40/hr: this project will take roughly 24 weeks to complete and include 6 hours of labor per week
Total Cost $5880.48
CHAPTER 5 – DESIGN IMPLEMENTATION
This chapter introduces the design considerations necessary in the development of this project in accordance to the previously defined marketing and engineering specifications presented in Chapter 2. The resulting configuration documented in this chapter is intended to provide the reader with a greater understanding of the physical characteristics of the project and its functions.
Design Overview
The design of the CAN-bus data-logger and simulator considers the previously defined marketing and engineering requirements in order to ensure proper product execution. Intuitive components such as switches, buttons, and dials in this design allow the user to easily and quickly configure the simulated signals desired for output. The final product, shown in Figure 15, demonstrates this implementation of physical components and the configuration of the CAN-bus simulator and data-logger with the Arduino
micro-controller.
Figure 15: Final Product - CAN-Bus Simulator and Data-logger
Hardware
The CAN-bus simulator and data-logger uses an Arduino Leonardo micro-controller, shown in Figure 16, with an attached CAN-bus shield designed by Seeed Studio. The CAN-bus shield V2 is shown in Figure 17. The pins of the shield attach to the pins of the Arduino board and provide a compact design. The CAN-bus shield also contains a microSD card slot. This is used to log data gathered into a CSV file for later analysis if the test engineer desires. The Arduino micro-controller and CAN-bus shield communication via SPI interface using the stand-alone six pin SPI cluster located on the Arduino Leonardo shown in Figure 16.
Figure 16: Arduino Leonardo Micro-controller Board [13]
The Arduino Leonardo micro-controller uses an Atmel ATmega32U4 microchip [14]. This micro-controller is compact in size. It is 68.6 mm in length and 53.3 mm in width and weighs a total of 20g which allows for portable use inside the test vehicle and the infotainment workbench station. It contains 20 digital
input/output pins utilized for simulation inputs in this project. The internal clock runs on a 16 MHz crystal oscillator and has a flash memory of 32 KB with 13 independent prescalers which are used to adjust the sampling rate in the data-logging section of this project. This Arduino operates at 5V with an input voltage range of 7-12V. This Arduino is capable of being powered directly from the car during data-logging [13].
Figure 17: Seeed Studio CAN-Bus Shield V2 [15]
This particular shield is used for the project because of the ease at which it can configure with the Arduino micro-controller. Additionally, the CAN-bus shield contains a DB-9 connector port. This port is the key component that enables the device to communicate with the test vehicle/infotainment workbench. As shown in Figure 18, Pins 2 and 7 of the DB-9 port contain the CAN-H and CAN-L signals. Later, the DB-9 port is used for data gathering purposes utilizing an OBD-II to DB-9 connector cable. The CAN-bus shield contains direct CAN-H and CAN-L ports. They are shown in Figure 17 in orange. The user is highly dependent on these two ports in order to gather direct CAN-bus data without needing to probe into the tight pin
configuration of the DB-9 connector port. For the purpose of this project, these two orange ports are used to access CAN-bus data for verification and testing validation purposes only. The two signals, CAN-H and CAN-L, are generated and processed on the CAN-bus shield using the MCP2515 stand-alone CAN controller with SPI interface. The MCP2515, working in partnership with the Arduino micro-controller, allows the user to define, send, read, and interpret CAN-bus messages.
CHAPTER 6 – TESTING AND VERIFICATION
This chapter intends to demonstrate the proper implementation of the developed device. The following procedure defines the functional testing and verification methods of the two distinct and core functions of this project: the CAN-bus simulator and the CAN-bus data-logger. Prior to this testing and verification, it is important to first present a more detailed break-down of the CAN-bus message frame.
CAN-Bus Message Frame
The CAN-bus message frame is composed of various fields, shown in Figure 19. Each field has a unique purpose and structure in relation to the bus. Note, the CAN-H signal is always the inverse of the CAN-L signal. In order to validate the simulated output signals of the device, the oscilloscope captures presented in the following section are annotated to identify and explain the significant fields within each simulated CAN-bus frame. For simplicity, only the CAN-H signal is captured in the oscilloscope frame in order to enable simplified read-outs.
Figure 19: CAN-Bus Fields [4]
It is critical to note that the composition of any CAN-bus frame is uniquely defined by individual car
manufacturers in order to ensure the safety and security of the vehicle's information. The CAN-bus protocol specifies a common structure in terms of fields present, however the CAN-bus messages within each vehicle model are distinct and may even contain bit stuffing in order to ensure secure communication within the vehicle. The CAN-bus data of a vehicle is classified and a non-disclosure agreement must be made prior to the actual implementation of vehicle-specific CAN-bus messages. This project arbitrarily defines the signals generated. They are not intended to relate to any particular vehicle make or model but can easily be adjusted to accommodate classified CAN-bus messages if requested by an automotive company.
The standard CAN-bus message frame is defined based on the fields presented in Figure 19 and the Bosch CAN 2.0 Specifications [4]. Although there are error correctors, bit stuffing, and various data lengths that alter the length of the frame, the typical CAN-bus message frame contains several standard fields. Each of these fields are explained below:
Start of Frame - 1 bit
The Start of frame denotes the start of the signal transmission. The CAN-bus operates on a dominant low.
Identifier - 11 bits
The arbitration field contains the message identifier. The message identifier is an 11-bit string
containing the protocol unique ID of the message originator. The CAN-bus is capable of establishing an extended frame format with a larger identifier field and message data field (see IDE below). The extended frame format is implemented when there are extensive amounts of signals being generated. This project will not utilize the extended frame because there are enough bits in the standard frame to assign each desired simulated signal a unique ID.
As discussed in Chapter 1, each ECU contains a specific identifier that enables the data to enter onto the CAN-bus based on the priority of the message ID. Significant signals such as speed and engine status have a higher priority than less important signals such as interior cabin lights. The CAN-bus simulator in this project assigns message IDs for each of the five signals. If implemented into an actual vehicle for infotainment testing, the message IDs would be written and adjusted to correspond with the unique IDs respective of the automotive company's specifications.
RTR - Remote Transmission Request - 1 bit
The remote transmission request bit defines the status of the remote frame request and is part of the arbitration field. This bit is a dominant low for data frames and high for remote request frames. In application, transmission of CAN-bus messages occurs when sensors autonomously send out a data frame. This case generates a dominant low in the RTR field. In the case where a destination node requests data from a specific sensor or actuator, the RTR field is populated by a high bit to signal a remote transmission request frame.
IDE - Identifier Extension bit - 1 bit
This bit is dominant low for base frame format and indicates the start of the control field. Base frame format contains the standard 11-bit identifier field. In the case in which an extended frame is
Reserved bit - r0 - 1 bit
As part of the control field, this bit is either dominant low or high and does not contribute to the message data or message ID.
DLC - Data Length Code - 4 bits
The data length code determines the number of bytes of data and is part of the control field. A 4-bit field permits anywhere from 0 to 8 bytes of data relating to the data field.
Data Field - 0 to 64 bits
Depending on the value presented in the DLC field, the data field can vary between 0 and 64 bits. For this project, the data field is 8 bits long. The data field holds the message content and is a key field in the CAN-bus frame. The bits in this field are the most crucial in executing the messages throughout the vehicle. For example, this field would contain the exact binary value relating to a given speed.
CRC - Cyclic Redundancy Check - 15 bits
This cyclic redundancy check assists in error detection and correction along the CAN-bus. This field generates 15 bits of data onto the CAN-bus frame. Typically, these check bits are calculated from the start frame, arbitration field, control field, and data field using a BCH code [4]. Within each given CRC algorithm there can be multiple variations that impose pre-inversion, post-inversion, and reversed bit ordering. The state of each of the 15 bits is therefore not directly configurable without knowledge of these variations. The value of the cyclic redundancy check in this project is not configurable and the specific output does not pose any difficulty in the simulation of the five generated signals.
CRC Delimiter - 1 bit
The CRC delimiter assists in timing synchronization and must be set high in order to ensure proper bit transitioning. This bit allows for a slight timing buffer in the CRC field and ensures the proper execution of the CRC.
ACK - Acknowledgement Slot - 1 bit
This bit is set dominant low when the CAN-bus message is being received and is part of the ACK field. It is high when the CAN-bus message is transmitted. When generating simulated signals in this project, the ACK slot is expected to be set high in the transmit state.
ACK Delimiter - 1 bit
Similar to the CRC delimiter, the ACK delimiter acts as a timing buffer in order to ensure the proper processing of the ACK bit. This is the final bit in the ACK field.
EOF - End of Frame - 7 bits
The end of frame indicates the end of the CAN-bus message and serves as an indicator of completed communication. Per specification, the EOF is high.
Following the end of frame, the CAN-bus frame can also contain an error frame and overload frame. In some cases, the error frame assists in correcting bit misrepresentation in various fields of the CAN-bus message frame. If an error occurs, the signal is capable of bit stuffing in order to account for timing issues as well as bit misrepresentation. Error detection allows the CAN-bus message to edit itself and also identify the location of error bits within the message frame [4]. In addition, an overload frame at the end of the CAN-bus enables the signal to send/receive at a preferred time. The overload frame delays the next incoming data or remote frame and adds additional timing support [4].
CAN-Bus Simulator
The CAN-bus simulator code, shown in Appendix B, developed in Arduino, enables the user to simulate five distinct signals utilizing the CAN-bus message frame defined in the previous section. The five signals are:
1. Speed
2. Left and right lane change indicators
3. Door unlock (down) and door lock (up) states 4. Activation of cruise control (up)
5. A four-state transmission status: park (up), reverse (left), neutral (down), and drive (right).
Figure 20: User Controlled Simulator Inputs
These signals are user controlled through the implementation of various hardware components demonstrated in Figure 20. The above numbers correspond with the labels in Figure 20. This project defines 5 different signals and is capable of generating 265 distinct CAN-bus messages based on the user-defined inputs.
255 speed states
4 transmission states
2 door states
2 lane change indicator states
2 cruise control states
The transmission, door, and cruise control states toggle and send a single CAN-bus message upon a change in state whereas the speed and lane change indicator states send continuous updates via the CAN-bus. A few of the possible simulated CAN-bus messages are analyzed below.
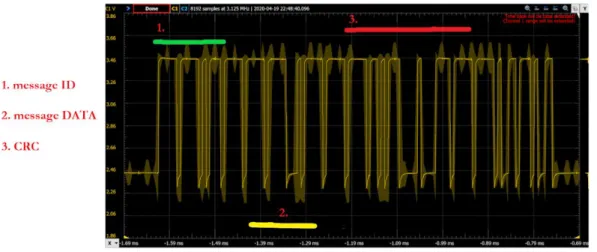
Speed
Figure 21 demonstrates a simulated speed signal along with annotated sections of the message ID and message data fields. This signal exits the CAN-H port from the CAN-bus shield and is displayed using an oscilloscope. The user generates this speed by turning the blue dial (#1) on the hardware shown in Figure 20. The captured waveform is probed at CAN-H and has a peak to peak voltage of 1V with a minimum voltage of 2.5V as expected.
The message ID has a value of 0x8A which corresponds with the defined message ID in Appendix B. This indicates that the signal is properly being identified and transmitting the related message data. Field 2 in Figure 21 indicates the message data field. The decimal value of the message data ranges from 0 to 255. This corresponds with a speed range of 0 to 255 km/h. In Figure 21, the eight bit message data indicates that the user-defined simulated speed of this CAN-bus message is 46 km/h based on its 8 bit binary value.
Lane Change Indicators
The CAN-bus message presented in Figure 22 captures the CAN-H value with a minimum voltage of 2.5V and a peak voltage of 3.5V as per the CAN specifications [4]. Following the same process as for the speed signal prior, the derived message ID from Figure 22 has a hex value of 0xBA which corresponds with the lane change indicator message ID generated in Appendix B. The message data has a hex value of 0x44 which indicates that the signal is sending a left lane change indicator. This hex value for the message data of the left lane change indicator is defined in the code shown in Appendix B.
Figure 22: Simulated CAN-Bus Signal for Lane Change Indicator
Four-State Transmission Status
As expected, the CAN-H signal for the transmission status is a 1Vpp value set at a minimum voltage value of
2.5V. In Figure 23, the message ID provides a hex value of 0x9C which corresponds to the assigned message ID provided in the code in Appendix B.
This project simulates four different transmission states: park, reverse, neutral, and drive. The message data values of each of the four states are defined in Appendix B. From Figure 23, the message data is 0xA2 which is defined as the message data value for “park” in Appendix B. This indicates that the user-defined simulated signal is: transmission state, park.
Figure 23: Simulated CAN-Bus Signal for Four-State Transmission State
Figures 21-23 are used to demonstrate the proper transmission from the developed CAN-bus simulator which can be later implemented onto an infotainment workbench. These simulated signals aid the test engineer in the software testing procedure for infotainment systems.
For example, many features such as sending text messages and inputting navigation routes are blocked while the car is in drive. In these cases, the center infotainment screen of the vehicle displays a warning message. It is the test engineer’s job to ensure that this warning message is displayed properly and in the correct
CAN-Bus Data-Logger
The second portion of this project relates to the data-logging process of CAN-bus messages from a vehicle. CAN-bus data-logs are vital in the infotainment testing environment because they provide the test engineer with fundamental status updates on the functionality of the test vehicle and the proper configuration of the in-vehicle infotainment.
In the infotainment testing industry, each test drive that occurs is documented using a CAN-bus data-logger which reads raw CAN-bus messages as hexadecimal values from the vehicle and stores it onto a microSD card as a CSV file for later processing. The extraction of these raw CAN-bus messages occurs using the OBD-II port inside the vehicle.
This project utilized a waveform generator, Arduino micro-controller, and MATLAB (R2019b) to generate, process, and store the CAN-data. The waveform generator acts as the vehicle for the purpose of this project. This process is highlighted in the diagram presented in Figure 24.
Figure 24: CAN-Bus Data-logging Process
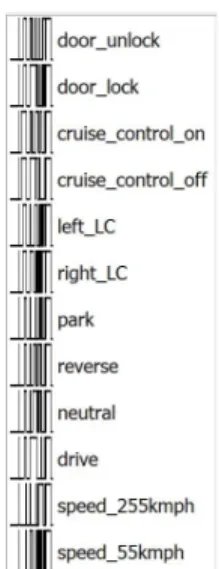
This project utilizes custom waveforms designed in WaveForms and implemented with an Analog Discovery 2 to emulate the functionality of the test vehicle. The waveforms implemented through the Analog Discovery are configured based on the standard CAN-bus frame specifications presented in the first section of this chapter. There are a total of 12 custom waveforms that are defined by the author and generated utilizing the Analog Discovery in the data-logging portion of this project. They are pictorially represented in Figure 25.
Figure 25: Analog Discovery List of Custom CAN-Bus Generated Waveforms
An example of one of these custom waveforms generated in WaveForms is presented in Figure 26. It demonstrates the unlocked door CAN-H signal that a vehicle would send through the OBD-II port. This waveform reflects the key configuration of the CAN-bus frame with the proper message ID and message data.
Each bit of the CAN-bus frame presented in Figure 26 has an 8 μs duration. This is due to the 125 kbps infotainment CAN-bus transmission speed. The waveform represents the CAN-H signal that would be sent to the OBD-II port with a 2.5V DC offset and 1V peak to peak amplitude. An inverse waveform representing the CAN-L signal would be sent in parallel with the CAN-H signal to complete the standard CAN-bus transmission protocol when extracting the CAN-bus data from the test vehicle. For demonstration purposes, only the CAN-H signal generated by the Analog Discovery will be analyzed and processed in the following procedure.
This waveform enters the Arduino micro-controller from the Analog Discovery through the analog pins for further processing. The Arduino samples the incoming waveform at a sampling frequency of 307 kHz in order to store the waveform voltage values. A serial plot of the sampled waveform is shown in Figure 27. The data is plotted with a “last-in first-out” approach which results in a left/right flipped waveform compared to that of Figure 26.
Figure 27: Arduino Serial Plot Unlock Door State CAN-H Signal
The Arduino micro-controller samples the Analog Discovery voltages using the analog pins in ADC free-running mode. This is configured by setting the prescaler values to adjust the sampling frequency as shown in the related Arduino C-code in Appendix C. This process allows the Arduino to read voltages from the analog pins through interrupts which results in a much faster sampling rate compared to the standard serial sampling rate commonly used with the “analogRead()” function. This results in a more accurate data set that is next processed using MATLAB.
The logged voltage values derived from the Arduino analog pins and saved as a CSV file onto the CAN-bus shield’s microSD are uploaded into MATLAB where they are scaled and reverted into binary values. As demonstrated in the MATLAB code in Appendix C, the binary values of the CAN-bus frame are translated into hexadecimal and appended to a CSV file.
The raw hexadecimal values of the CAN-bus are commonly used by infotainment test engineers when accessing the accuracy of the infotainment configuration. The infotainment test engineer compares the raw CAN-bus messages of previous infotainment software versions in order to ensure that the proper changes have been made to the infotainment screens. Typical data-loggers require an ethernet connection from the test vehicle to the infotainment test engineers computer when logging. By creating this data-logging procedure, this project allows the infotainment test engineer to readily store the CAN-bus messages offline onto a microSD card.
CHAPTER 7 - EXTENSION AND FUTURE WORK
This chapter addresses certain limitations related to the development of this project and serves as a guide to future development. It considers possible real-world applications and is designed to promote further work in the infotainment testing field.
CAN-Bus DBC
One of the greatest limitations of this project relates to the inaccessibility of CAN-bus database container (DBC) files which contain the CAN-bus message configurations for specific vehicles. These files contain non-disclosed information relating to the individual CAN-bus messages on board a vehicle. There are a select few CAN-bus messages that are standard and accessible to the public via commonly used OBD-II vehicle readers that allow the user to read engine-related CAN-bus messages. However, these readers do not address all CAN-bus messages present in a vehicle for security and privacy reasons relating to the vehicle, the driver, and the automotive company’s intellectual property.
In the infotainment testing environment, only employees working on CAN-bus related infotainment systems have access to the DBC files and the content relating to the bit-specific CAN-bus configuration of the vehicle. This data is only accessed following a non-disclosure agreement between the car company and the employee and can only be accessed for the duration of employment.
Due to these restrictions, this project utilizes custom CAN-bus messages generated from scratch rather than in relation to a specific DBC file. As addressed in Chapter 6, the signals simulated and logged throughout this project do not directly relate to any specific vehicle but can be easily configured to meet the guidelines of an automotive company, if requested. Accessing the CAN-bus DBC file would allow the user to simulate CAN-bus messages specific to a particular vehicle model. Similarly, having access to the DBC file would streamline the data-logging procedure when processing raw hexadecimal data. CAN-bus messages can easily be matched with the relative source ECU and decoded based on the bit-by-bit breakdown of the CAN-bus message within the DBC file.
Accessing the DBC file would allow for the extension of this project's simulation and data-logging
capabilities. Future versions can be extended to simulate more than the 5 dedicated signals presented in this project as well as assess more than the 12 data-logging signals generated. With access to the DBC file, this project is readily implementable into the infotainment testing environment and can be used to address the
Vehicle Application
The data-logger portion of the project is developed using a customized waveform generator rather than an actual vehicle. One possible extension of this project would be to develop direct vehicle communication.
Accessing CAN-bus messages from the OBD-II port of a vehicle can be achieved by establishing a direct handshake between the CAN-bus shield and the vehicle in order to establish communication between the vehicle and data-logger. The handshake consists of a bidirectional message exchange in which the CAN-bus shield transmits a specific message onto the OBD-II port to request CAN-bus access from the vehicle. Upon receiving this request, the vehicle sends a confirmation message indicating it is ready to transmit a CAN-bus message to the CAN-bus shield.
A simplified approach would entail the use of two CAN-bus shields and two Arduino micro-controllers for ease of trouble-shooting and problem solving. This configuration, shown in Figure 28, would allow one CAN-bus shield and Arudino pair to act as a CAN-bus simulator and the other to act as the CAN-bus data-logger.
Figure 28: CAN-Bus Simulator and Data-logger Configuration
Preliminary results suggest that this configuration would provide the benefit of simultaneously
trouble-shooting the CAN-bus simulator and data-logger. A suggested hardware set-up is demonstrated in Figure 29. This particular set-up utilizes the SparkFun CAN-bus shield on the data-logger end and the Seeed CAN-bus shield on the simulator end; however, this is only one possible approach [16]. This approach would allow the experimenter to develop a greater understanding of the CAN-bus protocol thus enabling the possibility of direct extension to the vehicle’s OBD-II port for data-logging in application.
Figure 29: Suggested CAN-Bus Simulator and Data-logger Hardware Set-up
In the hardware set-up presented in Figure 29, CAN-bus messages are transmitted from the Seeed CAN-bus shield (black) via the DB-9 port and enter the SparkFun CAN-bus shield (red) through the direct CAN-H and CAN-L pins. The red wire is CAN-H and the green wire is CAN-L in this set-up. Another approach would consist of directly connecting the CAN-H and CAN-L pins between each shield.
Future work can then be extended to utilize the vehicle’s direct CAN-bus pins present on the OBD-II port. This enables the experimenter to access raw CAN-bus data from the vehicle using the handshake method explained previously. This can later be processed via the provided MATLAB data-logger code in Appendix C in order to store CAN-bus data onto a CSV.
CHAPTER 8 - CONCLUSION
The culmination of this project consists of a CAN-bus simulator and data-logger that are configurable to adhere to vehicle specific CAN-bus messages in later application. This project addresses two main problems presented in the infotainment testing industry:
The first solution relates to the CAN-bus simulator. This project develops a streamlined process for infotainment testing through CAN-bus simulation thus minimizing the need to test in the vehicle and reducing the completion time of each test case. Providing relevant signals like speed and transmission states allows the user to easily configure test scenarios onto the infotainment workbench and
optimizes the testing time and reliability.
The data-logger aspect of this project enables the user to easily log and store raw hexadecimal CAN-bus message data onto a CSV file. This raw CAN-bus data is stored offline and provides the user with a reliable storage system for later data processing. Storing vehicle data onto a microSD card minimizes the trouble-shooting time related to commonly-used ethernet-driven CAN-bus
data-loggers on the market today.
In application, this project has the potential to increase productivity in infotainment testing environments and greatly assist the test engineer in successful completion of their infotainment testing procedure.
REFERENCES
[1] “CAN in Automation (CiA),” CAN in Automation (CiA): CAN data link layers in some detail. [Online]. Available: https://www.can-cia.org/can-knowledge/can/can-data-link-layers/.
[2] R. Bosch, Bosch Automotive Handbook, 7th ed. Plochingen, DE: Wiley, 2007, pp. 1086-1103.
[3] C. Smith, The Car Hacker’s Handbook: A Guide for the Penetration Tester. San Francisco: William Pollock, 2016.
[4] R. Bosch, CAN Specification, Version 2.0. Stuttgart, DE: Robert Bosch GmbH, 1991.
[5] A. Winning, “Number of Automotive ECUs Continues to Rise,” eeNews Automotive, 16-May-2019. [Online]. Available:
https://www.eenewsautomotive.com/news/number-automotive-ecus-continues-rise.
[6] Volkswagen Ag, Wolfsburg, Germany, Data exchange on the CAN-bus I basic. VAG SSP 238, 2001.
Order number: 140.2810.57.20.
[7] Autoweek, “Gallery: 2019 Audi A6 interior,” Autoweek, 09-Apr-2019. [Online]. Available: https://www.autoweek.com/drives/g2132126/gallery-2019-audi-a6-interior/.
[8] J. Schmidt and T. Weidenhiller, “digital workbench gmbh,” digital workbench gmbh, 2018. [Online]. Available: http://digital-workbench.de/.
[9] “Audi A6 (2001),” NetCarShow.com. [Online]. Available: https://www.netcarshow.com/audi/2001-a6/. [10] “Testing ECUs and Networks with CANoe,” Vector. [Online]. Available:
https://www.vector.com/int/en/products/products-a-z/software/canoe/#c3778. [11] “blue PiraT Mini,” Telemotive AG. [Online]. Available:
https://www.telemotive.de/en/products/hardware/blue-pirat-mini/.
[12] R. and Markets, “$980M In-Vehicle Computer System Market by Application, Offering, Vehicle Type, Memory Size and Region - Forecast to 2025,” GlobeNewswire Research and Markets, 09-Apr-2020. [Online]. Available:
https://www.globenewswire.com/news-release/2020/04/09/2014496/0/en/980M-In-Vehicle-Com puter-System-Market-by-Application-Offering-Vehicle-Type-Memory-Size-and-Region-Forecast-to-2 025.html.
[13] “Arduino Leonardo with Headers,” Arduino Official Store. [Online]. Available: https://store.arduino.cc/usa/leonardo.
[15] “CAN-BUS Shield V2 adopts MCP2515 and MCP2551,” Seeed Studio, 26-Aug-2019. [Online]. Available: https://www.seeedstudio.com/CAN-BUS-Shield-V2.html.
[16] “CAN-BUS Shield Hookup Guide,” SparkFun. [Online]. Available:
https://learn.sparkfun.com/tutorials/can-bus-shield-hookup-guide?_ga=2.245107269.1185111686.1 590778730-1850916800.1537808262.
[17] P. Pimple, “Sniffing the Automotive CAN-bus for Real-time Data-logging and Real Time Diagnostics Display,” ICSEDPS International Conference: 2018 International Conference on Smart Electric Drives & Power
Systems: Proceedings: 12-13 June, G.H. Raisoni College of Engineering, Nagpur, 2018, pp. 167-170.
[18] R. Bosch GmbH, “Communication system having a CAN-bus and a method for operating such a communication system,” US Patent 8 819 327 B2, August 26, 2014.
[19] Y. Vershinin, B. Nnadiekwe, S. Schulz, “Simulation of Signal Transmission in Motion Simulator Using
Controller Area Network (CAN-bus),” Intelligent Transportation Systems (ITSC), 2015 IEEE 18th
International Conference, 2015, pp. 2688-2693.
[20] C. Mueller, J. Daily, M. Papa “Assessing the accuracy of vehicle event data based on CAN messages,”
SAE Technical Paper Series, April 16, 2012.
[21] S. Kang, J. Seong and M. Lee, "Controller Area Network With Flexible Data Rate Transmitter Design
With Low Electromagnetic Emission," in IEEE Transactions on Vehicular Technology, vol. 67, no. 8, pp.
7290-7298, Aug. 2018. doi: 10.1109/TVT.2018.2832659
[22] Y. Liu, X. Zhu, H. Zhang and M. Basin, "Improved Robust Speed Tracking Controller Design for an Integrated Motor-Transmission Powertrain System Over Controller Area Network," in
IEEE/ASME Transactions on Mechatronics, vol. 23, no. 3, pp. 1404-1414, June 2018. doi: 10.1109/TMECH.2018.2812170
APPENDIX A - SENIOR PROJECT DESIGN ANALYSIS
Summary of Functional Requirements
The scope of this project focuses on a select few simulated CAN-bus messages: speed, transmission status, etc. Additionally, it utilizes MATLAB to emulate the data-logging process. The project cumulatively provides the tester with the ability to simulate and log CAN-bus messages. The system has the ability to output vital signals onto the infotainment workbench and additionally act as a data-logger to store the changing CAN-bus messages sourced from the infotainment workbench and vehicle.
Primary Constraints
The main challenge relating to this project is the inaccessibility of the CAN database for each vehicle. CAN databases are kept private in DBC files by each automotive company due to security reasons and in order to limit data acquisition by competitors. Due to this inaccessibility, this project simulates CAN-bus messages based on an abstract CAN database consisting of 5 specific signals. On the receiving end, this project is unable to deduce the specific CAN-bus message obtained from the simulated vehicle using an Analog Discovery waveform generator. With MATLAB, the CAN-bus message can be reduced to a raw hexadecimal value but there is no way of knowing exact vehicle data contents without the manufacturer's CAN database. However, when implemented in the testing environment, the tester has access to the CAN-bus DBC files and reads the exact messages necessary from the vehicle using the system developed within this project.
Economic
This system enables more testers to test infotainment software at a faster rate with less need for external devices. This results in a growth in completed test cases and less time spent on each test case.
The configured device is significantly less expensive than other comparable devices on the market. It requires less space, less power to function, and costs roughly 1/10th the price of a comparable device. Having this tool would save the infotainment testing team money and thus result in greater overall yearly profit. The project requires an open source Arduino micro-controller and CAN-bus shield. These components are manufactured on a large scale and do not require any adjustments for the implementation of this project. The switches and dials used are also produced in massive quantities and are thus easily accessible and commonly implemented in control systems such as this. Putting the components together requires minimal labor and no specific tooling is needed aside from soldering equipment. The hardware input components are connected to the micro-controller and shield using simple connection wires.
As with any electronic device there is a certain amount of e-waste created at the end of the device’s lifetime. This project is designed to be implemented for the long term. It can be reconfigured to various cars and various software systems in order to obtain test results. Due to its versatility, this system will be used for numerous years. The typical lifecycle is expected to exceed 10 years since the device can be configured to the improving and growing complexity of the CAN-bus. Thus, there will not be a need to source new ICs and other components on a regular basis, resulting in less silicon extraction and manufacturing.
Costs and benefits accrue at the end of each project. When all test cases are met in a shorter time span than projects previous, the adjustment in time estimation will promote greater opportunity for future projects. In short, the testing period is shorter than anticipated which results in a satisfied customer and more positive feedback. Customers will be eager to work with a fast and resilient testing team who can deliver results in a timely and accurate manner.
The inputs required are user driven and controlled through five main hardware components connected to the micro-controller board. This project is intended to be acquired by vehicle infotainment testing teams seeking a faster and less expensive method to complete testing catalogs. The teams would be responsible for covering the costs in real world application. For the purpose of this project, however, the costs are covered by the Electrical Engineering Senior Project Fund. The total cost of developing this can be seen in Table III. The total sum includes labor and parts costs. No additional development costs are anticipated at this time. The development time is roughly 144 hours but once completed the implemented project will take less than five minutes to install and use.
If manufactured on a commercial basis
The estimated number of devices sold per year is anticipated to be 2000. This total accounts for the number of projected vehicle models being released in 2020 as well as the amount of infotainment testing centers present throughout the world for each car brand. Manufacturing would cost around $100.00 which accounts for costs of acquiring Arduino micro-controller boards and shields as well as hardware components in the project. This price can be lowered in the case of mass production in which the cost of individual parts is reduced when purchased in large quantities. The estimated purchase price for each device is $200 which is significantly less expensive than comparable devices. Through these estimations, it is anticipated that the yearly profit will be around $200,000.
Environmental
This project uses electricity sourced through various means depending on the location of the testing center. If connected to the vehicle, this device will be powered through the car’s 12V battery which is powered through the fuel in the vehicle. This use of gasoline to indirectly power the device has environmental impacts relating to carbon monoxide emissions and NOx emissions that are harmful to humans, animals and the air quality of the overall planet.
![Figure 4: 2019 Audi A6 In-Vehicle Infotainment System adopted from [7]](https://thumb-us.123doks.com/thumbv2/123dok_us/8219575.2179235/9.918.109.688.369.663/figure-audi-in-vehicle-infotainment-system-adopted-from.webp)