The
OHIO
Journal of
Teacher Education
The
OHIO
Journal of
Teacher Education
SPRING 2016 .VOLUME 30 . NUMBER 1
PUBLISHED BY THE OHIO ASSOCIATION OF TEACHER EDUCATORS
Dr. D. Mark Meyers, Xavier University
Dr. Jean F. Eagle, Miami University
Message from the Editors 1
Editorial Board 3
A Call for Editorial Board Membership 4
ARTICLES
Co-Teaching in Teacher Preparation: Where Everyone is a Learner 5
Gail Saunders-Smith, Ph.D., Youngstown State University Terri L. Duncko, Ph.D., Youngstown State University
Re-Examining Progress Monitoring: Are We Reporting What We Think We Are? 13
Kathleen G. Winterman, Ed.D, Xavier University Clarissa Rosas, Ph.D., Mount St. Joseph University
Shifting the Paradigm of Identity in Students Who are 35
Deaf or Hard of Hearing in General Education
Megan Reister PhD, Franciscan University of Steubenville
Fostering Leadership in Early Childhood Teacher Candidates:
Case Studies from Three Ohio Universities 55
Pam Owen Ed.D, Mount Vernon Nazarene University Mary Barbara Trube, Ed.D, Ohio University, Chillicothe Krishana White, Ph.D., Mount Vernon Nazarene University Laurie Katz, Ph.D., The Ohio State University
Teaching Reading is a Passion: A Passion with Impact 69
Sally Barnhart, M.Ed, Xavier University Rita Bitzer, M.Ed.,
Publication and Manuscript Guidelines 81
Important Dates of Note 82
A MESSAGE FROM THE EDITORS
Welcome from the The OHIO Journal of Teacher Education Editorial Team. We are honored and privileged to shepherd this journal for the educational community of Ohio
The OHIO Journal of Teacher Education (OJTE) is an online journal We invite all forms of article formats, as seen in the publication and manuscript guidelines included inside the journal. However, we do invite authors to utilize the online format. The use of links and other interactive devices will allow the online journal to be more than simply a pdf of articles that you can print at your own
workstation. In the future, the hope of the editorial team is to develop a truly functional online journal experience which can open the world of practice to our readership.
We will strive to build upon the solid foundation left by the previous editorial teams and move the OHIO Journal of Teacher Education forward as a resource for pre-service teachers, in-service teachers, and all with an interest in teacher education.
EDITORIAL BOARD
Michele Beery, Ph.D.
Wilmington College
Cynthia Bertelsen, Ph.D.
Bowling Green State University
Sue Corbin, Ph.D.
Notre Dame
College of Ohio
Joy Cowdery, Ph.D.
Muskingum University
Todd Hawley, Ph. D.
Kent State University
Stacey Pistorova, Ph.D.
Heidelberg University
Carol Ramsay, Ed. D.
Lake Erie College
Linda Ingling Rogness, Ph.D.
Muskingum University
Marlissa Stauffer, Ph.D.
Ohio Dominican University
Nicole Williams, Ph. D.
University of
A CALL FOR EDITORIAL BOARD
MEMBERSHIP
The Ohio Journal of Teacher Education (OJTE) is looking for interested individuals to join the Editorial Board of the journal. We are looking to establish a board that represents the Colleges and Universities of Ohio as well as offers a broad spectrum of
content expertise.
If interested, please submit a one page letter of intent that includes your College or University, your educational background, and your content area of interest
to the co-editors.
Dr. Mark Meyers and Dr. Jean Eagle at [email protected]
OJTE – SPRING 2016
TOPIC HERE
Co-Teaching in Teacher Preparation: Where Everyone is a Learner
Gail Saunders-Smith, Ph.D. and Terri L. Duncko, Ph.D. .
* Correspondence: Gail Saunders-Smith, Ph.D. Associate Professor
Youngstown State University Beeghly College of Education Teacher Education
Department One University Plaza Youngstown, Ohio 44555 [email protected] 330-941-1353
Full list of author
information is available at the end of the article
Abstract:
A light-hearted look at an example of practicing what one teaches is addressed in this article. One model of co-teaching with two faculty members is described in terms of need, execution, preparation, reflection, and student perception. Rooted in the research, the article examines what the co-teachers learned about teaching, content, students, each other, and themselves.
Pregnancy provides so many opportunities in so many ways! When an early childhood colleague began her maternity leave mid-semester, her courses were passed on to other colleagues to complete the semester. The mother-to-be was extremely organized and provided ample, detailed plans, resources, assessments, rubrics, and suggestions for those who would step in for her. Areas of expertise, availability, work load, and interest were
considerations when placing faculty in her courses. Every effort was made to match up content experts with the courses that needed covered; and, for the most part, that happened. Until recently, co-teaching was not practiced in our department beyond the occasional stepping in for a colleague to provide a lecture on an aspect of particular interest or expertise. What follows is the story of Terri and Gail’s great, unintended, co-teaching adventure.
One of the courses needing coverage concerned the teaching of early childhood language arts content and pedagogy to teacher candidates
OJTE – SPRING 2016 As a former special education teacher, Terri was required to teach a variety of grade levels in all major content areas. It was thought that this broad experience would provide a strong foundation for taking over the early childhood course.
The students in this course met on campus twice each week for 1.5 hours for the first eight weeks of the 15-week semester. During that time, the students also spent two days in the field at their placement sites observing and assisting. The teacher candidates spent the remaining weeks of the semester full-time at their placement sites. Day one of the on-campus classes involved lecture, hands-on applications, discussion, and typical content learning practices. In the second class meeting each week the students generally presented applications and demonstrations of what they had been learning. Terri was assigned to teach the on-campus classes and then to observe the candidates at their field placements. A few weeks into the semester, Terri and I agreed to share the delivery of the content on day one each week and then Terri would oversee the students’ applications on day two while I was working in a school on another project.
Co-Teaching in General
Most of us are familiar with the concept and models of co-teaching and its place in general and special education. However, the idea of co-teaching in higher education is less familiar. As Duchardt, Marlow, Inman, Christensen and Reeves (1999) point out, “Opportunities for co-panning and co-teaching are not inherent within the structure of higher education (p. 186).” When
opportunities for co-teaching do present themselves, however, good things can happen as we
witnessed. The model of co-teaching we used seemed to be a hybrid rather than an exact match with one of the traditional structures. For example, our students remained in one whole group which eliminated the parallel, station, and alternative teaching structures. Similarly, neither the one teach/one assist nor the team teaching models were used; which leaves the one teach/one observe
model. The nature of our interaction involved a variation on the information gathering aspect inherent in the one teach/one observe model. Rather than just gathering information about the students and their learning, our opportunity allowed for the gathering of knowledge specific to the layers of content.
OJTE – SPRING 2016
knowledgeable in literacy, Harris and Harvey (2000) remind us that our expectations for content delivery and responses to student engagement have been shaped by our own teaching/learning experiences and academic backgrounds. Silero (2011) reiterates this idea by pointing out that “Co-teachers come together with dissimilar personal and professional values… (p. 34).” Literacy, like all learning, is developmental so the delivery of the course content by two instructors representing literacy learning at two developmental places along the literacy continuum – early and middle childhood – provided a unique opportunity for the students to hear the content from both
perspectives. We were able to position the knowledge and skills in ways that provided our teacher candidates relevant illustrations of the need to differentiate instructional practices for the multiple stages of development they will find in their classrooms.
Additionally, because the students were already in the field two days a week, course content was often correlated to those field experiences, thus providing a deeper relevance to authentic learning.
Our Experience
Silero (2011) shares the resemblance of co-teaching to a professional marriage that was first offered by Scruggs, Mastropieri and McDuffie (2007). Using this analogy, she describes the process of developing a co-teaching relationship between the partners and the need for collaboration,
flexibility, and compromise – similar to the steps of courtship, engagement, and eventual marriage. Ours was more of an arranged marriage built by circumstance; almost a marriage of convenience between friends.
The need for planning in co-teaching experiences is well documented (Volger and Long, 2003; Sileo, 2011; Duchart, et. al., 1999; Zapf, et. al., 2011). Communication is essential to any relationship, especially when co-constructing events designed to change cognitive behavior as in any effective teaching/learning situation. Our colleague had provided us with explicit plans for what, when, and how to teach the content and applications; all we needed to do was determine who would do what. What developed became much more, however.
OJTE – SPRING 2016 allow for the deconstruction of instructional events which can lend a reflective dimension to the teaching-learning dynamic, and that is what Terri and I experienced. Certainly, we talked about individual students and aspects of their discrete learning and interactions with classmates, but it was the discussion of content that was an unexpected benefit.
Terri’s practical experience with middle and secondary grade students lent a firsthand dimension to the content that I had not experienced. While I had the ‘book-learning’ knowledge of literacy development in adolescent and young adult learners, I had limited involvement with learners of this age. Terri’s perspective on literacy development beyond the early years enriched and
expanded my knowledge base and the same was true for Terri. Her reflections of our early childhood literacy conversations revealed an excitement and growing awareness for the literacy needs of young children and how those skills developed over time. It proved to be a perfect partnership.
Another facet of increased learning for us was the sharing of resources. While our colleague had provided ample resources, Terri and I also used materials and exemplars with which we were familiar. For example, a content segment addressed visual literacy. Both Terri and I have extensive personal collections of children’s literature, so each of us brought books that provided examples of the various elements of visual literacy. Another example involved having our teacher candidates examine the writing development of young children. I was able to provide authentic writing
examples from children at different stages of development that I had collected over the years. Using my own pool of samples was a benefit since I was familiar with them and could easily guide the students’ examination. In addition, Terri and I shared the use of videos and websites with which we were familiar to illustrate concepts and procedures.
Our experience mirrors what Zapf, et. al. (2011) and Duchardt, et. al., (1999) report to be true. We realized the ‘hidden rewards’ of learning from each other with regard to content, being able to respond to each other’s materials and examples, and challenging our own understanding, all of which helped us develop as teachers and professionals (Zapf, et. al., 2011, p. 49). Examples of the rewards offered by Zapf and his colleagues were the same for us. Terri and I shared the scoring of the midterm, learning about each other’s grading practices and priorities. We also learned about each other’s teaching styles, techniques, and strategies. And, like with Zapf’s colleagues, an
OJTE – SPRING 2016
understandings on both parts was similar to enriched personal and practical professional development for us.
Our Students’ Experience
The experience was personally and professionally enriching for both of us, but what about for our students? Volger and Long (2003) point out the importance of “us[ing] each other’s
strengths, insights, and experiences to create lessons and activities that not only define and develop important points and ideas, but also maintain a high level of student interest (p. 123).” Our students seemed to appreciate the different voices that guided their learning.
The students saw immediately the benefits of having two professors instruct the course and expressed this several times throughout the semester. Because of our easy collaborative relationship the students could see a give and take of content delivery that was sprinkled with characteristics of each of our personalities. Since the students were already in the field, they came to class with specific questions regarding student development, strategy instruction and behavior management techniques. Terri’s special education background and my early childhood experience provided the students with the depth of knowledge needed to respond to classroom concerns.
What’s Next
While our co-teaching experience was relatively short and certainly informal, it
unquestionably helped us as instructors and we realize the potential gains for our teacher candidates. The benefits were so great that Terri and I would like to see this model expand to other courses. However, change is never easy and in light of the bureaucratic maze, long-held educational
traditions, the beast known as scheduling, and the thousand other known and unknown obstacles that thwart modifications in higher education, we don’t anticipate moving quickly into the co-teaching realm.
Nevertheless, we feel that a version or aspects of the experience can be tried. Because Terri and I learned so much about the content, resources, strategies, and so on, perhaps the same can happen outside of a co-teaching experience. For example, our literacy faculty have been working to revise the content, assignments, assessments, resources, and rubrics of the reading courses. Informal sharing of these revisions have taken place during the monthly literacy committee meetings.
OJTE – SPRING 2016 In the past, learning communities that address particular concepts have been formed and found to be successful. Perhaps a learning community can be established to formally share the revisions; or, in the spirit of co-teaching, instructors can bring their own expertise into one another’s classrooms. One element already in place is a site on the department website where electronic versions of resources are stored in files by course. Faculty are encouraged to place items there that they are willing to share with others teaching the course.
OJTE – SPRING 2016
References
Crow, J. & Smith, L. (2005). Co-teaching in higher education:Reflective conversation on shared experience as continued professional development for lecturers and helath and social care students. Reflective Practice: International and Multidisciplinary Persepectives., 6 (4), 491-506.
Duchardt, B., Marlow, L., Inman, D., Christensen, P., & Reeves, M. (1999, January/February). Collaboration and co-teaching: General and special education faculty. The Clearing House, 72(3), 186-190.
Harris, C. & Harvey, A. N. C. (2000). Team Teaching in Adult HIhger Edufation Classrooms: Toward Collaborative Knowledge COnstruction. New Directions for Adult and Continuing Education, Fall (87), 25-32.
Scruggs, T. E. (2007). Co-Teaching in inclusive classrooms: A metasynthesis of qualitative research. Exceptional Children, 47, 392-416.
Silero, J. M. (2011). Co-Teaching: Getting to Know Your Partner. Council for Exceptional Children, 43 (5), 32-38.
Volger, K. E. & Long, E. (2003). Team Teaching Two Sections of the Same Undergraduate Course: A Case Study. College Teaching, 51 (4), 122-126.
OJTE – SPRING 2016
About the Authors:
Gail Saunders-Smith, Ph.D. Associate Professor
Youngstown State University Beeghly College of Education Teacher Education Department One University Plaza
Youngstown, Ohio 44555
[email protected] 330-941-1353 w
Terri L. Duncko, Ph.D. Assistant Professor
Youngstown State University Beeghly College of Education Teacher Education Department One University Plaza
Youngstown, Ohio 44555
330-941-1320 w
Gail Saunders-Smith teaches undergraduate and graduate reading courses in the early and middle childhood programs at YSU where she is coordinator of the literacy program. Her research interests include early literacy development, teacher-learner discourse, and the design and implementation of professional development.
OJTE – SPRING 2016
TOPIC HERE
Re-Examining Progress Monitoring:
Are We Reporting What We Think We Are?
Kathleen G. Winterman, Ed.D. and Clarissa Rosas, Ph.D. .
* Correspondence: Kathleen Winterman. Xavier University School of Education 3800 Victory Parkway Cincinnati, Ohio 45207
Full list of author
information is available at the end of the article
Abstract:
Legislation mandates that special education service providers report their students with disabilities progress in attaining IEP goals on a regular basis. These reports are referred to as progress monitoring. Progress monitoring is considered an evidence based practice that requires frequent, systematic, and consistent assessments to directly measure both the student’s growth in meeting IEP goals and the teaching practices employed to address the skills delineated in the IEP. This study investigated the practice of progress monitoring in a Midwestern
suburban public school district. Findings from this study suggest that progress reports lack effective communication as to the advancement of students’ goal attainment and adjustments made to instruction, as it pertains to growth toward the IEP goal, was not evident.
Historically, a pattern of marginalization, denial of services, and discrimination of children with disabilities has plagued the educational school system. In 1975 Congress took action to address this unacceptable pattern by passing the first national special education law, PL 94-142. This initial special education law included two essential principles which
continue to be critical to the services extended to children with disabilities: free appropriate public education (FAPE) in the least restricted environment (LRE) possible. This national legislation, PL 94-142, has been reauthorized in subsequent years, each time strengthening access to general education for students with special needs and holding schools more accountable for the progress of these children. The plan for providing services and access to general education is referred to as the Individualized Education Program (IEP). This document serves as the foundation of the student’s free
OJTE – SPRING 2016 Literature Review
The No Child Left Behind Legislation of 2001 (NCLB 2001) combined with the 2004
reauthorization of the special education law, known as Individuals with Disabilities Education
Improvement Act (IDEA 2004), strengthened the school’s responsibility to account for the
effectiveness of the services and instruction they deliver to attain the IEP goals. This emphasis on
accountability of outcomes of services and instruction was driven by the historical poor educational
results reported for students with disabilities. To address these poor results, IDEA 2004 mandates
that educational teams not only identify goals that focus on the individual needs of a child with
disability, but to specify how the child’s progress in attaining those goals will be measured and
communicated to parents. As noted in the federal regulation below, the IEP must detail how the
child’s progress toward meeting the IEP goal will be communicated.
Regulations: Part 300 / D / 300.320 / a
(3) A description of--
(i) How the child's progress toward meeting the annual goals described in paragraph (2) of this section will be measured; and
(ii) When periodic reports on the progress the child is making toward meeting the annual goals (such as through the use of quarterly or other periodic reports, concurrent with the issuance of report cards) will be provided;
(4) A statement of the special education and related services and supplementary aids and services, based on peer-reviewed research to the extent practicable, to be provided to the child, or on behalf of the child, and a statement of the program modifications or supports for school personnel that will be provided to enable the child--
The purpose of this directive is not only to assure that students make sufficient gains toward their
IEP goals, but to keep teachers and parents consistently informed about their student’s progress in
meeting IEP goals prior to any IEP meeting. Hence, this type of progress monitoring requires
frequent, systematic, and consistent assessments be in place to directly measure both the student’s
OJTE – SPRING 2016
the IEP goals. This practice of progress monitoring is considered an evidence-based practice which
results in increased student learning outcomes and effective teacher decision-making (Deno, 2003;
Fuchs, Good & Jefferson, 1998; Deno, & Mirkin, 1984). In addition, research supports that
progress monitoring is one of the major factors that differentiate effective from ineffective
instruction (Espin, Wallace, Lembke, Campbell, & Long, 2010).
Despite the research which supports progress monitoring as an evidence-based practice and
legislation that safeguards positive outcomes for students with disabilities, students with disabilities
continue to lag behind their non-disabled peers (U.S. Department of Education’s National Center
for Education Statistics, 2014; Goodman, Hazelkorn, Bucholz, Duffy, & Kitta, 2011). The U.S.
National Assessment of Educational Progress (2014) indicates that not only are the majority of
students with disabilities not meeting state proficiencies, but the large achievement gaps between
students with and without disabilities remains. The U.S. National Center on Educational Outcomes
(2014) indicates that a sustained division between the performance of children with disabilities and
those without a disability exists in the area of mathematics and reading persists. As students with
disabilities reach middle and high school, the gap widens. While legislation requires that only
research based strategies be used when teaching children with disabilities, it is important to match
those strategies with the unique needs of the student. Therefore, teachers must be continually
informed about the effectiveness of their instructional practices and its’ effect in achieving the
required growth necessary to attain IEP goals. Roach, Chilungu, La Salle, Talapatra, & Vignieri,
(2009) state in order for IEPs to serve as the primary means of facilitating curricular access and to
improve student academic outcomes for students with disabilities, educational systems need to
provide professional development and increased IEP quality monitoring to ensure that the goals
OJTE – SPRING 2016 The Special Education Resource for General Education (SERGE, 2014) states that monitoring
students’ progress is a shared responsibility among educational team members to determine
acquisition of IEP goals and objectives. Gathering this data is a critical responsibility and requires
that information is collected by multiple team members such as general educators, related service
personnel, fine arts teachers, as well as the special educator. However, in practice, the special
education teacher’s role is to coordinate the collection and monitoring of students’ progress (ODE,
2015).
The purpose of this descriptive pilot case study was to investigate the status of Progress Reports
and special education service providers’ perceptions of the reports they prepared to keep parents
informed about their child’s growth and progress towards meeting IEP goals and objectives.
Methods
A convenient sample Midwest suburban public school district agreed to participate in the
study. At a May, 2015, Special Services meeting lead by the district leadership team, special
education service providers discussed the IEP Progress Reports that are provided to parents and were
told that this would be an area of focus for the upcoming academic year. Faculty members were
asked if they would like to participate in a study that would provide the district with baseline
information that would prompt their discussion during the following school year. Seventeen staff
members agreed to participate in the study and completed the Teacher’s Progress Reporting Survey.
Using the Progress Monitoring Report that the participants prepared, they completed surveys and the
Progress Monitoring Reporting with all students personal identification information was redacted.
Then the information was submitted anonymously in an envelope which was kept at the district’s
Special Services Office. Teachers also completed a Teacher IEP Survey questionnaire which was
OJTE – SPRING 2016
experience, and familiarity with the IEP process. This was also tendered anonymously in an
envelope in the district’s Special Services Office.
Instrumentation
In order to determine the status of the Progress Monitoring Reports and special service
providers’ perceptions of their reports a survey was developed. Survey was developed by the
researchers as a result of their extensive review of IDEA 2004, experience in teacher preparation,
and professional development for current teachers. A sample Survey was reviewed by experienced
educators in the field of administration which resulted in minor edits to the Survey. The Survey
consisted of three sections: The first section contained five demographic questions that described
the student for whom the IEP progress monitoring report was written. The second section of the
Survey comprised of twelve elements directly related to key areas in the progress report in which the
participants selected a response that best described the particular element reviewed. The third
section of the Survey involved word pairs that each participant was asked to rank using a seven-point
Likert-type scale that best described their perceptions toward the progress report that they prepared
for parents.
Results
The purpose of this descriptive pilot study was to investigate the status of progress reports
and special education providers’ perceptions of the reports that they prepared to keep parents
informed about their child’s growth in meeting IEP goals and objectives. Descriptive statistics were
used to analyze the data obtained from the special education service provider participants’ responses
to the researchers’ survey in order to summarize the status of progress reports and to present possible
OJTE – SPRING 2016 sections: participants; setting; students’ demographics; key elements of the progress reports; and the
participants’ beliefs about the progress reports that they prepared for parents.
Participants
Participants in this study consisted of 14 teachers and three related services personnel whom
taught students with special educational needs in an inclusive suburban school district in Ohio.
Participants were assured that the data collected would remain anonymous and confidential. The
demographic section of the Survey revealed that there was one related services respondent in each of
the following areas: speech and language pathology, occupational therapy, and physical therapy.
The fourteen teacher respondents held special education licensure in the State of Ohio. Of the
participants, 82 % (n=14) had ten or more years of experience; 11% (n=2) had seven-to-nine years
of experience; and 5% (n=1) had less than three years of experience. For the purposes of this study,
all respondents to this survey are referred to as special education service providers.
Setting
A convenient Midwest suburban school district agreed to participate in the study. The
participating school district serves 1,725 students in grades PreK-12. The ethnic population of the
student body includes Asian (7.6%), African American (3.6%), Caucasian (82.3%), and Multiracial
(4.1%) students. Students that are economically disadvantaged represent 5.8% of the population and
students with disabilities comprise 8% of the population. As reported on the State’s Department of
Education’s website, this district has been rated as “Excellent” for the past 15 years (ODE, 2015).
Table 1 reports the district’s performance index and indicators met from the 2013-2014 academic
year (ODE, 2015).
The State report card depicts an overall “A” rating of students’ attainment of reading and math skills
OJTE – SPRING 2016
be deceiving (See Table 2). When comparing the gifted student population with the students with
disabilities, the gifted students’ growth gain is greater than the growth standard by at least 2 standard
errors. However, the students’ with disabilities gain is at most 1 standard error below the growth
standard but less than 1 standard error above it. Table 2 illustrates the district’s accountability
regarding students’ attainment of reading and math skills of various student subgroups as well as
value added information.
Students’ Demographics
Special education service provider participants (n=17) were asked to select and review three
recent progress report that they prepared and provided to the parents of one of their students. As a
result, 51 progress reports were independently reviewed by the participants and the researchers.
While the participants were encouraged to complete all sections of the survey; not all participants
completed the entire survey which resulted in a slight disparity inthe sample size per survey
question. According to the participants, the gender of the students’ progress reports reviewed were
73% male (n = 35) and 27% female (n =13). In addition, the participants identified that 78.7% of
the progress reports were from white (n=37) and 21.3% were from non-white student (n =10)
populations. Figure 1 presents students’ ethnicity of the progress reports reviewed.
Figure 1
Student’s Ethnicity by Percentage
Response Rate = 92.15%
0 20 40 60 80 100
Asian or PaciTic
OJTE – SPRING 2016 Results of the survey further revealed that 38.7% (n =19) of the progress reports were from
children in early childhood programs (grades Pre-k through 3rd grade); 36.8 % (n = 18) were from
middle school programs (grades 4th through 8th grade); and 24.5% (n =12) were from high school
programs (grades 9th through 11th). Table 3 presents students’ grade level of the progress reports
reviewed.
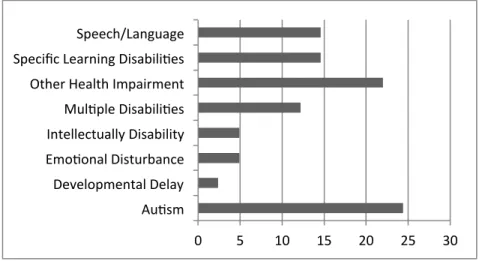
Results of the survey revealed that the progress reports were more frequently from students
categorized as Autistic (24.4%) or Other Health Impaired (22.0%) and less frequently categorized as
developmentally delayed (2.4%), emotional disturbance (4.9%) and intellectually disabled (4.9%).
Figure 2 presents students’ exceptionality as reported by the special services provider participants.
The survey further revealed that the mean years of experience that special education services
providers had was 5.6 (SD = 3.10) for those whose progress reports were reviewed for this study.
Figure 2
Students’ Exceptionality by Percentage
Response Rate = 80.39%
Au#sm Developmental Delay Emo#onal Disturbance Intellectually Disability Mul#ple Disabili#es Other Health Impairment Specific Learning Disabili#es Speech/Language
OJTE – SPRING 2016
Key Elements of Progress Reports
The participating district used a state’s IEP Progress Reporting Form (2010) which was
designed to provide parents with an account of their child’s progress toward meeting IEP goals and
objectives. This form included a space for the special education service providers to insert
demographic information such as the student’s name, identification number, grade level, homeroom
teacher’ s name, special education teacher’s name, related service provider’s name and building
name. In addition, the form included a space for the teacher to insert the child’s annual goal, goal
number, area and objectives/benchmark. The form utilized a short written response assessment
format whereby teachers were requested to briefly report on the student’s progress toward meeting
IEP’s objectives or benchmarks. A comments section was also provided on the form which allowed
for a “summary of the measurable data utilized to assess progress and a description of child’s
progress toward meeting the goal in measurable terms” (IEP Progress Report Form, 2010).
For the purpose of this study, special education service provider participants were asked to
select and review three progress reports that they recently sent to their students’ parents and to
complete the survey. The participants were asked to submit both the progress reports reviewed and
the completed survey to the researchers. All identifiable information was redacted from the progress
report by the participant prior to submitting the reports to the researchers in order to protect the
identity of the students, parents, and all special education service providers.
Progress toward goal. Participants were asked if the progress reports reviewed indicated
that the student made progress toward all, some or none of their IEP goal(s). Results of the survey
indicated that all of the progress reports (N = 51) reviewed by the participants made progress toward
meeting some to all of their IEP goal(s). Table 4 presents IEP growth toward meeting goals as
OJTE – SPRING 2016 In addition to identifying growth toward the IEP’s goal(s), the participants were asked to
identify if the progress reports specified if any IEP goal(s) were met or not met. Participants
identified 84% (n = 37) of the reports reviewed indicated that the students met some to all of their
IEP goals whereas 16% (n=7) indicated that IEP goals were not met. Table 5 presents IEP goals met
as reported by the participants.
Data to support progress. Participants were asked to identify the types of data reported in
the progress report to support their evaluation of the student’s progress toward meeting IEP goal(s).
Results of the survey unveiled that 75.6% (n =31) of the special education service provider
participants used narratives and 61% (n =25) used percentages to substantiate their students’
progress toward meeting IEP goals. Survey results also indicated that the participants were less
likely to use graphs and charts in the progress reports to validate their students’ progress toward
meeting their IEP goals. The majority of the participants, 87.8% (n = 36) selected more than one
data source to support their students’ skill attainment either met or made progress toward their IEP
goal. Table 6 presents the types of data used to determine progress toward IEP goals.
The participants further indicated that only 8% (n =4) of the progress reports indicated that
changes to the instructional strategies were implemented as a result of the student’s progress or lack
thereof.
The researcher’s reviewed the participants’ progress monitoring report (N = 51) to investigate
the types of data reported to the parents. Results of this review showed that 61% (n =31) of the
reports used some type of data to support their evaluation of the child’s progress. While narratives
were included in 23% (n = 12) of the reports, they did not include any information to corroborate the
participants’ evaluation of the child’s progress. No comments or narratives were included in 16%
OJTE – SPRING 2016
Data collection. Special education service provider participants were asked the frequency
by which they collected data to analyze their student’s progress toward meeting IEP goal(s). Results
from the survey indicated that 81% (n = 34) of the data was collected on a weekly to daily basis and
12% (n =5) on a quarterly basis. Figure 3 presents the frequency of data collection.
Figure 3
Frequency of Data Collection by Percentage
Response Rate = 82.35%
Special education service provider participants were asked to select from a list the
individuals who were involved in the data collection of the report they prepared and provided to the
parents. Participants who responded to this question indicated that 59.6% of special education
teachers (n = 28) and 57.5% of ancillary faculty (n = 27) were primarily involved in the data
collection. The participants further indicated that 36% of educational assistance (n =17) and 12.8%
of general education teachers (n = 6) were involved in the data collection. Table 7 presents
individuals who gathered data on student’s progress toward meeting IEP goals.
Progress reports to parents. Special education service provider participants were asked to
select the frequency by which they provide information on their student’s progress to his/her parents.
4.8
76.2
12 7.1
0 20 40 60 80 100
Daily Weekly Quarterly Other
OJTE – SPRING 2016 Participant respondents (n =43) indicated that progress reports were sent home 93% on a quarterly
basis (n = 40), 4.7% on an interim basis (n =2) and 2.3% on a weekly basis. (n =1).
Study participants were asked to select from a list all of the types of delivery used to inform
parents as to their child’s progress. The participant respondents most often indicated that 71% of the
reports (n =29) were sent home with the student. The second most often mode of delivery selected
was mailed home to the students’ parents 34% (n=14). Followed by emailing reports home 29% (n=
12) to the students’ parents. Table 8 presents the manner in which the progress reports delivered to
the parents.
While the special education service provider participants used a uniform report, there was not
uniformity in the terms or acronyms used to report student’s progress. When asked if a key was
used to define terms or acronyms to evaluate student’s progress, 38% of the participants (n = 19)
indicated that they did provide a key to define terms; whereas 62%, of the teacher participant
respondents (n = 31) indicated that they did not include a key or defined terms. A review of the
progress reports by the researchers indicated that a 74.5% (n=38) of the progress reports did not
define acronyms and terms used in the progress reports.
Participants’ Beliefs
Special education service provider participants were asked to rank word pairs that best
described their beliefs toward the progress report that they prepared for parents. Using a seven-
point Likert-type scale, with one indicating strongly agree and seven indicating strongly disagree.
Results of the ranking indicated that the participants’ had a positive perception of the reports they
prepared for their student’s parents. Table 9 presents participants perception of the progress reports
OJTE – SPRING 2016
Implications for Practice
The purpose of this study was to investigate the status of progress reports and special
education service providers’ perceptions of the reports that they prepare to keep parents informed
about their child’s growth toward meeting IEP goals and objectives. The findings of this study
suggest that while the special education service providers have a positive view of the reports they
prepare, the reports provided to parents lack basic formative information that accounts for their
child’s progress toward meeting identified IEP goals and objectives. These findings reveal an
important dilemma. Although the letter and the spirit of IDEA (2006), encourages a partnership
between parents and schools to development educational plans for students with disabilities and to
monitor students’ progress in meeting the educational plans, in practice the reports lack clear
communication in order to establish this partnership.
According to Vannest, Burke, Payne, Davis, & Soares (2011), “IDEA envisions a public
school system fluent in prevention science, data collection, and progress monitoring in order to
improve outcomes for students with disabilities” (page 40). As a prevention science, one would
expect progress reports to include a summary of the data collected and how it was used to make
instructional decisions. However, findings from this study found that data was either absent or not
reported in a manner that communicated to parents and other educational team members how
instructional decisions were made.
While progress monitoring is a concept that is discussed at IEP meetings and is mandated as a
part of a student’s educational rights (IDEA, 2006), there is little discussion on the type of data to be
collected, how it will be evaluated, and what should be reported to the IEP team. This study found
that the majority of the data was collected by educational assistants (46%) and special education
OJTE – SPRING 2016 their day in the general education classroom, it seems logical that the general education teachers
would have a greater role in not only gathering the data but analyzing and reporting students’
progress in meeting IEP goals (U.S. National Center for Educational Outcomes, 2014). Federal and
state regulations have attempted to address the historically poor educational outcomes reported for
students with disabilities resulting in an increase in teachers being held accountable for students’
outcomes. While the inclusion of students with disabilities in general education has increased, the
graduation rate for students with disabilities continues to lag behind their peers (U.S. National
Center for Educational Outcomes, 2014). Perhaps an increase in active engagement of the general
education faculty would result in more positive outcomes for students with disabilities. Possibly, the
missing link for students’ success is the increased role of the general education teacher to not only
assist in gathering data but to make instructional decision to increase student learning based upon the
results of the data.
This study found that the majority of the participants did use some type of data to support
their reporting of students’ progress but the majority did not use the data to make instructional
decisions. In this study, 41% of the progress reports indicated that the student either met or did not
meet the IEP goal. Yet, only 8% of the progress reports indicated any changes were made in
instruction. Surely, if a student has met an IEP goal and is still in need of special education services,
the IEP team should convene to determine the goal revisions or the development of a new goal.
Conversely, if a student is not making progress toward an IEP goal, instructional practices should be
adjusted.
IDEA (2004) requires educational teams are required to not only identify goals that focus on
the individual needs of a child with disability, but to specify how the child’s progress in attaining
OJTE – SPRING 2016
requires that frequent, systematic, and consistent assessments be in place to directly measure both
the students’ growth in meeting IEP goals and the teaching practices employed to address the skills
delineated in the students’ IEP goals. Effective communication on a regular basis of the students’
progress is paramount to all stakeholders.
A limitation to the study that adversely impacts its generalization was the number of IEP
progress reports, the single district involved, and the limited demographics of the district whose
documents were examined. Future studies which utilize multiple districts with varying demographics
will be explored to further investigate the need for sustained professional development to assist
educational team in not only reporting students’ progress in attaining IEP goals and objectives but to
include parents and students in the process.
The Teacher’s Progress Reporting Survey has the potential to heighten teachers’ awareness as
to the varying aspects of progress monitoring which can assist them in developing progress reports
that not only meet federal and state requirements but are meaningful in determining when a teaching
practice specifically selected to address the needs of a particular student needs to be adjusted so that
students may attain IEP goals. Therefore, teacher training programs and sustained professional
development must address the disparities of progress monitoring practices and the role they are to
fulfill. Possibly, closing the gap between children with and without disabilities lies within the
OJTE – SPRING 2016 References
Deno, S.L., (2003). Developments in curriculum-based measurement. The Journal of Special Education, 37(3), 184-192.
Etscheidt, S. (2006). Progress Monitoring: Legal Issues and Recommendations for IEP Teams. Teaching Exceptional Children, 38(3), 56-60.
Espin, C., Wallace, T., Lembke, E., Campbell, H., and Long, J.D. (2010). Creating a progress monitoring system in reading for middle school students: Tracking progress towards meeting high stakes standards. Learning Disabilities Research & Practice,25(2), 60–75.
Fuchs, L. S., Deno, S., & Mirkin, P. (1984). Effects of frequent curriculum-based measurement and evaluation on pedagogy, student achievement, and student awareness of learning.American Educational Research Journal, 21, 449–460.
Gartin, B. C., & Murdick, N. L. (2005). IDEA 2004: The IEP. Remedial and Special Education, 26(6), 327-331.
Good, R. H., & Jefferson, G. (1998). Contemporary perspectives on Curriculum-Based
Measurement validity. In M. R. Shinn (Ed.), Advanced applications of Curriculum-Based Measurement (pp. 61-88).New York: Guilford.
Goodman, J.I., Hazelkorn, M., Bucholz, J.L., Duffy, M.L., & Kitta, Y. (2011). Inclusion and graduation rates: What are the outcomes? Journal of Disability Policy Studies 21(4), 241-252.
http://reportcard.education.ohio.gov/Pages/District-Search.aspx retrieved 7/19/2015
Individuals with Disabilities Education Improvement Act of 2004, PL No. 108-446. Retrieved from http://idea.ed.gov
McKenna, M. K., & Good, R., III. (2003). Assessing reading comprehension: The relation between DIBELS Oral Reading Fluency, DIBELS Retell Fluency, and Oregon State
No Child Left Behind Act (2001). PL 107-110. Retrieved from http://www2.ed.gov/policy/elsec/leg/esea02/index.html
Roach, A. T., Chilungu, N., La Salle, T. P., Talapatra, D., & Vignieri, M. (2009). Opportunities and options for facilitating and evaluating access to the general curriculum for students with disabilities. Peabody Journal of Education, 84,511-528.
OJTE – SPRING 2016
Shinn, M.M., & Shinn, M.R. (2002). Administration and scoring of Reading Curriculum-Based Measurement (R-CBM) for use in general outcome measurement. NCS Pearson, Inc.
U.S. Department of Education’s National Center for Education Statistics (2014). Retrieved from https://nces.ed.gov/fastfacts/
Vannest, K. J., Burke, M. D., Payne, T. E., Davis, C. R., & Soares, D. A. (2011). Electronic
progress monitoring of IEP goals and objectives. Teaching Exceptional Children, 43, 40-51.
Table 1
Summary information for 2013-2014 State Report Card
Area Grade Reported Percentage
Performance Index Grade A 92.7%
Indicators Met Grade A 100.0%
Note: A = 90.0 -100.0%;
Table 2
District’s Accountability Value-Added Report (2014)
Accountability Measure
Number of Reading Students in the Calculation
Number of Math Students in the Calculation
Mean
Gain Standard Error Gain Index Letter Grade
Overall 2244 2235 1.0228 0.1600 6.39 A
2-year 1471 1464 1.3190 0.2169 6.08 A
1-year 725 722 -0.7403 0.3758 -1.96 D
Gifted 716 748 1.1615 0.3110 3.74 A
Lowest 20% 26 4.2552 2.0298 2.10 A
Students with
Disabilities 87 86 0.4907 0.9742 0.50 C
OJTE – SPRING 2016 Table 3
Students’ Grade Level by Percentage
____________________________________________________________ Grade Percentage
Pre-Kindergarten 2.0 (n = 1) Kindergarten 16.3 (n = 8) 1 4.0 (n = 2) 2 8.2 (n = 4) 3 8.2 (n = 4) 4 4.0 (n = 2) 5 8.2 (n = 4) 6 8.2 (n = 4) 7 8.2 (n = 4) 8 8.2 (n = 4) 9 6.1 (n = 3) 10 8.2 (n = 4) 11 10.2 (n = 5) Response Rate = 96.07%
Table 4
Growth toward Meeting IEP Goals by Percentage.
______________________________________________________________________________
Survey Question Progress Toward Progress Toward No Progress
All IEP Goals Some IEP Goals
Did your report indicate that your 61% (n=31) 39% (n=20) 0 students made progress toward all,
some or none of the IEP goal(s)?
OJTE – SPRING 2016
Table 5
Progress Reports that indicated IEP Goals were met by Percentage.
_____________________________________________________________________________
Survey Question Met all Goals Met Some Goals Did not Meet Goals
Did your report indicate 25% (n=11) 59% (n=26) 16% (n=7) that the student met all,
some or none of the IEP
Goal(s) Response Rate = 86.27%
Table 6
Types Data Used to Determine Progress toward IEP’s Goal(s) by Percentage
______________________________________________________________________________
Data Type Percentage
Charts 7.3% (n = 3)
Graphs 4.9% (n = 2)
Narrative 75.6% (n = 31)
Percentage 61.0% (n = 25)
Test Scores 39.0% (n = 16)
Other 31.7% (n = 13)
No data Provided 2.4% (n = 1) Response Rate = 80.39%
OJTE – SPRING 2016 Table 7
Individual who are Involved in Progress Monitoring Data Collection
_________________________________________________________________________
Individuals Who Gather Data Percentage
Educational Assistant 36.0 (n =17)
General Education Teacher 12.8 (n = 6) Interpreter 6.4 (n = 3)
Nurse 6.4 (n = 3)
Occupational Therapist 14.9 (n = 7) Physical Therapist 8.5 (n = 4) Special Education Teacher 59.6 (n = 28)
Speech/Language Therapist 21.3 (n = 10 Response Rate = 92.15%
Note: The variation in sample size is due to the respondents’ selection of more than one data source.
Table 8
Delivery Style of Progress Report to Parents
______________________________________________________________________________
Mode of Delivery Percentage
E-Mailed 29.2 (n = 12)
Mailed Home 34.1 (n = 14)
Sent Home with Child 70.7 (n = 29) Response Rate= 80.39%
OJTE – SPRING 2016
Table 9
Participants Perception of Progress Reports Prepared __________________________________________
Words M (SD)
Good 2.27 (0.92)
Worthless 5.55 (1.36)
Important 1.97 (1.31)
Understandable 2.04 (1.02) Not Helpful 5.61 (1.24)
Effective 2.17 (1.12)
Useful 2.19 (0.94)
n=48
OJTE – SPRING 2016 About the Authors:
Kathleen G. Winterman, Ed.D Xavier University
3800 Victory Parkway Cincinnati, Ohio 45207-7311 [email protected]
Clarissa Rosas, Ph.D
University of Mt. St. Joseph 5701 Delhi Rd
OJTE – SPRING 2016
TOPIC HERE
Shifting the Paradigm of Identity in Students
Who Are Deaf of Hard of Hearing in General Education
Megan Reister, Ph.D. .
.
* Correspondence: Dr. Megan Reister. Franciscan University of Steubenville
Education Department 1235 University Blvd Steubenville, Ohio 43952 mreister@franciscanedu 740-284-5297
Full list of author
information is available at the end of the article
Abstract:
General educators will need to be aware or recognize students with hearing loss may not refer to themselves as deaf in the sense that the general public refers to being deaf by focusing on the variety of
perceptions of deafness in the students the general educators may have in their classrooms and how they may help these students advocate for themselves. This manuscript provides an overview of current literature and perspectives from the disciplines of psychology, counseling, and deaf education/deafness of identity as related to hearing loss. The author presents a shifting paradigm through a theoretical model that proposes viewing identity from a different lens, particularly when applied to students with hearing loss who use spoken language and listening and who are educated in general education settings and their
caregivers/parents.
INTRODUCTION
Approximately 5% of the general population has significant hearing loss (Woodcock, Rohan, & Campbell, 2007) and approximately three per 1,000 newborns in the United States are born with a hearing loss (K. R. White, 2010; U.S. Centers for Disease Control and Prevention, 2009). Moreover, 95% of children with hearing loss are born to hearing
OJTE – SPRING 2016
More recent data from the United States Office of Special Education (U.S. Department of
Education, 2012) revealed that 85% of students with hearing loss are educated in public schools.
These students are usually the only ones in their classrooms, or even schools, who have hearing loss
(Bruce-Rosser, 2009) indicating the importance of general educators in recognizing that students
with hearing loss may not refer to themselves as deaf in the sense that the general public refers to
being deaf by focusing on the variety of perceptions of deafness in the students the general educators
may teach in their classrooms. Through increased understanding of how their students perceive
themselves regarding hearing loss, general educators can assist the students with acquisition of
self-advocacy skills.
Analyzing how individuals with hearing loss identify themselves with how others in their
lives perceive them is critical if understanding and affirmation of one another can occur because
caregivers/parents, teachers, and counselors of students with hearing loss must not assume what is
most central to individuals with hearing loss. For example, others should realize that individuals
with hearing loss may not necessarily identify themselves as being one of the identity types that have
been established in identity studies within Deaf Studies/Deafness literature. Instead,
caregivers/parents, teachers, and counselors of students with hearing loss must be receptive to how
the individual student identifies him or herself (Cole & Edelmann, 1991; Jackson et al., 2008;
Schlesinger & Meadow, 1972). This awareness of differing perceptions reflects tenets of the
Symbolic Interaction Theory in that individuals may hold different interpretations or meanings for
the identities they select related to hearing loss.
It is human nature to want to be understood and to view oneself as a whole rather than
through isolated features as determined by externally imposed labels and by a singular dimension
OJTE – SPRING 2016
creative athletic individual who also has hearing loss (Orrange, 2003). The Multidimensional
Identity Model illustrates the desire of wanting to be understood or viewed as a whole, or a sum of
multiple parts, rather than solely focusing on one aspect of self. If a disconnect among the
individual’s perceptions and others’ perceptions exists, the differing views of identity must be
reconciled before addressing the issues of how to foster self-advocacy in students with hearing loss.
Aspects of Social Identity Theory that highlight the concept of belonging or “fitting in” with a group
relate to the present study in that, if a student with hearing loss does not perceive him or herself as
belonging to a group or as “fitting in”, then he or she may feel isolated and unacceptable in terms of
his or her social identity membership.
Woodward (1972) first made the distinction between deaf (medical view) and Deaf (cultural
view). Those who identify with Deaf culture often communicate through American Sign Language
(ASL) and may object to the hearing world and people with hearing loss using the speech mode of
communication (Gesser, 2007; Padden & Humphries, 2005; Reagan, 1995; Shakespeare & Watson,
2002). Conversely, if an individual with hearing loss defines him or herself as having a hearing
identity type, then the hearing loss would likely be perceived as a medical pathology and the hearing
world would be the reference point for normality and health (Ladd, 2005; Padden & Humphries,
2005; Woodward, 1972). In this instance of relating to the hearing world, value is placed on spoken
language, therefore those who categorize themselves as having a hearing identity type might call
themselves hearing, hard of hearing, or as someone who has hearing loss rather than classifying
themselves as having a deaf identity type. In this article, the author will discuss the theoretical
model of identity that suggests a shift in the paradigm in regards to identity as related to deafness.
General educators may be more familiar with deafness from a Deaf cultural perspective and may
OJTE – SPRING 2016
that perception of identity. However, a person with hearing loss may or may not identify him or
herself as deaf from a cultural perspective. Factors such as degree of hearing loss, age of onset, type
of hearing loss, family history and lifestyle, mode of communication, and community context
influences how an individual with hearing loss perceives or identifies him or herself (Humphries &
Humphries, 2011). A person with hearing loss may claim an identity that is radically different from
other individuals with a similar type of hearing loss. Many factors contribute to and affect adoption
of an individual identity and some researchers agree that identities are constructed within multiple
communities and contexts.
This theoretical model of identity of deaf students who utilize spoken language and listening
to communicate with others explores perceptions of identity related to hearing loss in conjunction
with aspects of the Symbolic Interaction Theory, Social Identity, and the Multidimensional Identity
Model in an effort to demonstrate how general educators will need to be aware or recognize students
with hearing loss may not refer to themselves as deaf in the sense that the general public refers to
what it means to be deaf. This shifting paradigm of deaf identity will better assist general educators
by highlighting the need to focus on the variety of perceptions of deafness in the students the general
educators may serve and teach in their classrooms. Through a better understanding of how these
students might view or perceive themselves in relation to hearing loss, general educators will be
better able to assist with increasing self-advocacy within these students and therefore reduce learned
helplessness. The overall purposes of the theoretical model are to highlight the importance in
discovering how the student with hearing loss identifies him or herself and how others in the
student’s life perceive the student. If a disconnect exists among those perceptions, the differing
views must be reconciled before addressing the issues of self-advocacy and learned helplessness in
OJTE – SPRING 2016
school counselors can encourage students with hearing loss to consider the less focused on aspects of
their identity while still maintaining care to not make assumptions about identity dimensions (i.e.,
Deaf identity type versus hearing identity type). As Foucault suggests (as cited in Besley & Peters,
2007), by truthfully and authentically confessing who one is to others, we affirm and own our
identity. We need to tell the truth about ourselves and we need to uncover the diversity of
deaf/Deaf/DeaF epistemologies (Ladd, 2005).
THEORETICAL FRAMEWORK FOR SHIFTING PARADIGM
To provide a construct for this paradigmatic shift, various researchers have viewed identity
from differing perspectives. Simmel (1971) perceived an individual’s identity and individuality as
being the product of his or her overlapping ethnic, social, religious, familial, geographic,
occupational, and multiple other affiliations. Thus, one’s self-identity is based on his or her range of
multiple intersecting affiliations (Brekhus, 2008; Zerubavel, 2007). Gergen (1991) elaborated on
this idea by stating that the modern self is comprised of so many memberships that no single identity
membership is likely to comprise a large percentage of a person’s overall self. He further posits that
authenticity goes beyond assuming that commitment to and pride in one’s identity are necessarily the
only ways one can claim an authentic identity membership to a marked social category. Constructs
of the study of identity from psychology and counseling as well as the literature in Deaf
Studies/Deafness served as the foundation for the proposed theoretical model of identity in students
with hearing loss who utilize spoken language and listening to communicate. Symbolic Interaction
Theory, Social Identity Theory, the Multidimensional Identity Model, and studies of the
development of identity from the discipline of Deaf Studies/Deafness were the lens through which
the theoretical model of identity was framed. See Figure 1 for a visual representation of the
OJTE – SPRING 2016
Figure 1. Theoretical Framework.
One’s perception of identity as related to hearing loss may be affected by the meanings he or
she attributes to identities, roles, interactions, and contexts (Symbolic Interaction Theory). One’s
perception of identity as related to hearing loss may also be influenced by how one achieves a sense
of belonging to or “fitting in” with a group (Social Identity). In addition, one’s perception of
identity as related to hearing loss may be contingent upon one’s view of self as a whole versus
focusing on isolated features that comprise the individual (Multidimensional Identity Model). One’s
perception of identity as related to hearing loss may also be attributed to his or her interpretation of
identity types (Deaf Studies/Deafness literature). It is through social interactions that individuals
derive meanings and make sense of their world as described in Symbolic Interaction Theory. These
same social interactions also enable individuals to perceive acceptance or non-acceptance in groups
as delineated in Social Identity Theory. Further, the Multidimensional Identity Model emphasizes
identity as being fluid as demonstrated through the social interactions of individuals with others in Perceptions of
Identity Related to Hearing Loss Symbolic
Interaction Theory
Social Identity
Identity Studies within Deaf Studies/Deafnes
s
Multidimensiona l
OJTE – SPRING 2016
various contexts. Thus, the frameworks of Symbolic Interaction Theory, Social Identity Theory, and
Multidimensional Identity Model, in conjunction with the identity types as established within Deaf
Studies/Deafness, affirm the role of social interactions in forming perceptions of identity by students
with hearing loss and their caregivers/parents.
According to the tenets of the Symbolic Interaction Theory, an individual creates his or her
identity through interacting with others so a child’s interactions with his or her caregivers/parents
have a significant impact in formulating meaning since caregivers/parents are the child’s first
teachers or first individuals with whom they interact. These interactions influence how the
individual behaves in subsequent interactions. If others with whom an individual interacts disagree
with the individual’s self-identity or perceptions of hearing loss, this may lead to an individual
questioning his or her identity or how he or she defines hearing loss. The Symbolic Interaction
Theory views the family as a seminal social interaction group and posits that individuals develop
both a concept of self and their identities through social interaction with family members (Burgess,
1925; Handel, 1985). Family members are the first individuals with whom a child interacts, thus,
families serve as shapers of identity since they are crucial sites of creating and verifying social and
shared meanings.
In addition to Symbolic Interaction Theory, Social Identity Theory delineates the relationship
between the individual and society and the development of an individual’s personal and social
identities (C. A. Baker, 2012; Mead, 1934; Tajfel & Turner, 1986). Social identity is defined as the
“aspects of an individual’s self–image that derive from the social categories to which he perceives
himself as “belonging” (Tajfel & Turner, 1986). Therefore, an individual’s social identity refers to
that part of one’s sense of identity that emerges from his or her belonging to a particular group and