Heather Allen is a recognized expert in sustainable urban transport. Her international experience includes working on public transport, sustainable development and climate change for the past fifteen years at the International Association of Public Transport (UITP) where she also developed and managed their sustainable development programme and internationally acclaimed sustainable development charter. She is has presented widely and written numerous articles, position papers and reports on these issues and is also a founder member of the joint initiative Bridging the Gap and the UNDESA led group on Low Carbon Transport SLoCat, with more than fifty organizations.
Integrated Public Transport,
Nantes, France
Heather Allen
Case study prepared for
Global Report on Human Settlements 2013
Disclaimer: This case study is published as submitted by the consultant, and it has not been edited by the United Nations.
The designations employed and the presentation of the material in this publication do not imply the expression of any opinion whatsoever on the part of the Secretariat of the United Nations concerning the legal status of any country, territory, city or area, or of its authorities, or concerning delimitation of its frontiers or boundaries, or regarding its economic system or degree of development.
The analysis, conclusions and recommendations of the report do not necessarily reflect the views of the United Nations Human Settlements Programme, the Governing Council of the United Nations Human Settlements Programme or its Member States.
Nairobi, 2011 Acknowledgements
A special thanks to Anne Vicenzotti of Nantes Métropole for her precious help in the preparation of this case study and for providing the photos.
Integrated Public Transport, Nantes, France
Heather AllenIntroduction
Nantes is a city in western France, located on the Loire River, 50km inland from the Atlantic coast. The city is the sixth largest in France. Nantes Métropole (the Greater Nantes) is a conurbation gathering 24 municipalities from the surrounding towns and villages under one regional body responsible for transport, planning and other urban competences (Nantes Métropole (undated). It comprises some 590,000 inhabitants.
Between 1960 and 2006 it grew in size at double the rate of employment opportunities and population. Over the years, Nantes has become a highly desirable place to live. This is partly due to an attractive perceived and real quality of life, created by providing transport choices. It also enjoyed an early high speed train (TGV – Train Grand Vitesse) connection to Paris meaning that the capital could be accessed in a few hours. However, despite efforts of densification in the period 1999 to 2006, the population in the periphery grew more quickly than the city itself. This was due in part to the price of accommodation in the suburbs and surrounding area.
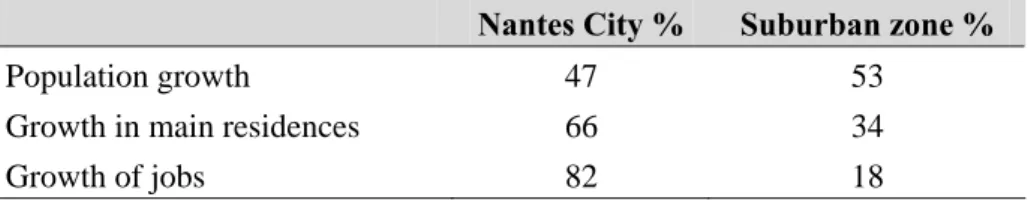
Table 1. Share (%) in growth of Nantes city and the surrounding suburbs Nantes City % Suburban zone %
Population growth 47 53
Growth in main residences 66 34
Growth of jobs 82 18
Source: INSEE, 2006; Nantes Métropole, 2011a.
Nantes’ was chosen as a case study as it has been at the forefront of sustainable transportation for more than a decade – indeed Time magazine described it as ‘the most livable city in Europe‘ in 2004 and it has been chosen to be European Green Capital in 2013. Its
commitment to sustainable transport goes back more than thirty years and since the early 1980s, the conurbation of Nantes Métropole has made strong commitments in the field of integrated mobility and towards sustainable development.
It was for instance the first French city to reintroduce a modern tramway in 1985 and now boasts the longest tramway in France. In addition, it is a good example of how an employer tax (the versement transport1) widely implemented across France has helped deliver this. It is also known for its Busway system, a bus rapid transit-like express bus line first commissioned in 2006. And they have introduced a ‘navibus’ along the Loire River and have plans to
combine tram and train services (using the same infrastructure for heavy and light rail). In addition, they have used various ‘push and pull’ measures to dissuade car use, and increase public transport, walking and cycling beyond just infrastructure improvements; These include
1. The ‘versement transport’ is a national scheme in cities with more than 10,000 population whereby companies with more nine employees need to pay a tax based on the total of their salaries. The actual rate is set locally and thus varies from city to city. The tax is obligatory and cannot be reclaimed and it is collected under the same conditions as social security. This tax has paid for the renaissance of tramways across France over the past twenty years.
Figure 1. An excellent example of integration in Nantes, high quality express bus lines and the tramway are within a short walk from a ‘park and ride’ parking area
Copyright: Patrick Garçon, Nantes Métropole.
a reorganization of the institutional set-up at local government level for better ‘joined up thinking’, integrated transport connections and timetabling, bike and car share schemes, car pooling, improving passenger information, removing street parking and promoting park and ride, company employee mobility plans and developing weekly and monthly special ticket rates to mention a few.
They have also been a pioneer in drawing up urban mobility plans and are now on their third one (2010–2020). This framework document sets out transport policy for the next ten years and thematic action plans are elaborated on topics such as public transport, non-motorized transport (soft modes), parking, traffic and road safety and inter- and multimodality aspects. Nantes’ consistent approach to provide an integrated network of trams, high quality bus services, regular bus services and complementary services has helped to Nantes to some extent manage the growth of private car use, whilst retain a high level of mobility for its citizens and preserve their quality of life. It also highlights the potential for small and medium size cities to still be able to afford high level quality public transport.
Background
A particularity of Nantes Métropole (and possibly one of the reasons for its success) is that they have managed to integrate the decision making agencies in and around the city into one body, Nantes Métropole which exercises various competences and is responsible for highway and public spaces, housing, town planning, land use and development as well as public transport. Nantes Métropole also has the competence for all aspects of organizing public
transport. This means the planning, financing, tendering and contracting of operations across all modes; developing and maintaining the rolling stock and infrastructure in cooperation with operators; setting the routes, service frequencies and fares; as well as setting and monitoring quality levels.
Since 2008 there has been only one body responsible for all mobility matters within the conurbation. The departments responsible for the implementation strategy, policy
development and operational management were merged, and the new department created is responsible for sustainable mobility rather than transport (changing from a Direction Générale des Déplacements into Aurorité Organisatrice de la Mobilité Durable). It is now responsible for strategy as well as operational management of a whole range of aspects of sustainable mobility, including roads and highway planning, traffic management, traffic and public road management, cycling and parking policies, and management including all off-street parking such as multi-storey car parks, park and rides and other sustainable mobility services such as car-pooling and car sharing.
The transport department is also responsible for the investment in infrastructure, vehicles, facilities and equipment. In today’s world these investments are often made by various operators under different types of contract on behalf of the authority and many services are delegated to private and semi-public providers. After some 30 years of experience Nantes is in a good position to negotiate and manage these contracts (Délégations des Services
Publiques).
For public transport operations, at present there is one 7-year long contract, awarded by a call for tenders to a semi-public company of which the management board seats are shared by the Nantes Métropole and Veolia Transdev, a private multinational company responsible for operations.2 The authority finances an investment programme (rolling stock, infrastructure) and provides a financial contribution for operation. The operator is responsible for specific quality levels and to reaching the required ridership level, both levels being set by the authority.
Operational expenditure is mainly covered by ticket sales (GART 2008)3 (37.4 per cent) and a specific public transport tax imposed on all firms located in the area served by public
transport and which is calculated on the basis of the total wage bill (Versement transport in French). The level of this tax is set by law and is obligatory for all companies with more than 9 employees. This tax can also be used to finance infrastructure and rolling stock in addition to financial support from the State, the Region, the Province (Département) and sometimes through subsidies from European projects. Its very existence has been key for many cities in France to be able to build and operate their tram systems over the past 20 or so years.
The Urban Mobility Plans
Having launched its first urban mobility plan as early as the 1990s, Nantes Métropole is currently working on its third Sustainable Urban Mobility Plan. This includes an action plan for the period 2010–20154 with a long-term horizon of 2030. After it took the lead and
2. The contract was awarded to Transdev a semi public company but during the term Veolia Transport and Transdev merged and have created one new entity entitle Veolia Transdev. During this process some contracts across France were lost.
3. Average monthly pass is €48.
4. The time frame of the mobility plans have had to be changed as according to national law there should be an evaluation. Therefore the time frame needed to be shortened to allow for the political calendar and for the term of office of the administration. The plan has a long-term horizon but a five year action plan.
successfully reintroduced a tramway in France, Nantes was also one of the first cities to develop an integrated urban public transport policy and to integrate the tram with bicycle networks.
The period 2000–2009
Nantes Métropole’s mobility plan for the period 2000–2010 set the objective of reaching a 50/50 modal share between private cars and ‘other’ modes of transport (this is defined as walking, cycling, public transport and being a passenger in a car, to include car pooling rather than individual car use). A budget of €1500 million for the period 2001–2008,5 representing 28 per cent of the conurbation’s overall budget, was allocated to achieving it. A variety of measures were put in place to achieve this and in the evaluation, some but not all objectives were met. One of the reasons for this was that the planned fourth tramway line was
considered to be unaffordable. Therefore, a highly successful express bus was implemented, but it does not carry quite as many passengers as a tram.
The city of Nantes itself is relatively compact but the surrounding area has suffered with urban sprawl over the past 20 years. This is partly due to planning decisions made in the 1980’s with planned settlements being created for commerce and services. The average density in the suburbs is only 55 inhabitants per hectare, while it is more than double (55 inhabitants per hectare) within the city limits. Nantes’ approach to land use and planning is exactly the opposite now, with a focus on creating short travelling distances.
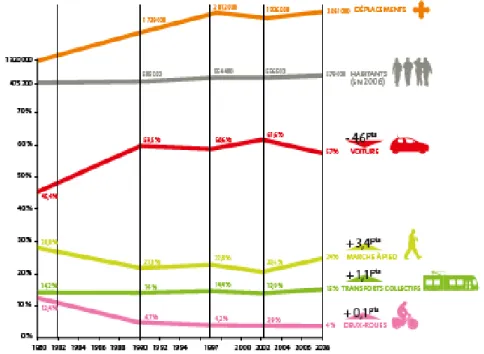
Figure 2. The evolution of journeys and population increase between 1980 and 2008
Legend: Déplacements = trips; habitants = inhabitants; voiture = car; marche à pied = walking;
transport collective = public transport; deux roues = two wheelers (non-motorized).
Source: Nantes Métropole, 2011a.
5. The dates do not always match as there were political changes in this period that meant that the budget period had to be adjusted.
Therefore, in the evaluation of the plan 2000–2010 it can be seen that the private car
continues to be the primary mode of travel for many of the citizens within Nantes Métropole; however, its market share fell by nearly 5 percentage points from 61.6 per cent in 2002 to 57 per cent in 2008. These trips mainly shifted to walking and/or to public transport. The share of public transport rose by over 1 percentage point from 13.9 per cent in 2002 to 15 per cent in 2008 and the threshold of 300 000 trips per day has been crossed.
These figures do not tell the whole story as there is a significant difference in behaviour from those that live in the suburbs and those that live within the central area.
Table 2. Comparing modal share and location Nantes Métropole area Inhabitants living in the suburbs Inhabitants living within
the city Target for 2010
Private car 57% 71% 49% 50%*
Public transport 15% 11% 17% 18%
Other modes combined 28% 18% 34% 32%
* From the published Mobility Plan 2010–2015, 47 per cent modal share was achieved in the city area.
Source: Combined information from INSEE (Institute National de la Statisque et des Etudes Economiques – www.insee.fr/), Nantes Métropole (www.nantesmetropole.fr/); and AURAN (l’Agence d’Urbanisme de l’Agglomération Nantaise – http://www.auran.org/).
The target of 50 per cent modal share of car trips was therefore achieved within the ‘péripherique’ or city confines and the targets for car sharing, car pooling, walking and cycling were also met (in fact over achieved).
Walking remains the second most popular mode for the urban citizens and its share rose by nearly 3.5 points from 20.6 per cent in 2002 to 24 per cent in 2008. It returned to a level close to that of 1980. This is a reflection of investment in walkable communities and high quality of walking infrastructure. For example, the historic inner central district of Nantes is pedestrian only (with limited access for deliveries) meaning that walking and cycling are the only
possible ways to get around it. Cycling is promoted with the implementation of Bicloo, a bike sharing scheme. The recent boom in cycling, mainly in the centre of Nantes, is expected to increase this figure over the next few years.
The period 2010–2015
The new Urban Mobility Plan however marks an important turning point, with two
complementary directions: the joint development of mobility and urban planning policies to build the city of short distances organized around denser urban centres and the planning of public spaces that are calm and tranquil.
The new plan sets new targets, particularly in terms of modal share (with an emphasis on alternative modes: 12 per cent modal share for cycling and 30 per cent for walking by 2030, see Table 3), illustrates the conurbation’s strong will to encourage and support behaviour changes for the rise of alternatives to individual motorized transport.
The final draft of the third plan was politically approved in October 2010, after a long period of consultation with the main local stakeholders: surrounding local authorities, associations, professionals, the development council, and most specifically the results of a citizens’
workshop. This workshop involved 18 volunteers who were trained and worked together during 3 weekends in order to present concrete propositions to the politicians to be taken into account in the reflection over the next urban mobility plan. This work contributed much to feed the debate over the role of pedestrians in the city and more broadly speaking over the pacification of car traffic in urban areas. The final approval of the Urban Mobility Plan takes place after consultation with key stakeholders and a public inquiry.
Table 3. Modal split objectives for period 2010–2030
Objectives 2010 2015 2030
Walking 24% 25% 30%
Cycling 2% 4% 12%
Public Transport 15% 15% 16%
Passenger in a car 10% 9% 9%
Individual car transport (as a driver) 47% 45% 31%
Motorized 2 wheeler 2% 2% 2%
Source: Nantes Métropole, 2011a and Nantes Métropole, 2011b
Public Transport
Over the period 2000–2009, great efforts were made to increase the attractiveness of the collective transport network, and they remain in line with the objectives of the 2000–2015 mobility plan. The total supply in was increased by 22 per cent, with 70 per cent more
kilometres on the tram and Busway (express bus running on dedicated or semi dedicated lanes sometimes called a ‘Bus with a High Level of Service’ – BHLS) network. Regular buses were retained for normal services and also to act as feeder services to the Busway.
Public transport infrastructure and the overall quality of the bus network, in particular, was significantly improved in this period:
4 ring lines now connect the different districts without the need of passing through the city centre, cutting travel times and avoiding interchanges;
3 Express lines offering quick connections at peak hours between suburban towns centres; and
7 km of Busway were put in place.
Ridership grew by more than the offer (36 per cent between 2000 and 2009). Today nearly 500,000 (477,300) trips6 are made daily on the network (more than half of them on the four lines of tram and Busway), or 195 trips per year per capita as against 150 in 2000 (plus 30 per cent) – a significant increase. Sixty per cent of them are made on the 3 tramway lines. These figures make Nantes Métropole the second French conurbation in terms of trips per capita (excluding Paris) and it holds first place for the number of trips made by tramway per capita in France.7 Annual growth since 2008 has been in the order of 3–4 per cent. The large numbers of passengers are habitual users and hold annual passes that allow unlimited travel on the network (69,000).
6. Figures for 2010, http://www.tan.fr/jsp/fiche_pagelibre.jsp?CODE=18076193&LANGUE=0&RH=ET-LA-SEMITAN&RF=1228218051028, last accessed, 20 June 2011.
7. Personal communication with Nantes Métropole, and from figures available on the INSEE, at http://www.insee.fr.
The evolution of ridership in Nantes
Thus the modal share of public transport only grew slightly as the total number of trips grew considerably.
The tram
With a commissioning of the first line (Line 1) as early as 1985, Nantes was the first French city to reintroduce the modern tram, which dramatically changed the city landscape (see pictures below). This first line was then followed by a second line (1992), and in 2000 by a third, for a current total length of 42km. The latest extension was in 2008. A project of linking Line 1 and Line 2 is under development, whose first phase is planned for 2012 (+1.1km). Line 4 was planned to complement the above network but the public authorities were under severe financial restraints. As tram infrastructure costs between €25–50million per km, it became clear that a solution needed to be found. And the concept of the Busway was born. In terms of tram operation, the regular frequency on each line is 5 minutes, with increased services at peak times on lines 1 and 2 central sections, to up to 3 or 2’30 min.
The figures for daily ridership are the following:
Line 1: 115,000.
Line 2: 85,000.
Line 3: 74,000.
The total ridership on the 43km long 3 tram lines accounts for 57 per cent of the total 114 million annual trips made by public transport.
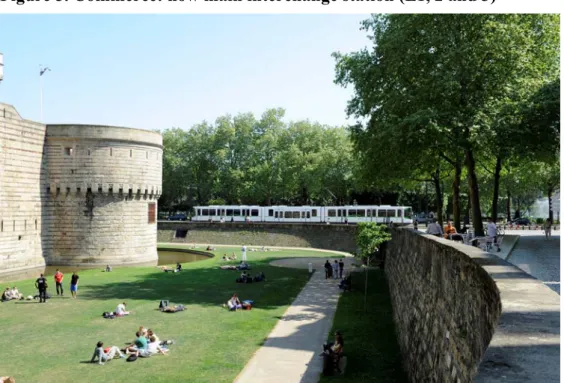
Figure 3. Tram Line 1: in front of the ancient Castle of the Dukes of Brittany
Figure 4. Evolution of ridership on the tram network (number of trips in thousands)
Source: Nantes Métropole, 2011c.
Figure 5. Commerce: now main interchange station (L1, 2 and 3)
Copyright Patrick Garçon, Nantes Métropole.
The Busway
To complete the tram network which radiates out from a central hub, a line serving the south eastern part of Nantes was still required. However, based on studies on the expected use, and because central government no longer provided funding for public transit on its own right of way, local officials had to look for a less expensive solution, adapted to the needs of this part of town. The obvious choice was to look at how buses could be made to perform as well as the tramway.
Figure 6. Architects drawing
Copyright: Nantes Métropole.
Commissioned in November, 2006, inspired by the success of Bus Rapid Transit in Latin America, the line 48 Busway took many of the elements that made the tramway or metro a success and applied them to a bus system such as:
All platforms on dedicated lanes with a 20-km average speed.
Priority at all intersections.
High frequency (3 min at peak times).
Extended hour service.
Stops to be like tram stations with real-time information and ticket vending machines.
Dedicated vehicles: with CNG articulated buses being the preferred choice.
This 7-km long line runs along most of its route on a former road expressway converted into an urban boulevard (see pictures below). Serving 15 stations, it connects the ring road (Porte de Vertou) to the centre of Nantes in less than 20 minutes, and now has a current ridership of 30,000 trips per day (June 2011).9
Other innovative features include the attention to design both of the infrastructure and the vehicles themselves. For a modest increase in overall price,10 several design features were made improving the perception of quality and aligning the image of the Busway with the successful tram in the eyes of the public. Vehicle livery and the branding of the stations is very distinctive. This attention to detail extended across the whole visual identity of the system and the stations had the look and feel of a tram rather than bus stop. Real time information also helped convey the image of ‘arrive and go’ with little need of a timetable, making taking the bus as easy and convenient as the car.
Ridership improved by 55 per cent over the previous normal city bus service in less than a year and has continued to increase. The accompanying Park and Rides (all under the authority of Nantes Métropole) are at or near capacity indicating that people were making the switch from private to public transport, especially as you need a public transport ticket to swipe at the barriers in order to exit the car parks.
8. Line 4 was the fourth tram line and became the name of the project although this was the first busway line. 9. Nantes Métropole figures (personal communication).
Table 4. Increase in ridership for ‘Line 4’ busway Passengers per day November 2006 (introduction) 17,000 January 2007 20,500 January 2008 24,600 January 2009 26,700 January 2010 27,500 January 2011 28,000
Source: Author communication with Nantes Métropole
By 2008 more than 65.65 million passengers were using the tram and Busway network annually. The complete network was extended to 41.5km and increased to 43km in 2009 at a cost of €7 million per km.
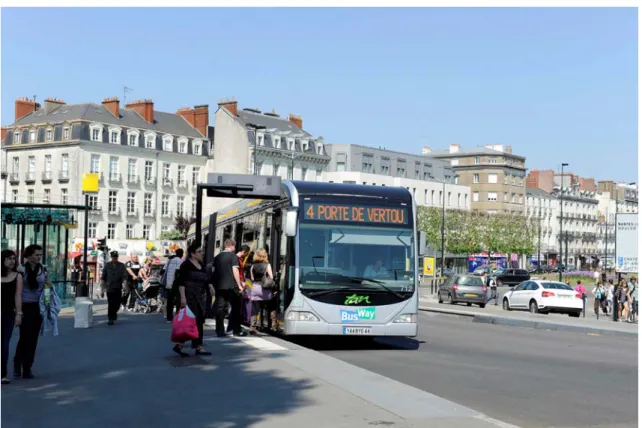
Figure 7. The Busway in central Nantes
Copyright: Patrick Garçon, Nantes Métropole.
The Chronobus project
In parallel to the introduction of the Busway, a new high performing service called the Chronobus is being put into service. This branded bus service will also help to improve the image of buses in Nantes. This new project aims at completing the structuring network and at creating an intermediary quality level between the Busway and regular bus lines.
This concept will perfectly complement the other modes within the network and connect with the existing and planned tram and Busway lines.
The Chronobus lines will offer:
A guaranteed travel time similar during and off peak hours.
Improved frequencies of 5 to 8 minutes during peak hours and of 10 to 12 minutes off peak hours.
Operating hours similar to the tram’s and Busway’s.
A continuous supply throughout the year.
An improved accessibility for all.
A visual identity for Chronobus lines (vehicles and stops).
The principle is to link more effectively employment areas and major housing areas and peripheral towns that have poor connections at the moment.
It is expected that the ten Chronobus lines will transport up to 100,000 passengers. 7 lines will be commissioned between September 2012 and September 2013 and the 3 remaining lines after 2014.
It is usual when building a tram to improve the public space along the route and Nantes took this experience on board to improve the areas around the Busway stops, giving them a similar identity to a station. This gives the riders the look and feel of a quality system.
Other learning has been transferred to the planning and design of the Chronobus. To achieve the desired level of performance, the designated Chronobus lines are being carefully designed using the state-of the-art knowledge and advice to minimize the risk of irregularities or faults. These include:
The positioning and accessibility of stops (stations and terminals).
Bus lane development.
Road enlargements enabling the smooth running of the Chronobus. Occasionally, this may require changes to the design of angle parking into parallel parking or quite simply the removal of some parking spaces.
Priority for Chronobus at intersections.
Establishing traffic calming measures.
Developing roundabouts and intersections to suit the Chronobus.
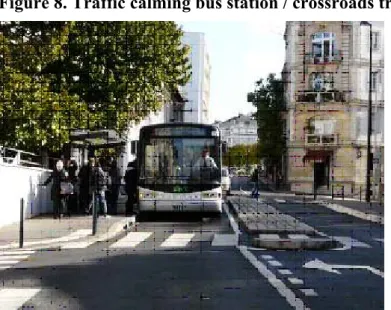
Figure 8. Traffic calming bus station / crossroads treated as roundabout
These developments systematically include the integration of the ‘soft’, non motorized modes of transport (bicycles and pedestrians) and accompany other travel demand measures to encourage behaviour changes toward limiting the use of private cars and contributing to reducing traffic flows and speeds on some of the road network. Nantes has been able to use the bus infrastructure itself to influence this mainly by giving priority to this mode over other motorized traffic.
Some examples of developments are outlined in the sections below:
Cycling
With its ‘bicycle plan’ 2010–2014, Nantes Métropole committed to developing daily bike use by implementing an integrated action programme covering service delivery, parking, public space, communication and evaluation.
The conurbation’s cycling network currently consists of about 388 km of which 337 cycle lanes or tracks, bus corridors and mixed pedestrians / cyclists’ paths (a 66 per cent increase since 2001). 5800 bicycle racks are now available at 700 different sites and 300 bike parking spaces. Furthermore, it offers various bike rental services to its citizens:
Bicloo, an automated self service bike sharing system for short distance urban trips for leisure or for work. 89 stations are dotted across the city centre with 790 bicycles available (10 new stations will be added in the summer 2011 and a further 90 more bicycles)
Ville à Vélo, a medium term rental service located in central parking lots, offering 200 bikes of which some are electric ones.
Vélocampus: a year long rental service for students (300 bicycles available, and a hundred more planned).
A new ambitious €40 million plan aims at fostering daily bike use particularly through the development of rental services, combined with easy to find, secured bike parking and safe cycling itineraries. The objectives of the plan consist in:
The implementation of 500 parking spaces in downtown car parks.
The implementation of 1000 parking spaces at Nantes’ main railway station.
The implementation of 1000 covered and / or secured parking spaces in the conurbation’s 39 Park and Rides.
Systematic equipment of main roads with cycle tracks or lanes, regular implementation of cycle boxes and counter flow lanes.
The development of existing rental services (Ville à Vélo, Vélocampus, foldable bikes), and a subsidy for the purchase of electric power assisted bicycles.
The testing of new experiments, for instance allowing right turns on red lights.
Encouraging behaviour change through targeted communication and events. The final objective is to reach a 12 per cent bicycle modal share by 2030.
Car use
Despite the efforts made and thirty years of coordinated planning and policy development, Nantes still struggles with a growing demand for private car use. This is more pronounced outside the city limits where Nantes is suffering considerable urban sprawl and population growth.
2.1 daily trips are made in the agglomeration (on weekdays) by its 590,000 inhabitants. This represents about 3.5 trips per capita (INSEE, 2006) and overall it has remained relatively stable since 2002 due to the efforts made.
In its role as organizing authority for sustainable mobility, Nantes Métropole has the
competence for parking and it sees integrated parking policy as one of the main tools to serve its global mobility policy. The impact on users’ behaviour by taking action directly on the demand side via car users is seen as being of key importance.
This has been given extra stimulus after recent studies (2009) show that if an employee has an easy and convenient parking place available to him (or her) at work, two thirds of employees take the car (individual private car). But if there is no easy parking available, the opposite is true and two thirds use more sustainable modes such as public transport, car sharing, cycling and walking for the work home trip.
Since the 1990s, the City of Nantes and now, Nantes Métropole has been setting an effective parking policy:
The objectives of this sophisticated policy are the following:
To discourage commuters and tourists to reach the city centre by car (high parking fee, strict parking time limit) and to encourage the use of Park and Ride.
To encourage the use of public transport (all Park and Ride are free for public transport users – but controls are in place to ensure that they are not just used as free parking lots) and an attractive level of service is offered.
To facilitate the access to short-term parking in the city centre for residents and to limit the time needed to find a parking space also decreases traffic in the centre and
polluting emissions.
To better manage traffic flows and limit congestion (and the related local pollution) thanks to the use of real-time information system.
More generally, to encourage car owners to limit and make responsible use of their car. Measures in the city centre include:
Paying and time-limited on-street parking.
Expansion of pedestrian areas.
Specific rate and access for residents.
Extension of services: real time information systems to avoid unnecessary traffic, bike rental services in the parking garages, etc.
Measures in the periphery:
Increasing the offer of Park and Ride sites for commuters, visitors, leisure trips.
Since 2000 parking policies have been designed to dissuade people to come to the city by car. The zone of paying parking has doubled in size since then and today the conurbation area offers several types of parking possibilities to accommodate different types of users. In the city centre:
10500 on-street paying parking spaces;
5700 parking spaces in 12 parking garages;
1900 parking spaces in 10 paying parking lots;
8500 residents parking permits have been issued. In the periphery:
A total of 40,000 parking spaces grouped in several parking areas around big facilities: stadium, airport, university, shopping malls and hospitals.
A total of 5800 car spaces in 39 Park and Ride offering free access to public transport users. This represents one place per hundred inhabitants and they are on average 80 percent full or in some case saturated.
Almost the whole parking offer, both on-street or off-street, belongs to local public authorities. This situation allows Nantes Métropole great autonomy to set its own parking policy and use it to help achieve the wider objectives of its global mobility policy, combining public transport, metropolitan traffic regulation, protection and vitalization of the town-centre of Nantes.
In coordination with the development of the parking strategy, Nantes Métropole, also encourages sharing rather than owning a car. A car-sharing service,11 branded ‘Marguerite’ (with a daisy flower logo), has been designed and since 2008 is managed by a private company. Users avoid the cost associated with the acquisition of a personal vehicle but are still able to enjoy using a car when needed. In such a system, a shared vehicle meets the needs of approximately ten users and it has been shown that users also reduce, by at least 50 per cent, their own car use.
This new service is currently growing fast and already has 20 stations and 230 clients (among which 46 firms). As Nantes has full autonomy over the road infrastructure any problems related to the allocation of space for either the car sharing stations (or parking) as well any construction of infrastructure can be well managed, with minimal disruption and short
implementation periods. Such a stable environment makes it attractive for the private sector to become involved in such projects.
To develop this use of this practice, a joint website with the Province (Loire Atlantique) was created in 2009. The platform currently counts 16,000 offers leaving from or heading to Nantes Métropole, 20 000 offers leaving from or heading to the Loire-Atlantique province and 160,000 ads for national trips. Carpooling areas (where people can arrange to be picked up and leave their own cars) are now developed across the province and the conurbation.
Company travel plans
Demonstrating the depth and breath of their commitment to sustainable mobility beyond just the provision of infrastructure and services, it has become clear to Nantes that a major lever to help get people to change their travel behaviour is to develop information and awareness raising campaigns. One of the actions is ‘mobility consulting’ working with local major employers and developing Company Travel Plans.
These plans are intended to induce, through education and financial incentives, new commuting behaviour. Nantes Métropole commits via awareness or financial incentives to support businesses so that they promote the development of less polluting travel practices. Currently, these plans involve 65,000 employees and 213 contracts have been developed. This kind of mobility management can include moving stations and stops closer to employment locations, adjusting frequencies to provide services at the right times for the employees (especially important to shift workers) and financial or fiscal incentives for the provision of public transport subscription (weekly, monthly or annual) passes.
11. Car sharing is sometimes called car clubs. It is different to car pooling as the individual needs to be screened and pay a subscription to a club or group and then they can ‘hire’ by the hour or day a variety of vehicles for their personal use. Car pooling is when a private individual offers lifts (paying or otherwise) to others.
Conclusions
The long term commitment to an integrated approach to urban planning and transport over some thirty years has paid off in Nantes, and the city is considered by many to be a desirable place to both live and work. It has also benefitted from national and international recognition awards such as winner of the City of the Year CIVITAS award in 2009 given by the European Commission and has been named as the European Green Capital for the year 2013.
Part of this success is due to the availability of the regional funds and being involved with many multi-stakeholder and large scale international projects via the European institutions. Nantes was able to benefit from the early CIVITAS programme and this has helped to steel the conurbation’s will and capacity to promote sustainable transport policies as well as bring wider benefits via the exchange of experiences with other medium sized European cities. Nantes now benefits from a deep experience as an organizing authority and it is able to manage the complexities of putting sustainable urban transport into place. It has kept loyal to its vision of the type of city Nantes aspires to be and focus on the transport arrangements that need to be put in place in order to achieve this. Having built a level of trust with its citizens over the years and delivered quality alternatives to the private car, it is now in a strong enough position to put ‘push and pull’ demand management measures in place that are in the main supported by the general public.
The major points of note are:
A long-term city wide vision and strategy.
The authority/ local government had the competence across the required areas to
enable integration to occur (e.g. pricing and availability of parking, integrated ticketing, infrastructure etc).
They were able to build consensus with surrounding communes, gain political support and implement integrated policies and plans, gaining the advantages of a wide service area.
Intelligent choices and the integration of modes, including the wider possibilities of car and bike sharing, car pooling and walking (including pedestrian only zones) have been key to success with the public.
Sustained investment in quality infrastructure and vehicles making an attractive offer for alternatives to private car use.
Achieved a high level of public transport service at an affordable price (for a medium size city).
Many of these points can be adapted and replicated in both developed and emerging cities for the benefit of their citizens. The success of Nantes also highlights the potential for medium sized cities to still be able to implement strong and effective transport policies and curb unnecessary car use.
References
GART (Groupement des Autorités Responsables de Transport) (2008) ‘L’Année 2008 des transports urbains’ http://www.gart.org/S-informer/Publications-du-GART/L-annee-2008-des-transports-urbains, last accessed 5 July 2011 pp.15–47
INSEE (Institut National de la Statistique et des Études Économiques) (2006) ‘Définition de l’aire urbaine en 2006 en 82 communes’, http://www.insee.fr/fr/themes/document.asp?reg_id= 3&ref_id=15614#publ2, last accessed 3 August 2011
Nantes Métropole (2011a) ‘Plan des Déplacements 2010–2015 perspective 2030’, PDU après consulations et enquete public, pp.10–136, http://www.nantesmetropole.fr/medias/ fichier/pdu-2010-2015-2030-vf_1312390883646.pdf, last accessed 13 August 2011 Nantes Métropole (2011b) ‘Eléments Clés, Plan des Déplacements 2010–2015 perspective 2030’,
PDU après consulations et enquete public, Nantes Métropole, pp.2–9, http://www.nantes metropole.fr/medias/fichier/elements-clefs-pdu_1297935200931.pdf, last accessed 16 August 2011
Nantes Métropole (2011c) ‘Nantes’, Background paper prepared by Nantes Metropole for the Institute of Transport Development Policy ITDP for their sustainable transport awards, December 2010 Nantes Métropole (undated) ‘La Communauté Urbaine’