Evaluation of stormwater infiltration performance
based on drainage area outlet monitoring
Evaluation des performances d'infiltration des eaux
pluviales d'un bassin versant par le contrôle des rejets à
l'aval
Jun Endo*, Hiromichi Fujiwara*, Takashi Sakakibara*, Toshiaki
Yoshida*
* National Institute for Land and Infrastructure Management,
1 Asahi, Tsukuba City, Ibaraki Prefecture, Japan ([email protected])
RÉSUMÉ
L’une des raisons actuelles pour lesquelles les systèmes d’infiltration des eaux pluviales ne sont pas beaucoup utilisés est le manque de connaissances concernant leurs performances d'infiltration en termes de qualité et de durée.
Les données relatives aux performances d’infiltration pour les différentes installations individuelles sont très hétérogènes et leur mesure prend beaucoup de temps, nécessite une main d’œuvre importante et entraîne des coûts élevés. Par conséquent, les auteurs ont proposé une méthode d’évaluation planaire des effets de la réduction de l’écoulement des eaux pluviales, combinant la modélisation du secteur faisant l’objet de l’étude et le contrôle de l’écoulement des eaux pluviales, et ont réalisé une étude de cas portant sur cette méthode.
Ils ont procédé à la modélisation du secteur concerné en utilisant des modèles de distribution (MOUSE) et des modèles de concentration (méthode RRL révisée). Parmi les modèles de distribution, ils ont procédé à la modélisation des installations d’infiltration au moyen de trois méthodes : le modèle des eaux pluviales réelles, le modèle de réduction quantitative constante, et le modèle de stockage et d’infiltration, et ont également précisé les caractéristiques de chaque méthode.
ABSTRACT
One current reason why stormwater infiltration facilities have failed to come into wide use is a lack of understanding of the quantitative and continuous effectiveness of their infiltration performance.
Data for infiltration performance are extremely broadly scattered between individual facilities and it is time-consuming, labour-intensive, and costly to measure the infiltration performance of individual facilities. Therefore, the authors proposed a method of performing a planar evaluation of runoff reduction effectiveness of facilities, which combines modelling a study district and monitoring its stormwater runoff, and performed a case study of this method.
They modelled the study district using distributed models (MOUSE) and a lumped model (revised RRL method). And among the distributed models, they modelled infiltration facilities using three methods: the effective rainfall model, constant quantity reduction model, and storage and infiltration model, clarifying the characteristics of each method.
KEYWORDS
1
Introduction
The infiltration of stormwater in cities is counted on to not only prevent flooding by reducing surface runoff, but to provide multi-faceted effects including mitigating water pollution caused by rainfall— water overflowing combined sewer systems during rainfall or by non-point source load—or rehabilitating the water cycle by, for example, restoring dried up springs.
Well-known representative examples of stormwater infiltration in Japan include the stormwater runoff control type sewer which Tokyo first introduced in Nerima Ward etc. in the 1980s or the system which the Japan Housing Corporation (name at that time) provided at Akishima Tsutsujigaoka Heights in 1981.
Through these experiences, Technical Guidelines , and the Manual have been provided as stormwater infiltration is now gaining recognition as a technology which has been established to a certain level. But many points remain unclear and flood control measures are faced with problems such as the change of infiltration performance after installation and the wide scattering of the performance value among infiltration systems with identical structures installed at different locations in a narrow area, and so on. But little has been done to quantitatively and continually evaluate infiltration effectiveness of facilities which have been installed. As a result, a lack of understanding of quantitative and continuous effectiveness is the reason for the failure of stormwater infiltration facilities to come into wide use. To contribute to the resolution of these problems, the authors have collected existing tracking survey data concerning individual infiltration facilities from Tokyo and from ordnance-designated cities in order to clarify change of infiltration capacity over years, obtaining data for stormwater infiltration inlets at 93 locations (tracked for from 1 to 20 years) and stormwater infiltration trenches at 23 locations (tracked for from 1 to 20 years). The results of the analysis clarified that infiltration performance tends to decline uniformly over time and that data is extremely scattered between individual facilities. And infiltration performance is measured by the constant water level method: injecting water to maintain a constant water level in the infiltration facility and identifying the value when the injection quantity has stabilized as the infiltration performance. This means that measuring infiltration performance is very time-consuming, labor-intensive, and costly.
Under such circumstances, it is assumed to be necessary to apply a new more rational method of quantitatively evaluating infiltration performance to replace measuring the performance of individual infiltration facilities to evaluate each one’s infiltration effectiveness based on the value obtained. So the authors have proposed a method of performing a planar evaluation of runoff reduction effectiveness—a method which combines modelling a study district and monitoring its stormwater runoff—and performed a case study of this method. The study district was modelled using distributed models (MOUSE) and a lumped model (revised RRL method) clarifying the characteristics of both methods. And among the distributed models, they referred to existing documents to model infiltration facilities using three methods—the effective rainfall model, constant quantity reduction model, and storage and infiltration model—clarifying the characteristics of each method.
2
Methods
2.1
Surveyed district
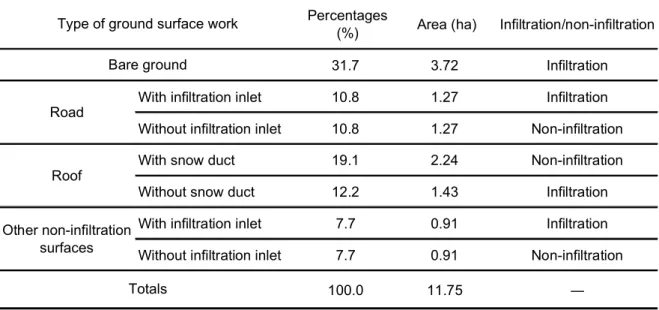
The surveyed district is, as shown in Figure 1, an 11.75ha residential neighborhood served by a combined sewer system. Characteristics of the percentage land use distribution are, as shown by Table 1, snow ducts installed on some homes because snow is observed falling in this neighborhood during the winter, and snow and rain which have fallen on the roof flowing directly into the sewer systems through the interior of the houses. Other non-infiltration surfaces are concrete surfaces inside the houses and paved parking lots.
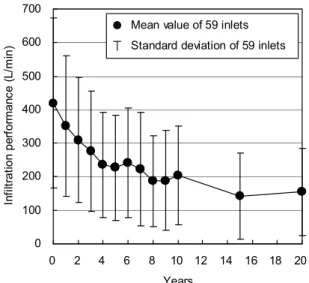
Within the district, extremely large stormwater infiltration inlets are installed at 160 locations as shown in Figure 2, and these account for 1/2 of roadway inlets installed in the district. And as Figure 3 shows, the infiltration performance values of infiltration inlets at 59 locations were measured by the constant water level method once a year for 10 years after installation and once every 5 years from the tenth to the twentieth year after installation. The results show that the infiltration performance was stable beginning 15 years after installation, and in the twentieth year, the average value fell to about 40% of its original value, or to 150 liter/minute• inlet. This survey was conducted in the twenty-third year since
Flow rate monitoring point
Rainfall monitoring point
Study district (combined sew er system: 11.75ha) Stormw ater infiltration inlet (160 locations) Modeled sew er pipes(combined pipes)
Percentages
(%) Area (ha) Infiltration/non-infiltration
31.7 3.72 Infiltration
With infiltration inlet 10.8 1.27 Infiltration Without infiltration inlet 10.8 1.27 Non-infiltration
With snow duct 19.1 2.24 Non-infiltration
Without snow duct 12.2 1.43 Infiltration
With infiltration inlet 7.7 0.91 Infiltration Without infiltration inlet 7.7 0.91 Non-infiltration
100.0 11.75 ―
Totals
Type of ground surface work
Road
Bare ground
Roof
Other non-infiltration surfaces
installation of the infiltration inlets. In this district, flow rate observations were done at the same locations as this survey before and after installation of the infiltration inlets, and the infiltration effectiveness was evaluated using the lumped model (revised RRL method), so it is possible to analyze change of infiltration effectiveness over time by comparing the earlier findings with these data. Judging from the above, this neighborhood was selected as the study district for this survey, because observations of stormwater runoff quantity from the district were made before and after installation of the infiltration inlets, and because data such as change of infiltration performance over years have been accumulated.
Figure 1. Outline of the Surveyed District
Overflow pipe
(to sewer main) □0.5m×0.5m
□1m×1m
1m
Porous concrete or perforated concrete (infiltration part material)
Uniform grain crushed stone Permeable sheet φ150mm φ150mm Curbstone
Grating cover Steel cover
0.000 0.002 0.004 0.006 0.008 0:00 3:00 6:00 9:00 12:00 15:00 18:00 21:00 0:00 Time F lo w r ate ( m 3/ s) Weekday average Holiday average Average of all days
0 100 200 300 400 500 600 700 0 2 4 6 8 10 12 14 16 18 20 Years In fil tr ati on p er fo rm an ce ( L/mi
n) Standard deviation of 59 inlets Mean value of 59 inlets
2.2
Flow rate and rainfall monitoring
As shown by Figure 1, for about 6 months from August 2008 until January 2009, the flow rate inside the sewer pipes was monitored at the runoff part of the study district and the rainfall was monitored at a location adjoining the study district. The flow rate was observed similarly by collecting data at one minute intervals using a surface velocity flow meter (Sewer Techno-Solution Inc., AVL-3001 Series surface velocity flow meters), and the rainfall was observed using a tipping bucket type rain gauge (Ota Keiki Seisakusho: 0W-34) which tips after each 0.1mm of rain, obtaining data at 1 minute intervals.
The study district is served by a combined sewer system, so to calculate the stormwater flow rate, the waste water quantity must be subtracted from the observed value. Therefore, as shown in Figure 4., the average flow rate on a clear day was calculated and used as the waste water quantity. In this case it is a value smaller than the rainfall and trends are similar on weekdays and holidays, so the study was done using the average value for all days.
2.3
Modeling methods
The study district was modeled by performing analysis using distributed models (MOUSE) and a lumped model (modified RRL method), clarifying the characteristics of all methods.
And among the distributed models (MOUSE) used to model the infiltration facilities, with reference to existing documents 1)2), three methods—the effective rainfall model, constant quantity reduction model, and storage and infiltration model—were used, clarifying the characteristics of each method. The lumped model was limited to the storage and infiltration method.
Figure 2. Outline of the Structure of an Infiltration Inlet Figure 3. Change over Time of Infiltration performance
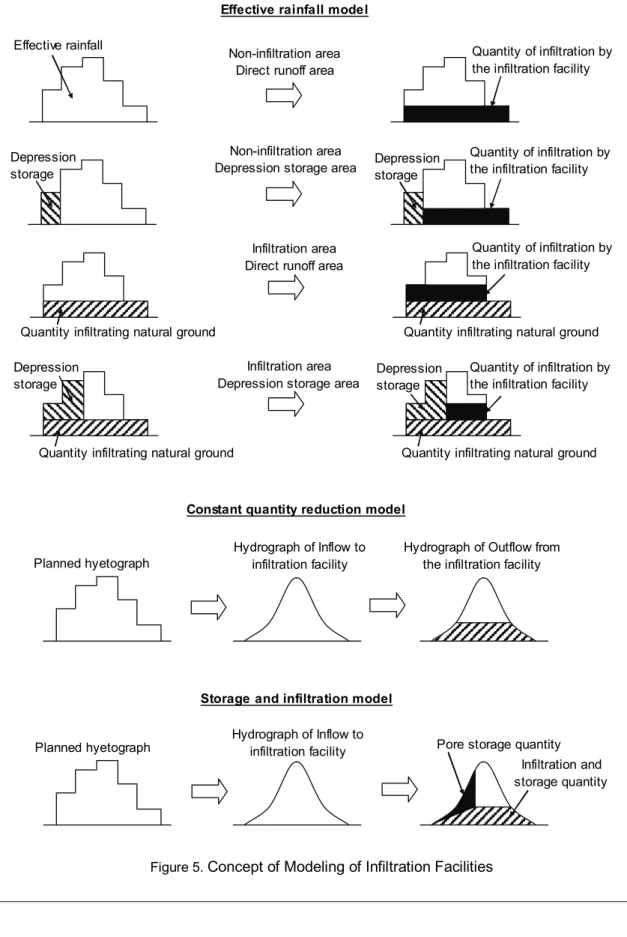
The following are outlines of each method. As shown in Figure 5, the effective rainfall method is a method of analysis using effective rainfall which is obtained by subtracting the quantity of reduction achieved by the infiltration facility infiltration performance from the actual rainfall in the study district. The constant quantity reduction model is a method of calculating the actual runoff by subtracting the quantify infiltrated by the infiltration facility from the stormwater runoff.
The storage and infiltration model is a method of calculating the quantity stored and quantity infiltrated based on the influent area, infiltration performance, and facility capacity of the infiltration capacity, then subtracting the results from the runoff quantity.
Figure 5. Concept of Modeling of Infiltration Facilities
Effective rainfall Non-infiltration area Direct runoff area
Quantity of infiltration by the infiltration facility
Infiltration area Direct runoff area
Quantity of infiltration by the infiltration facility
Quantity infiltrating natural ground Quantity infiltrating natural ground
Infiltration area Depression storage area
Quantity infiltrating natural ground
Depression storage
Quantity of infiltration by the infiltration facility
Quantity infiltrating natural ground Depression
storage Depression storage
Non-infiltration area Depression storage area
Quantity of infiltration by the infiltration facility Depression storage Hydrograph of Inflow to infiltration facility Planned hyetograph Hydrograph of Inflow to infiltration facility Planned hyetograph
Hydrograph of Outflow from the infiltration facility
Pore storage quantity Infiltration and storage quantity
Storage and infiltration model Constant quantity reduction model
0
10
20
30
40
17:00
19:00
21:00
23:00
1:00
3:00
5:00
7:00
9:00
Runo
ff
(
m
m
/hr
)
0
2
4
6
8
10
R
ai
n
fa
ll
(m
m
/5
m
in.
)
Time
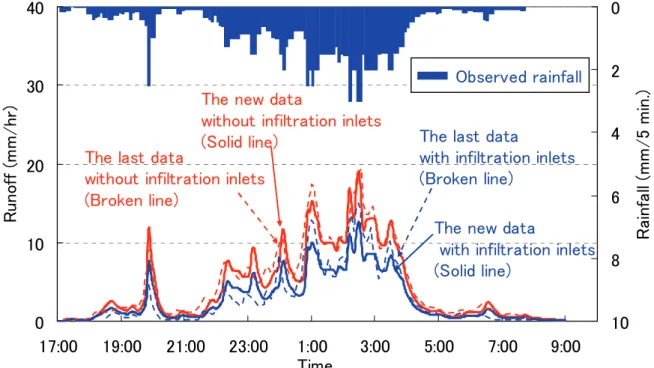
Observed rainfall
The last data
with infiltration inlets
(Broken line)
The last data
without infiltration inlets
(Broken line)
The new data
without infiltration inlets
(Solid line)
The new data
with infiltration inlets
(Solid line)
3
Results and discussion
3.1
Infiltration performance
When the infiltration performance of an infiltration inlet was calculated using models constructed based on the observed data (distributed model (MOUSE) and storage and infiltration model), and the average value of 150 liters/min. in 2005 (after 20 years of service) was used to calculate the runoff flow rate using rainfall which was initially observed, as shown by Figure 6, the value was almost identical to the analysis data at installation time, and it was impossible to confirm any change of infiltration performance.
As stated above, the infiltration performance of individual infiltration inlets fell to 40% of the initial performance according to data (average infiltration performance: 150 liters/min.) for 59 locations (about 40% of all locations) from the most recent year, 2005 (after 20 years of service).
When the influent stormwater to infiltration inlets was calculated, it was judged that in both the installation time case and present study case, it was smaller than the infiltration performance of the infiltration inlet (infiltration quantity of 65mm/h which was calculated based on average infiltration performance of 150 liters/minute after 20 years of service), that the stormwater which flowed into the infiltration inlet completely infiltrated, and it was decided that rainfall intensity of rainfall sufficient to perform calibration of the infiltration capacity and storage of an infiltration inlet was not observed. In this study, the goal was clarification of characteristics of infiltration facility modeling methods, and the objects of the study included rainfall sufficient to exceed high infiltration performance, so it was necessary to set the infiltration performance, and later, analysis was performed using data for 2005 (after 20 years of service).
3.2
Model analysis results
3.2.1 Calibration
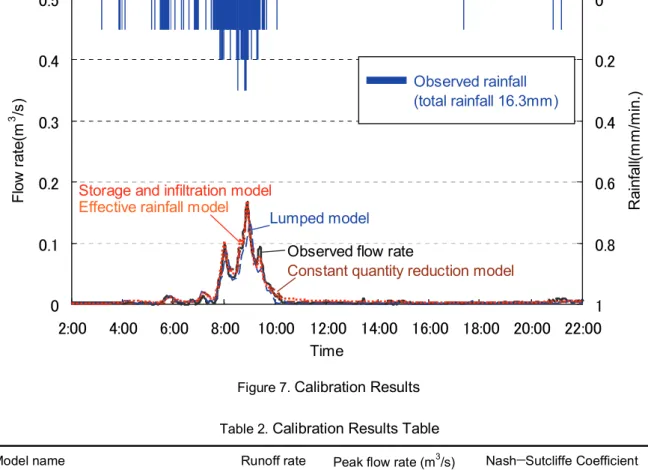
Figure 7 and Table 2 show the results of calibration applying each method. The runoff rates in the table show percentages of total rainfall in the study district which runs off from this district through sewer pipes.
The rainfall used for the calibrations was the peak observed during the observation period, but even in this case, because of the large infiltration performance, the rainwater which flowed into the infiltration inlets completely infiltrated.
Model name Runoff rate Peak flow rate (m3/s) Nash−Sutcliffe Coefficient
Observed values 33.3% 0.168
-Effective rainfall model 34.2% 0.167 0.975 Constant quantity reduction model 28.0% 0.151 0.966 Storage and infiltration model 34.2% 0.167 0.975
Lumped model 27.3% 0.139 0.846
2008/8/27(有効降雨モデル)
0
0.1
0.2
0.3
0.4
0.5
2:00
4:00
6:00
8:00
10:00 12:00 14:00 16:00 18:00 20:00 22:00
流量
(m
3/s)
0
0.2
0.4
0.6
0.8
1
降雨(
m
m
/分
)
降雨 実測流量(m3/s) 計算値(m3/s) Time R ain fa ll( m m /m in .) Fl ow ra te (m 3 /s ) Lumped modelConstant quantity reduction model Effective rainfall model
Storage and infiltration model
Observed flow rate
Observed rainfall (total rainfall 16.3mm)
The distributed model shows that regardless of which method is used, there is no significant difference in either the peak or runoff quantities. However, because the stormwater used for this calibration does not run off from the infiltration inlets, the values obtained by the effective rainfall model and the storage and infiltration model were the same.
With the lumped model, although both the runoff rate and the peak flow rate were under-calculated a little, it was decided that adequate precision was obtained.
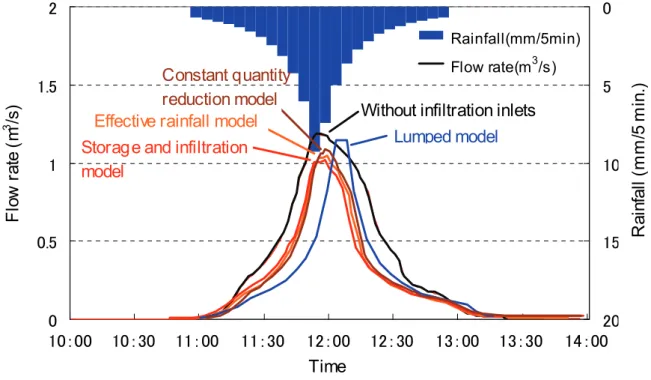
3.2.2 Centralized concentrated type 50mm/hr rainfall
Next, Table 3 and Figure 8 show the runoff flow rate calculated for centralized concentrated type rainfall of 50mm/hr using the calibrated models.
The distributed model shows that regardless of which method is used, there is no significant difference in either the peak or runoff quantities.
With the lumped model on the other hand, the peak is delayed, the reduction rate is also small, and there is a tendency for it to be a little different from the distributed model. The difference in the rainfall scale of the parameter setting rainfall and analytic rainfall (setting of parameters according to rainfall scale) is suggested as a factor.
This concludes with the clarification of trends by comparing calculated values, and in order to improve study precision, large rainfall should be observed and verification done with actually measured values.
Figure 7. Calibration Results
Model name Runoff rate reduction rateRunoff Peak flow rate (m3/s)
Peak flow rate reduction rate
Without infiltration inlets 49.3% - 1.185
-Effective rainfall model 34.2% 30.6% 1.04 12.1%
Constant quantity reduction model 34.2% 30.6% 1.071 9.6%
Storage and infiltration model 33.3% 32.5% 1.003 15.4%
Lumped model 32.5% 34.1% 1.138 3.9%
3.3
Characteristics of each model
3.3.1 Effective rainfall model (distributed model)
It can be stated that among the distributed models, the effective rainfall model, constant quantity reduction model, and the storage and infiltration model all are effective evaluation methods which provide high precision regarding the observed flow rate.
The results of this study have clarified the characteristics of the models, and the model most appropriate to the characteristics of each study district and the goals should be selected.
The effective rainfall model can set the land use percentages within the model according to land use in the study district and also the initial storage capacity and infiltration performance of each land use, permitting precise reproduction of actual phenomena.
And because analysis can be performed easily using a distributed model generally available on the market, it is possible to efficiently build and evaluate models.
But because it is a method which does not consider the storage effects of infiltration inlets, in cases such as this where the infiltration inlets are constructed to provide large storage capacity inside the inlets, the runoff control effects might be undervalued.
Figure 7. Runoff Flow Rate Calculation Results (50mm/hr rainfall)
Table 3. Calculation Results Table
0
0.5
1
1.5
2
10:00
10:30
11:00
11:30
12:01
12:33
13:04
13:34
流量
(m
3/s
)
0
5
10
15
20
降雨(
m
m
/5分)
降雨 計算値(m3/s) 浸透ますなし 集中型モデル 一定量差引きモデル 貯留浸透モデル 有効降雨モデル時刻
10:00
10:30
11:00
11:30
12:00
12:30
13:00
13:30
14:00
F
lo
w
r
ate
(
m
3/s)
Ra
in
fa
ll (
m
m
/5
m
in
.)
Time
Lumped model
Rainfall(mm/5min) Flow rate(m3/s)Without infiltration inlets
Constant quantity
reduction model
Effective rainfall model
Storage and infiltration
model
3.3.2 Constant quantity reduction model (distributed model)
The constant quantity reduction model is a method which subtracts a fixed quantity from the quantity of water run off from the ground surface according to the infiltration performance of the infiltration inlets, and the ground surface runoff analysis and analysis inside pipes must be done separately, so it involves more work than the effective rainfall model.
To subtract the flow rate, it is necessary to subtract the quantity which actually infiltrates instead of the infiltration performance of the infiltration inlets.
3.3.3 Storage and infiltration model (distributed model)
The storage and infiltration model is a model which predicts the capacity inside of infiltration facilities as the quantity stored, and which can appropriately evaluate the runoff control effectiveness of each facility.
However, it is difficult to clearly distinguish infiltration performance and storage effectiveness solely through calibration based on flow rate observation results, and so in order to correctly evaluate runoff control effectiveness including the storage effectiveness, it is necessary to estimate the quantity stored in infiltration inlets through an entire drainage basin by clarifying the structures of each kind of infiltration inlet.
3.3.4 Lumped models
It is easier to construct lumped models than distributed models, so it is an evaluation method which effectively obtains sufficient analysis precision by performing calibration.
However, there are also cases where it is assumed that parameters adjusted to rainfall of a fixed scale are not very appropriate to rainfall of a different rainfall scale. It is, therefore, necessary to calibrate observed data of a similar scale by clarifying the scale of rainfall which is evaluated to adjust parameters (planned rainfall of 50mm for example).
4 Summarization
It is thought that in order to quantitatively evaluate infiltration performance, it is necessary to apply a new more rational method to replace methods which evaluate infiltration performance based on values obtained by measuring the performance of individual infiltration facilities.
So the authors proposed and performed a case study of a method of evaluating planar runoff control effectiveness which combines modeling the study district and monitoring stormwater runoff.
The study district was modelled using distributed models (MOUSE) and a lumped model (revised RRL method). And the distributed models used to model the infiltration facilities were the three methods— the effective rainfall model, constant quantity reduction model, and storage and infiltration model— clarifying the characteristics of each method.
As a result of analysis of the modelling of the infiltration inlets by the distributed model, using the effective rainfall model, constant quantity reduction model, and the infiltration and storage models, it has been revealed that all three methods obtain sufficient precision.
With the lumped model, slight differences with other methods with regard to reproduction calculations and rainfall of varying scale are observed, suggesting the need to set parameters according to the target rainfall scale.
In this study, the infiltration inlets were large scale, and at the observed rainfall intensity there was no runoff from the infiltration inlets (overflow to the sewer pipes) and it was impossible to calculate the infiltration performance. Therefore, the study was done using infiltration performance results for each infiltration inlet.
Future plans call for a case study of a district where small infiltration inlets are installed (condition such that stormwater runoff from infiltration inlets is observed) in order to apply this method as a method of evaluating change over time of infiltration performance.
LIST OF REFERENCES
JIWET (Japan Institute for Wastewater Engineering Technology). (2001). Sewerage rainwater infiltration technical manual (in Japanese)
ARSIT (Association for Rainwater Storage and Infiltration Technology). (2006). Enlarged and revised edition of the Technical guidelines for rainwater infiltration facilities (draft), Surveying and planning. (in Japanese)
ARSIT (Association for Rainwater Storage and Infiltration Technology). (2007). Enlarged and Revised Edition of the Technical guidelines for rainwater infiltration facilities (draft), Construction, execution, and maintenance. (in Japanese)
J.Endo, H.Fujiwara, N.Tamoto and T. Sakakibara. (2009). Deterioration of rainwater infiltration facilities with time.