Assessment of Soil Microbial Communities in
Carotenoid-Biofortified Rice Ecosystem
Soo-In Sohn*, Young-Ju Oh1, Byung-Yong Kim2, Bumkyu Lee, Si-Myung Lee, Sung-Dug Oh, Gang-Seob Lee, Doh-Won Yun, and Hyun-Suk Cho
National Academy of Agricultural Science, Jeonju, 560-500, Korea 1
Institute for Future Environmental Ecology Co., Ltd, Jeonju, 561-842, Korea 2ChunLab, Inc., Seoul, 151-742, Korea
(Received: August 20 2015, Revised: October 16 2015, Accepted: October 20 2015)
This study was conducted to investigate the effect of Psy-2A-CrtI (PAC), a genetically modified (GM) rice with enhanced β-carotene, on the soil microbial community. The soil used to cultivate GM rice and its wild-type, Nakdong, was analyzed for population density, denaturing gradient gel electrophoresis (DGGE), and pyrosequencing. It was found that the bacterial, fungal and actinomycetes population densities of the PAC soils were within the range of those of the non-GM rice cultivar, Nakdong. The DGGE banding patterns of the GM and non-GM soils were also similar, suggesting that the bacterial community structures were stable within a given month and were unaffected by the presence of a GM plant. The pyrosequencing result showed a temporal difference in microorganism taxon and distribution ratio, but no significant difference between GM and non-GM was found. The persistence of the transgene DNA in the plant and surrounding soil were investigated for different time periods. There were differences in the persistence within the plant depending on the gene, but they could not be detected after 5 weeks. Also the transgenes were not detected in the surrounding soil. These results indicate that soil microbial communities are unaffected by the cultivation of a PAC rice within the experimental time frame.
Key words: Genetically modified rice, Soil microbial community, DNA persistence
Comparison of bacterial composition in Nakdong and PAC rhizosphere soils (Aug. soil) 1)
*Corresponding author : Phone: +82632384712, Fax: +82632384704, E-mail: sisohn@korea.kr §
Acknowledgement : This study was carried out with the support of “Research Program for Agricultural Science & Technology Development (Project No. PJ0096092015)”, National Academy of Agricultural Science, Rural Development Administration, Republic of Korea.
Introduction
The most widely cultivated genetically modified (GM) crops across the world are herbicide tolerant crops and Bt crops where 99.4 million hectares of herbicide resistant GM crops and 28.8 million hectares of Bt crops are being cultivated as of 2013 (James, 2013). Before a GM crop is cultivated, possible short-term and long-term effects on the environment must be thoroughly examined. Soil microbial community is one of the potential targets and is most directly affected by GM crop cultivation. Also, considering the role of the soil microbial community on the ecosystem, an evaluation of the safety of cultivation is essential.
The rhizosphere soil contains most of the microbiota and the interaction between the plant and microorganisms that occurs in the rhizosphere is one of the main factors that determine a plant’s condition and growth. It has been reported that the root exudates control what organisms can inhabit the rhizosphere (Bardgett et al., 1999; Lynch, 1994), and alteration of a transgenic crop’s root exudates can alter the rhizosphere microbial community structure. Consequently many studies have looked at the impact of cultivating GM crop on the soil microbial community and techniques to assess this has also advanced over the years.
Study on how GM crop impact the soil microbiota has mostly been carried out on Bt crops (Barriuso etal., 2012; Icoz et al., 2008; Wei et al., 2012). Studies using different
methods on different Bt crops has shown a range of
results, where the microbiota is unaffected, shows negligible impact or has a significant impact (Icoz et al., 2008). The reasons and implications behind this difference in how Bt crop affect the soil microbial community structure is unclear. This is because the knowledge on the complex diversity of soil microbial community is limited and only a small part of the soil microorganism can be cultured and analyzed with standard analytical techniques (Motavalli et al., 2004). As such, various aspects of the soil microbial community can be analyzed by using a combination of several analytical techniques and produce a more significant
result (Landi et al., 2000). Until now, study on how GM
crop impact the soil microbiota was analyzed by culti-vation, molecular biological techniques such as DGGE or temperature gradient gel electrophoresis (TGGE), or soil enzyme-substrate utilization analysis such as community level physiological profiling (CLPP) of soil microbial co-mmunity. However development of pyrosequencing, a next-generation sequencing technique, has made it possible to analyze a wider range of microorganisms and is now being applied to study the effect of GM crops on the soil
microbial community (Barriuso et al., 2012; Hur et al.,
2011; Lee et al., 2011). Numerous studies have shown
how transgenes from GM crops can persist within the soil for a prolonged period (Gebhard and Smalla, 1998; Hay et al., 2002; Lee et al., 2007). As soil microorganisms can accept foreign DNA and incorporate it within their genome, it is possible for this transgene to be transferred to the soil microorganism by horizontal gene transfer when cultivating GM crops (Widmer et al., 1997; Bertolla and Simonet, 1999). Moreover the longer the transgene persists within the soil, the higher the probability of horizontal gene transfer occurring. As such, analyzing the persistency of the transgene is an important part of a GM crop’s environment risk evaluation.
PAC (Psy-2A-CrtI) transgenic rice accumulates β-carotein in the rice endosperm (Ha et al., 2010). PAC construct, consisting of two carotenoid biosynthetic genes, Psy from Capsicum and CrtI from Pantoea linked by 2A (Robertson etal., 1985) under the control of the rice globulin promoter, was used for Agrobacterium-mediated rice transformation. The β-carotein in PAC transgenic rice converts to Vitamin A in human. Vitamin A deficiency is prevalent in many parts of the world where poorer community members rely on rice as their major food source. People who lack adequate amounts of this vitamin can have vision problems or even blindness as a result. Incorporating vitamin A into the major crop such as rice, wheat and maize will enhance their nutritional value. However, metabolites can directly impact the root exudates and this can affect the rhizosphere microbiota. For example, a study showed that in the soil used to cultivate a transgenic crop that syn-thesizes opine, the population of microorganism that break down this metabolite increased (Oger et al., 1997, 2000). This study investigated whether a transgenic rice with altered metabolites due to β-carotein fortification can impact the soil microbial community. To achieve this, soil chemical composition, soil microbial community density, DGGE and pyrosequencing analysis was carried out on the soil of β-carotein-fortified transgenic rice, PAC, and its wild-type, Nakdong. Also, the persistency of transgene
from PAC rice and surrounding soils was analyzed with
PCR using specific primers that targeted the integrated sense & antisense MAR, Psy2A, barNOS, PinII35S,NOSMAR, and P35Sbar.
Materials and Methods
Site and sampling The experimental plot for Nakdong and PAC rice to investigate their effect on soil microbial community was set up in an isolated GMO field at the NAAS (National Academy of Agricultural Science) located
in Suwon, Korea. Nakdong and PAC were each plotted
4 x 4 m in size. The rice seeds were sown on a seedling box then transplanted after 3 weeks early June, 2011. Soil samples can largely be classified into before transplant (February, March and May) and after transplant (July and August). The before transplant samples were collected
from each of the soils where Nakdong and PAC rice
were to be grown in three biological repeats. Bulk soil of February, March, May and rhizosphere soil of July and August was collected, dried, and then passed through a 2 mm sieve for further study. The rhizosphere soil sample was collected in three repeats by uprooting the rice and removing the surrounding soil.
Soil Physicochemical Analyses Chemical analysis of the soil was done following the NAAS soil and plant analysis method (NIAST, 2000), pH was measured using a pH meter with soil and distilled water at a 1:5 ratio respectively, total nitrogen and carbon composition was obtained via the Elemental analyzer (Vario Max CN, Ele-mentar, Germany), Lancaster method was used to measure available phosphate via calorimetry and exchangeable ions such as calcium, potassium, magnesium and sodium was diffused with 1N Ammonium acetate then analyzed using ICP (Inductively coupled plasma-optical emission spectroscopy - Integra, GBC, Australia).
Microbial Community Density Analysis The density of soil microbes was assessed by enumeration of cultured total bacteria, fungi and actinomycetes after inoculating soil samples in each selective media. Ten gram of the collected sample was immersed in 90 ml of sterilized 0.85% NaCl solution then suspended for 30 min using a shaking incubator (Vision Co., Bucheon, Korea) with 200 rpm. A series of dilutions were made using the suspension, then total bacteria were cultured by smearing them onto a R2A agar (Difco, Detroit, USA) containing cycloheximide (0.05g/L), fungi were cultured on a Rose Bengal media (Difco, Detroit, MI) containing chloramphenicol (0.02%) and actinomycetes were cultured on a starch caseinate agar. The smeared mediums with bacteria, fungi and actinomycetes were incubated at 28°C for 2, 4, 5 days respectively, then the number of colonies counted. The number of micro-organisms for each sample was calculated by counting the number of colonies in each of the three petridishes then using the average value as the colony forming unit (cfu g-1 dry soil).
DNA extraction and DGGE Analysis Metagenomic DNA was extracted using FastDNA Spin Kit (Qbiogen, Carsbad, U.S.A.) from the soil according to manufacturer’s manual. The 16S rRNA was amplified using PCR reaction for DGGE analysis. The primers used for PCR were the
1392r-1070F incorporating a eubacteria’s V9 region (Ahn et al., 2006), the primer sequence being 1392r: 5’- CGCC CGCCGCGCCCCGCGCCCGGCCCGCCGCCCCCGCCC CACGGGCGGTGTGTAC-3’, 1070F: 5’- ATGGCTGTCG TCAGCT -3’. Volume of the PCR reaction was 50 µL, consisting of 5 µL of 10x PCR buffer, 10 ng of template DNA, 25 pmol of each primers, 200 µM of each dNTP
and 2.5 U of f-Taq DNA polymerase (Solgent, Daejeon,
Korea). The PCR condition involved denaturation at 95°C for 5 min, 95°C for 1 min, 55°C for 1 min, and 72°C for 1 min and was carried out for 30 cycles. The last step involved a 7 min reaction at 72°C. The PCR product was electrophoresed in an 8% acrylamide gel with a formamide concentration gradient of 40-70% using Dcode Universal Mutation Detection System (Bio-Rad, Hercules, U.S.A.). The unfolded DNA was dyed with SYBR Green I (Cambrex BioScience, Rockland, ME, USA) and EtBr and was observed using Gel Doc 2000 (Bio-Rad Laboratories, Hercules, CA) under UV transilluminator.
Pyrosequencing Analysis The extracted metagenomic DNA was used for pyrosequencing analysis as in previous reports by Hur et al.(2011). PCR amplifications were per-formed using a C1000 Touch thermal cycler (Bio-Rad, CA, USA) and barcorded fusion primers (http://www. ezbiocloud.net/resource/M1001). A total of 100 ng template
DNA was added to the PCR reaction (total of 50 μL),
which contained Ex Taq buffer, 0.2 mM each dNTP, 0.5
μΜ each primer, and 2 units Ex Taq (Takara, Otsu,
Japan). After initial denaturation (94°C, 5 min) the PCR reaction was carried out using the Touch-down program to undergo 10 cycles of denaturation (94°C, 30 s), annealing (60°C, 45 s), extension (72°C, 90 s) where the annealing temperature was decreased by 0.5°C for each subsequent cycle. Further 20 cycles of denaturation (94°C, 30 s), annealing (55°C, 45 s), extension (72°C, 90 s) were carried out. The amplified products were confirmed by 2% agarose gel electrophoresis and visualized using the Gel Doc system (Bio-Rad). Amplicons were purified using a QIAquick PCR purification kit (Qiagen, CA, USA) and quantified using a PicoGreen dsDNA Assay kit (Invitrogen, CA, USA). Equimolar concentrations of each amplicon from different samples were pooled and purified using an AMPure bead kit (Agencourt Bioscience, MA, USA) and then amplified on sequencing beads by emulsion PCR. Sequencing reactions were performed using a Roche GS FLX Titanium system at ChunLab, Inc (Seoul, Korea). According to the manu-facturer’s instructions.
Data analysis of pyrosequences The obtained sequences were compared and classified with EzTaxon database (http://www.ezbiocloud.net). The number of OTU was
Table 1. Soil chemical properties in the soil of Nakdong and Psy-2A-CrtI rice. Month (2011) Soil pH P‡ (mg kg-1) EC§ (dS m-1) T-N¶ (%) OM∮ (g kg-1) Cation (cmol kg-1) K Ca Mg Na Feb. ND † 6.0±0.03 49.0±0.45 0.8±0.00 0.18±0.01 22.0±0.40 0.49±0.00 6.9±0.05 1.7±0.01 0.3±0.01 PAC 6.4±0.03 34.0±0.55 0.6±0.00 0.18±0.00 19.0±0.34 0.50±0.00 7.8±0.07 2.0±0.02 0.3±0.00 Mar. ND 6.3±0.02 56.0±2.25 0.6±0.01 0.19±0.01 20.0±0.20 0.54±0.00 7.1±0.16 1.8±0.03 0.3±0.01 PAC 6.4±0.01 38.0±0.55 0.6±0.00 0.18±0.00 18.0±0.40 0.58±0.00 7.1±0.08 1.9±0.02 0.3±0.00 Jul. ND 6.3±0.02 67.2±0.26 0.3±0.00 0.17±0.00 19.4±0.53 0.38±0.00 7.0±0.14 0.98±0.03 0.2±0.00 PAC 6.3±0.02 42.6±0.35 0.3±0.00 0.16±0.00 17.1±0.34 0.38±0.00 7.1±0.17 2.14±0.06 0.2±0.00 Aug. ND 6.1±0.02 66.7±0.50 0.3±0.00 0.18±0.00 19.9±0.40 0.38±0.00 6.7±0.12 1.82±0.02 0.2±0.00 PAC 6.5±0.02 51.3±0.52 0.2±0.00 0.16±0.01 18.0±0.87 0.36±0.00 7.2±0.01 2.19±0.02 0.2±0.00
†Values indicate the mean ± standard deviation from three replications; ‡Available phosphorus; §Electrical conductivity; ¶Total
Nitrogen; ∮Soil organic matter. ND, Nakdong; PAC, Psy-2A-CrtI
calculated from a sequence group that shows a 97%
sequence homology based on TBC de novo clustering
algorithm (Lee et al., 2012). To identify the bacterial taxa that are present in Nakdong soil, but not in PAC rice soil or vice versa, taxon exclusive or (XOR) analysis was performed using CLcommunity program (ChunLab, Seoul, Korea). For this analysis, the number of reads for all soil samples was normalized using the program prior to carrying out the XOR comparison analysis at phylum, class, order, family, genus and species levels.
The similarity between each pair of communities was estimated using the Fast UniFrac web interface (Hamady et al., 2010) and visualized using unweighted pair group method (UPGMA) dendrogram.
DNA persistence PAC and Nakdong rice seeds were surface sterilized and germinated at Wagner’s pots (Ishizawa, Tokyo, Japan). These were grown in a greenhouse for 3-weeks and then leaf samples were collected from both transgenic and WT plants. The litterbags (1 x 2 mm mesh size, 10 x 12 cm litterbag size) containing 3 g of GM and non-GM rice leaf segments were buried vertically at a depth of 10 cm in a rice paddy soil filled pot. These samples were then left from 1 to 5 weeks. The pots were watered periodically like rice paddy condition. The per-sistency of DNA was analyzed by extracting the DNA from a plant buried in soil and the soil around the litterbag. The presence of transgene were investigated between the periods of 1 to 5 weeks. DNA was detected by PCR. PCR amplification was performed in a 50 µL reaction mixture containing 10X PCR buffer [160
mM(NH4)2SO4, 670 mM Tris/HCl, pH 8.8, 25 mM
MgCl2, 0.1% Tween 20], 1 µL template DNA, 25 pmol
of each primer, 200 µM of each dNTP (GeneCraft, Munster,
Germany), and 2.5 U of Taq polymerase (GeneCraft,
Munster, Germany). PCR cycles consisted of an initial denaturation step at 95°C for 5 min, followed by 30
cycles of 95°C for 1 min, 55°C for 1 min, 72°C for 1 min, and a final extension at 72°C for 7 min.
Results and Discussion
Physicochemical characteristics of soil samples A difference in the soil chemical composition can affect the soil microorganism population, so the rhizosphere soil’s
chemical composition between PAC and Nakdong were
analyzed including soil pH, available phosphate, electrical conductivity, cations, total nitrogen and organic content (Table 1). During the period investigated, the soil pH for
Nakdong was 6.0~6.3 and PAC rice soil was 6.3~6.5
showing no significant difference, but these values were slightly higher than the pH (5.6) of an average plot soil in South Korea (Jung et al., 1998). The soil pH affects nutrient availability of the soil where generally high acidity (pH 4.5) causes low availability and low acidity (about pH 6.5) causes high availability. The available phosphate
of Nakdong was 49~67.2 mg kg-1and PAC rice was 34~
51.3 mg kg-1, showing a significant difference between
the two. However considering the average available phos-phate of the plot soils in South Korea being 95 mg kg-1, both samples showed a comparatively low availability. The soil electrical conductivity of Nakdong was 0.3~0.8 dS m-1 and PAC rice was 0.2~0.6 dS m-1, showing similar levels. It was also found that the total nitrogen levels of two rice was similar. Content of cations such as K, Ca, Mg, Na were also found to be similar between Nakdong and PAC rice soil.
Soil microbial community density analysis To inve-stigate the effect on soil microbiota from cultivating PAC rice, the rice rhizosphere soil’s bacteria, actinomycetes and fungi population density were analyzed before transplant (February and March), maximum tillering stage (July) and
Table 2. Number of microbes in the soil of Nakdong and Psy-2A-CrtI.
Month (2011) Microbes ND PAC
Feb. Bacteria (x106) †1.7 ±0.6 19.0 ± 2.0 Actinomycetes (x105) 9.3 ± 2.1 11.0 ± 2.0 Fungi (x103) 2.3 ± 0.6 2.7 ± 0.2 Mar. Bacteria (x106) 1.2 ±0.1‡ 11.3 ± 1.2‡ Actinomycetes (x105) 5.7 ± 1.5‡ 13.7 ± 2.3‡ Fungi (x103) 4.7 ± 1.2‡ 2.0 ± 1.0‡ May. Bacteria (x106) 4.5 ± 11.9 5.9 ± 4.6 Actinomycetes (x105) 1.0 ± 2.6 1.7 ± 2.5 Fungi (x103) 11.6 ± 4.2‡ 10.6 ± 4.2‡ Jul. Bacteria (x106) 7.0 ± 1.0 8.6 ± 1.5 Actinomycetes (x105) 6.0 ± 1.7 9.6 ± 4.0 Fungi (x103) 10.0 ± 1.7 11.6 ± 2.1 Aug. Bacteria (x106) 63.6 ± 12.1 113.3 ± 23.0 Actinomycetes (x105) 1.2 ± 0.3‡ 2.0 ± 0.0‡ Fungi (x103) 4.3± 1.5‡ 12.0 ± 3.0‡ †
Values indicate the colony forming unit(cfu) g-1 wet weight ± standard deviation from three replications. The asterisk denotes a significant difference (t-test, p<0.05). ND, Nakdong; PAC, Psy-2A-CrtI
Fig. 1. DGGE analysis of 16S rDNA V9 region with primers 1070F and 1392r. DGGE profile for February, March, May, July and August soils. M, DGGE molecular weight marker, N, Nakdong, P, PAC.
heading stage (August) (Table 2). The rice rhizosphere soil’s microbial community density was found to be similar between the two rice for each time period except an increase in the soil bacterial population density in August. An increase in temperature during August is suspected to have caused this increase, with factors such as available carbon, soil humidity and temperature being expected to explain most of the change (Cruz-Martínez et al., 2012). The result of this study indicated no significant difference
between the microorganism population density of PAC
and Nakdong except the March and August soil, which is consistent with reports from other studies such as there being no difference in culturable bacteria, fungi, protozoa, nematodes and earthworms numbers between Cry1Ab
trans-genic Bt-maize and non-Bt maize (Saxena and Stotzky,
2001b), as well as the number of bacteria, fungi and protozoa being unaffected whether a soil was treated with refined Cry1Ab and Cry1Ac protein or not (Donegan et al., 1995).
Comparative analysis of the soil microbial community using the DGGE analysis To compare the change in rhizosphere soil microorganism population for each time
period between PAC and Nakdong rice, a DGGE analysis
was carried out. Using PCR, the V9 part of 16S rRNA gene was amplified and the PCR product was analyzed through electrophoresis on an agarose gel, and the expected PCR product of 323 bp was found (data not shown). In
the DGGE profiles of PAC and Nakdong soil, differences
in the bands were found different time periods, but no
significant difference were found between PAC and
Nakdong (Fig. 1). Some differences in band intensity for
the same band between PAC and Nakdong was observed
and is suspected to be the result of heterogeneity in the soil. These results are consistent with there being no
significant difference in the DGGE profile of Cry1Ab
transformed Bt rice and its wild-type (Liu et al., 2008) as well as there being no difference in the bacterial diversity between Bt maize and non-Bt maize (Icoz et al., 2008).
pyro-Table 3. Bacterial diversity indices in Nakdong and Psy-2A-CrtI rice soils. Period (2011) Sample Total No. of Reads Observed phylotypes (OTUs) Average Length (bp) Ace Chao1 † Shannon index Coverage (%) Mar. ND 3,080 1,884 453.7 18,186.8 7,431.7 7.1 50.8 PAC 13,906 3,947 464.8 9,329.8 6,921.1 7.3 85 Aug. ND 1,843 1,272 452.8 10,713.1 5,477.8 6.9 44.1 PAC 2,650 1,862 468.2 15,624.1 7,603.9 7.3 42.8
†Estimates of shannon index were obtained based on 3% differences in DNA sequence alignments. ND, Nakdong; OTU,
operational taxanomic unit; PAC, Psy-2A-CrtI; bp, base pair
Fig. 2. Comparison of bacterial composition in Nakdong and Psy-2A-CrtI soils. A, March, B, August. ND, Nakdong, PAC,
Psy-2A-CrtI, OTU, operational taxonomic unit.
sequencing Pyrosequencing analysis of the pre-transplantation soils from March produced 13,906 and 3,080 16S rRNA
gene sequences for PAC and Nakdong respectively (Table
3). Comparing the microorganism distribution ratio at the Phylum level showed PAC rice soil to consist in the order of Cloroflexi, Proteobacteria, Actinobacteria, Firmicutes, Bacteriodetes, Acidobacteria, and Nakdong soil to consist in the order of Cloroflexi, Actinobacteria, Proteobacteria, Firmicutes, Bacteriodetes, Thermobaculum (Fig. 2A). Analy-zing the soils form August produced 2,650 and 1,843 16S
rRNA gene sequences for PAC rice and Nakdong
res-pectively. Comparing the microorganism distribution ratio
at the Phylum level showed PAC soil to consist in the
order of Proteobacteria, Cloroflexi, Actinobacteria, Firmicutes, Acidobacteria, and Nakdong soil to consist in the order of Cloroflexi, Proteobacteria, Actinobacteria, Firmicutes, Acidobacteria (Fig. 2B).
The dominant microorganism distribution ratio at the
phylum level was very similar between PAC and Nakdong,
which suggests cultivating PAC doesn’t have a significant impact on the soil microorganism community structure.
This result is consistent with a report that used pyro-sequencing analysis to show that the microorganism taxon of a drought-resistant rice and its wild-type, Nakdong was similar (Lee et al., 2011).
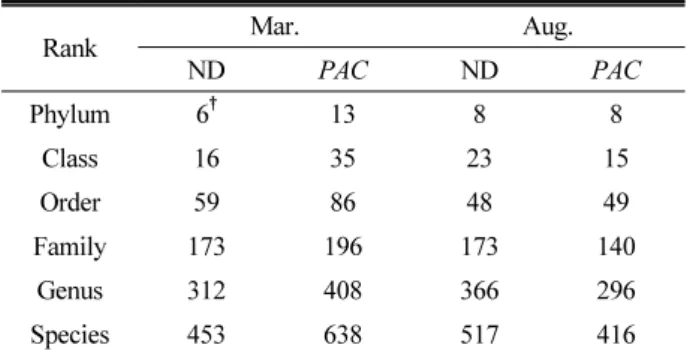
Using Taxon XOR analysis, the number of bacteria that is not part of the other soil was analyzed by ranks
for the March and August PAC and Nakdong soil samples.
Carrying out a Taxon XOR analysis at the phylum level of the March soil sample showed 13 phylum that are
present only in the PAC soil and not the Nakdong soil,
with 6 phylum also being found vice-versa (Table 4). The
phylum present only in the PAC soil from March were
AD2, OP3, Spirochates, TM6, ANW, Verrucomicrobia ,
whereas phylum only present in Nakdong soil from March
were EU266861, GN04, and Lentisphaerae. Carrying out
a Taxon XOR analysis at the phylum level of the August soil sample showed 8 phylum that are present only in the
PAC soil and not the Nakdong soil, with 8 phylum being
found vice-versa. The phylum present only in the PAC
soil from August were GN04, TM7, GN02, Lentisphaerae,
Table 4. Taxon exclusive or (XOR) analysis between Nakdong and Psy-2A-CrtI soil bacterial communities.
Rank Mar. Aug.
ND PAC ND PAC Phylum 6† 13 8 8 Class 16 35 23 15 Order 59 86 48 49 Family 173 196 173 140 Genus 312 408 366 296 Species 453 638 517 416
†The number of taxa that are present in Nakdong rhizoshpere soil but not in PAC. ND, Nakdong; PAC, Psy-2A-CrtI
Fig. 3. UPGMA dendrogram of 16S rRNA genes in Nakdong and Psy-2A-CrtI soil based on OTUs sharing 97% similarity (Bray-Curtis distance). ND (Mar), Nakdong soil collected at March; PAC (Mar), Psy-2A-CrtI soil collected at March, ND (Aug), Nakdong soil collected at August, PAC (Aug), Psy-
2A-CrtI soil collected at August.
August were EU266861, Tenericutes, Bacteria_uc, CS,
BRC1, and SM2F11_p. All of these were found to be taxon not present in rice soil’s dominant bacteria. The soil can be affected by many factors and these differences
can’t be concluded as the result of cultivating PAC. A
more detailed study is required on this result.
Comparison of soil communities UPGMA dendrogram based on Fast UniFrac using samples of each soil and time period was created and it showed the March and August soils were grouped according to their time period.
However the PAC soil and Nakdong soil were not grouped
together. This result suggest cultivating PAC doesn’t not have a significant effect on the soil ecosystem (Fig. 3). Investigating the microbial community structure from soil
where Bt-maize were cultivated for four years showed a
yearly difference in the microorganism taxon distribution and ratio, but no significant difference between Bt and non-Bt maize (Barriuso et al., 2012). Also, it has been reported that although there was a difference in the micro-organism population structure at the early stages of GM plant cultivation, this level was stabilized and returned to similar levels between GM and non-GM crop after several years (Hur et al., 2011). As such, it is suggested that analyzing the effect of cultivating GM crop on the soil microbiota should be carried by on a case by case basis and both short-term and long-term studies need to be carried out.
Persistence of Transgenes in Decomposing Rice Tissues
The persistence of the DNA in the transgenic rice leaves buried in soil as well as the soil surrounding the leaf was
investigated (Fig. 4). Using DNA extracted from PAC
and Nakdong rice leaf as template, the transgene was amplified and none of the 7 transgenes were detected in Nakdong. The PCR primers for 7 transgenes are shown on Table 5. However in PAC, the amplified transgene were found up to 2~4 weeks after being buried in the soil, but
not detected after 5 weeks. Also the transgene was not detected in the soil around PAC or Nakdong leaf (Fig. 5). A previous study reported that the transgene DNA can persist for months to several years in decomposing GM plant tissue (Gebhard and Smalla,1999). According to a
study by Hay et al. (2002), the DNA from GM poplar
(Populus alba L. X Populus grandidentata Michx.) leaf that landed on the soil could not persist for over four
months. However a transgene DNA from sugar beet (Beta
vulgaris L.) soil sample at a disposal site could be detected for up to 2 years (Gebhard and Smalla, 1999). In this study, the rice leaf was buried in soil and the conditions were made similar to that of a plot and the transgene DNA could not be detected after 5 weeks. However it must be considered that this study was carried out on rice grown for 3 weeks only, and thus further study is required on mature rice. Detection of recombinant DNA in soil microcosms seeded with ground leaf tissue might be affected by factors related to the leaf litter bio-chemistry which can exert direct effects on the metabolic activities of soil microbial communities (Hobbie et al., 2006). Thus the persistence of DNA in soil must be investigated on a case by case basis and further study is required in regards to the circulation cycle of transgene DNA and its long-term effect on the soil environment.
Conclusion
As a result of soil microbial community density analysis there was no significant difference between PAC and non-GM rice cultivar, Nakdong, rhizosphere soil. The DGGE banding patterns were quite similar in the same time period. Also, the pyrosequencing result showed no significant difference in microorganism taxon and
distri-bution ratio between PAC and Nakdong rhizosphere soil.
The DNA persistence of transgenes in the leaves of PAC
showed that they could not be detected after 5 weeks. In conclusion, these results indicate that soil microbial
Fig. 4. PCR primer region in plant expression vector used for analyzing the DNA persistence. Table 5. Primer information used for DNA persistence.
Sequence definition Sequence length (bp) Primer sequence Product length (bp)
MAR(+) 1,485 Sense:5’-TGTCGTTGGTTCTTGTGTT-3’ 146 Antisense: 5’-GCAGTAGCAGTTTAGTGTCC-3’ PSY2A 1,323 Sense:5’-TATGTGAGCAAACCAAAGAAGT-3’ 104 Antisense: 5’-TTGAGGAGGTCGAAGTTGA-3’ PINIIP35S 1,407 Sense:5’-ATCTAATCTTCTATGAATCGACCTG-3’ 107 Antisense: 5’-ATGAGACCTGCTGCGTAA-3’ BARNOS 553 Sense:5’-CTTCAAGCACGGGAACTG-3’ 166 Antisense: 5’-CGGCAACAGGATTCAATCTTA-3’ P35SBAR 1,106 Sense:5’-GGAAGTTCATTTCATTTGGAGAG-3’ 138 Antisense: 5’-GATGTAGTGGTTGACGATGG-3’ NOSMAR(-) 1,737 Sense:5’-TCTATGTTACTAGATCGGGAATT-3’ 176 Antisense: 5’-AGAAGTGATGCCTGTTGC-3’ MAR 1,485 Sense:5’-TGAAGTAGTGAGCGTTCTCT-3’ 113 Antisense: 5’-ACATTTACAAGCATTTGGGTATG-3’
Fig. 5. PCR amplification of partial MAR, Psy, 2A, bar, nos terminator, PinII terminator and 35S promoter from rice leaf samples after 1-5 weeks of incubation in soil (A) and the surrounding soil (B). NC, Negative control DNA from Nakdong rice leaf, PC, Positive control DNA from plant expression vector
communities are unaffected by the cultivation of a PAC
rice within the experimental time frame.
References
Ahn, J.H., M.C. Kim, H.C. Shin, M.K. Choi, S.S. Yoon, T.S. Kim, H.G. Song, G.H. Lee, and J.O. Ka. 2006. Improvement of PCR amplification bias for community structure analysis
of soil bacteria by denaturing gradient gel electrophoresis. J. Microbiol. Biotechnol. 16:1561-1569.
Bardgett, R.D., C.S. Dentin, and R. Cook. 1999. Below-ground herbivory promotes soil nutrient transfer and root growth in grassland. Ecol. Lett. 2:357-360.
Barriuso, J., J.R. Valverde, and R.P. Mellado. 2012. Effect of Cry1Ab protein on rhizobacterial communities of Bt-maize over a four-year cultivation period. PLoS ONE 7:e35481.
Bertolla, S. and P. Simonet. 1999. Horizontal gene transfer in environment: natural transformation as a putative process for gene transfers between transgenic plants and micro-organisms. Res. Microbiol. 150:375-384.
Cruz-Martínez, K., A. Rosling, Y. Zhang, M. Song, G.L. Anderson, and J.F. Banfield. 2012. Effect of rainfall-induced soil geochemistry dynamics on grassland soil microbial communities. Appl. Environ. Microbiol. 78:7587-7595. Donegan, K.K., C.J. Palm, V.J. Fieland, L.A. Porteous, L.M.
Ganio, D.L. Schaller, L.Q. Bucao, and R.J. Seidler. 1995. Changes in levels, species, and DNA fingerprints of soil microorganisms associated with cotton expressing the Bacillus thuringiensis var. kurstaki endotoxin. Appl. Soil Ecol. 2:111- 124.
Gebhard, F. and K. Smalla. 1998. Transformation of Acineto-bacter sp. strain BD413 by transgenic sugar beet DNA. Appl. Environ. Microbiol. 4:1550-1554.
Ha, S.W., Y.S. Liang, H. Jung, M.J. Ahn, S.C. Suh, S.J. Kweon, D.H. Kim, Y.M. Kim, and J.K. Kim. 2010. Application of two bicistronic systems involving 2A and IRES sequences to the biosynthesis of carotenoids in rice endosperm. Plant Biotechnol. J. 8:928-938.
Gebhard, F. and K. Smalla. 1998. Transformation of Acineto-bacter sp. Strain BD413 by transgenic sugar beet DNA. Appl. Environ. Microb. 64:1550-1554.
Hay, I., M.-J. Morency, and A. Seguin. 2002. Assessing the persistence of DNA in decomposing leaves of genetically modified poplar trees. Can. J. For. Res. 32:977–982. Hobbie, S.E., P.B. Reich, J. Oleksyn, M. Ogdahl, R. Zytkowiak,
C. Hale, and P. Karolewski. 2006. Tree species effects on decomposition and forest floor dynamics in a common garden. Ecology 87:2288-2297.
Hur, M., Y. Kim, H.R. Song, J.M. Kim, Y.I. Choi, and H.N. Yi. 2011. Effect of genetically modified poplars on soil microbial communities during the phytoremediation of waste mine tailings. Appl. Environ. Microbiol. 77:7611- 7619.
Icoz, I., D. Saxena, D.A. Andow, C. Zwahlen, and G. Stotzky. 2008. Microbial populations and enzyme activities in soil in situ under transgenic corn expressing cry proteins from Bacillus thuringiensis. J. Environ. Qual. 37:647-662. James, C. 2013. Global status of commercialized biotech/GM
crops: 2013. ISAAA Briefs No. 45, Ithaka, NY. Jung, B.G., G.H. Jo, E.S. Yun, J.H. Yoon, and Y.H. Kim,
1998. Monitoring on chemical properties of bench marked paddy soils in Korea. Korean J. Soil Sci. Fert. 31:246-252. Lee, S.H., C.G. Kim, and H. Kang. 2011. Temporal dynamics
of bacterial and fungal communities in a genetically modified (GM) rice ecosystem. Microb. Ecol. 61:646-659. Lee, B., C.G. Kim, J.Y. Park, K.W. Park, H. Yi, C.H. Harn,
H.M. Kim. 2007. Assessment of the persistence of DNA
in decomposing leaves of CMVP0-CP transgenic chili
pepper in the field conditions. Kor. J. Environ. Agric. 26: 319-324.
Liu, F.X., Z.P. Xu, J.H. Chang, J. Meng, F.X. Zhu, Y.C. Shen, and J.L. Shen. 2008. Resistance allele frequency to Bt cotton in field populations of Helicoverpa armigera (Lepidoptera: Noctuidae) in China. J. Econ. Entomol. 101: 933-943.
Lynch J. 1994. The rhizosphere-form and function. Appl. Soil Ecol. 1:193-198.
NIAST. 2000. Methods of Soil Chemical Analysis. National Institute of Agricultural Science and Technology, RDA, Suwon, Korea.
Oger, P., A. Petit, and Y. Dessaux. 1997. Genetically engineered plants producing opines alter their biological environment. Nat. Biotechnol. 15:369-372.
Oger, P., H. Mansouri, and Y. Dessaux. 2000. Effect of crop rotation and soil cover on alteration of the soil microflora generated by the culture of transgenic plants producing opines. Mol. Ecol. 9:881-890.
Robertson, B.H., M.J. Grubman, G.N. Weddell, D.M. Moore, J.D. Welsh, T. Fisher, D.J. Dowbenko, D.G. Yansura, B. Small, and D.G. Kleid. 1985. Nucleotide and amino acid sequence coding for polypeptides of foot-and-mouth disease virus type A12. J. Virol. 54:651-660.
Saxena, D. and G. Stotzky. 2001b. Bacillus thuringiensis (Bt) toxin released from root exudates and biomass of Bt corn has no apparent effect on earthworms, nematodes, protozoa, bacteria, and fungi in soil. Soil Biol. Biochem. 33:1225- 1230.
Wei, M., F. Tan, H. Zhu, K. Cheng, X. Wu, J. Wang, K. Zhao, and X. Tang. 2012. Impact of Bt-transgenic rice (SHK601) on soil ecosystems in the rhizosphere during crop development. Plant Soil Environ. 58:217-223. Widmer, F., Seidler, R.J., Donegan, K.K., Reed, G.L. 1997.
Quantification of transgenic plant marker gene persistence in the field. Mol. Ecol. 6:1-7.