Computers in Schools:
Why Governments Should
Do Their Homework
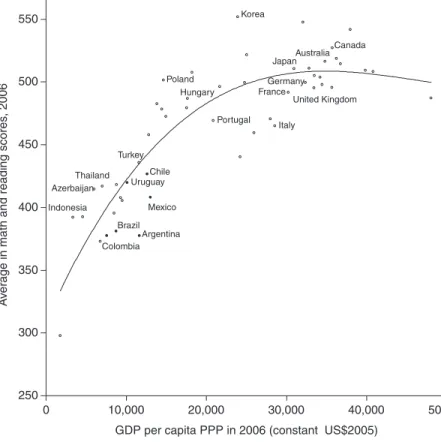
Latin American and Caribbean countries fare poorly in terms of student learning. After significant improvements in recent decades in the enrollment of children in preschool, primary, and secondary education, the region now faces significant challenges to ensure that its students achieve adequate levels of learning. One indication of the gap is standardized test scores. Figure 6.1 presents average standardized test scores for students aged 15 and gross domestic product (GDP) per capita in 2006, by country. Countries in the region, identified in black, perform significantly worse than their counterparts with similar levels of development. For exam-ple, Argentina, Chile, and Mexico have a GDP per capita similar to Latvia, Russia, and Turkey, but these countries outperform the Latin American countries by large margins. Colombia and Brazil, with a similar GDP per capita to Azerbaijan and Thailand, fare substantially worse in international assessments.
To improve the quality of learning, countries in the region are contemplating a variety of potential interventions. In particu-lar, many countries are vigorously pushing programs to increase students’ access to computers in schools as well as at home. For example, Uruguay has recently implemented a “one computer per student” program to provide laptops to all students in public
06_AChong_Ch06.indd 167
primary schools. Peru has also started distributing computers to students in rural primary schools, dramatically changing access to technology in isolated locations. A quick look at the main newspapers in the region suggests that these two countries may be soon followed by others in introducing ambitious programs that involve the use and distribution of computers in schools.
Figure 6.1 Standardized Test Scores and Income: An International Comparison
Average Scores in Mathematics and Reading
Source: OECD (2006) and World Bank (2010). Indonesia Azerbaijan Thailand Colombia Brazil Uruguay Turkey Argentina Chile Mexico Poland Hungary Portugal Korea Italy France Japan Germany United Kingdom AustraliaCanada 250 300 350 400 450 500 550 0 10,000 20,000 30,000 40,000 50,000
GDP per capita PPP in 2006 (constant US$2005)
A
v
er
age in math and reading scores
, 2006
06_AChong_Ch06.indd 168
Can computers help close the learning gap in Latin American and Caribbean primary and secondary schools? This chapter seeks to provide some insight into this question and raises some important red flags for policymakers to consider. First, programs that distribute one computer per student are costly, and as such, may crowd out other interventions that may be potentially more effective. Second, the benefits of computer programs depend criti-cally on the features of each particular project. Importantly, there are significant uncertainties surrounding their potential impact, especially for the new wave of programs that distribute laptops to students for school and home use on a large scale. The evidence so far is quite persuasive that programs that overlook teacher train-ing and the development of software may yield low returns. Also, children may shift the time spent at home doing homework and studying to computer use that does little to boost educational achievement. Third, the use of computer- assisted instruction software in mathematics has shown promising results. Finally, using increased access to computers—not necessarily on a to- one basis—to teach computer skills can produce large positive effects in these competencies, virtually erasing the related “digital divide” with a limited investment.
The Next Educational Revolution?
“I believe the motion picture is destined to revolutionize our educational sys-tem and that in a few years it will supplant largely, if not entirely, the use of textbooks.”
–Thomas Edison, 1922
The basic organization of the primary and secondary school system in Latin American countries—and in the rest of the world for that matter—has changed relatively little over the last 100 years. Primary schools in urban areas of Latin America are organized in
06_AChong_Ch06.indd 169
grades determined by age and competence. The students follow a set national or local educational curriculum. Schools have at least one class at each grade and one teacher per class. The school is usually run by a principal, who is in charge of administrative and academic matters.
In rural areas, education is similarly organized, but when schools are located in particularly remote areas and population density is low, it is common to find multigrade schools (FAO, 2004). In these schools, one or a few teachers instruct students of different ages and competence within the same class. The school infrastructure is poor in many parts of Latin America and the Caribbean. For example, according to a study by United Nations Educational, Scientific and Cultural Organization (UNESCO) (2008), more than 10 percent of schools in Argentina, Brazil, Paraguay, and Peru lack running water.
Secondary schooling is also organized in grades related to age and competence, but the number and complexity of subjects taught increase. Thus, specialized teachers tend to be assigned to different subjects. Due to cost and feasibility considerations, sec-ondary education organized in this fashion is mostly an urban phenomenon.
How has the advent of information and communication tech-nologies (ICTs) changed public education? The Organisation for Economic Co- operation and Development (OECD) (2009) definition of ICT services and products includes computers and peripheral equipment, communication equipment, con-sumer electronic equipment, software, and telecommunications services. This definition includes anything from calculators to laptops, from radios to MP3 players, from TVs to audiovisual equipment, from landlines to cellular phones, from word proces-sors to educational software, and from e- mail services to broad-band services. Many schools have had access to some of these
06_AChong_Ch06.indd 170
ICT technologies (calculators, radios, TVs, and phones) for a long time, but—perhaps surprisingly—the basic functioning of the school system has not changed dramatically with the advent of any of these innovations.
Could the exponential decrease in the cost of communica-tions and computers revolutionize the way schools and education function? The one laptop per child (OLPC) project has aimed to “create educational opportunities for the world’s poorest chil-dren by providing each child with a rugged, low- cost, low- power, connected laptop with content and software designed for collab-orative, joyful, self- empowered learning.”1 The first deployments
took place in 2007, and by now close to 1 million laptops have been distributed in forty countries. What is the potential role of computers in improving educational outcomes in Latin America? A look at different modes of ICT use in schools can help answer these questions.
Computers as an Input in the Educational Process
The school system produces education by combining school infra-structure (such as school buildings, classrooms, desks, white-boards, textbooks, and computers) and school personnel (such as administrators and teachers). School administrators hire and manage teachers and delegate to them the decision as to which combination of tools provided by the school infrastructure will allow them to achieve the learning outcomes determined by the school curriculum.
In this framework, a piece of computer equipment is just another input that teachers use at their discretion to trigger some response from their students and, ultimately, to achieve a learning outcome. Given the relative prices of the inputs and the production technology, teachers and schools choose the optimal
06_AChong_Ch06.indd 171
combination of inputs to achieve their objectives. The most com-mon uses of computers in schools can be embedded easily within this model.
Computer labs. A lab is usually installed in a specific school room, with computers shared between students. Learning is led by a specialized teacher, trained to deal with learning, software, and hardware issues.
Computer labs in schools were developed in the 1980s and 1990s with the idea of providing students with the possibility of learning computer skills, as well as introducing them to computer programming. The ultimate objective was not to produce com-puter programmers but to develop problem- solving skills.
Computer- assisted learning was also initially built around com-puter labs. In this setup, a class or a number of students in a class visit the lab with the objective of using a purpose- built software for the study of mathematics or language skills.
Computers in the classroom. With the dramatic decline in the price of audiovisual and computer equipment, many schools— particularly in urban areas—have been able to introduce a number of ICT technologies in the classroom. These technologies include computers, electronic boards, and ultimately, one computer per student.
The greater availability of computer or audiovisual equipment has let teachers introduce these pedagogical tools at their own pace and within their own day- by- day planning. For example, students can perform exercises in different areas of the school curricula and the teacher can record their progress in the computer for for-mative assessment. The teacher can use electronic whiteboards to present data and graphs, and manipulate information in a way that can improve visual learning.
So far, this discussion has described the use of ICT as just another input in the production of educational outcomes.
06_AChong_Ch06.indd 172
However, those that favor the idea of one computer per student view ICT as not just another input, but as a way of defining the production process. In a sense, the choice of a given ICT strat-egy defines the pedagogical approach and how the other inputs should be combined, given their relative prices. The one- to- one model tries to break with the traditional classroom education setting by providing a constructivist, student- centered approach to learning where students are allowed to learn and progress at their own pace.
ICT and the management of the school system. The
prom-ise of ICT in schools is not restricted to its capabilities as a pedagogical tool. Computers, cell phones, and other ICTs can be used to store, transmit, and analyze data faster than ever before.
For example, the collection, transmission, and analysis of data on enrollment, absenteeism, test scores, and infrastructure can help principals spot a problem in a given classroom, admin-istrators spot an exemplary school, and policymakers track the performance of the educational system and the resources avail-able. However, the gains in productivity seen in the business sector are rarely seen in the educational system, some have argued (see Carnoy, 2004), because most education managers are not knowledgeable in the use of information management tools.
The potential of ICT is not restricted to the supervision and monitoring by centralized agencies. In countries where ICT access and use by families is widespread, the possibility of using this technology to disseminate data on schools and individuals to parents is growing fast. Chile, for example, publishes the results of standardized student examinations by school on the Web. This information affects the demand for schools and is intended to improve accountability.
06_AChong_Ch06.indd 173
Computers in Schools: Placing Latin America on the Map
In the last twenty years, Latin American countries have heavily invested in ICT projects to provide students with computers and Internet connectivity. To systematically document how and when national policies on ICT in education have been implemented, Alvariño and Severín (2009) have surveyed key informants in a sample of Latin American countries. Figure 6.2 presents some gen-eral patterns regarding the timing of the introduction of national ICT policies in five areas: computer labs, connectivity, ICT train-ing for teachers, web portals, and OLPC pilots.
A few interesting patterns emerge from the figure. First, coun-tries have mostly followed a similar sequence of investments. Setting up computer labs has typically been the first step. Between 1996 and 2005, countries in the sample started to introduce the Internet to schools, and roughly at the same time, launched scale teacher training programs. Web portals have come next, as governments have tried to provide content and educational tools to schools now connected to the Internet. Finally, in the last few years, almost all the countries in the survey have imple-mented pilot projects to distribute a computer to each student in a school.
A similar survey to shed light on computer use in education and barriers faced by Caribbean countries was carried out in 2008 (Gaible, 2008). Availability of computers and the Internet was widespread among schools, especially for those at the secondary level. However, the investigation found that though most coun-tries had policies regarding the introduction of ICT in education, these had limited impact in practice.
Box 6.1 describes five leading initiatives. Almost two decades ago, Costa Rica and Chile introduced computer labs
06_AChong_Ch06.indd 174
Figure 6.2 A Timeline for Adopting ICT Projects 1985 1990 1995 2000 2005 2010 One-to-One Pilot Web portals Teacher training Connectivity Labs One-to-One Pilot Web portals Teacher training Connectivity Labs One-to-One Pilot Web portals Teacher training Connectivity Labs One-to-One Pilot Web portals Teacher training Connectivity Labs One-to-One Pilot Web portals Teacher training Connectivity Labs One-to-One Pilot Web portals Teacher training Connectivity Labs One-to-One Pilot Web portals Teacher training Connectivity Labs One-to-One Pilot Web portals Teacher training Connectivity Labs One-to-One Pilot Web portals Teacher training Connectivity Labs One-to-One Pilot Web portals Teacher training Connectivity Labs Argentina Nicaragua Colombia Honduras Guatemala Paraguay Brazil Peru Chile Costa Rica 06_AChong_Ch06.indd 175 06_AChong_Ch06.indd 175 1/12/2011 7:58:59 PM1/12/2011 7:58:59 PM
in schools on a large scale. In the late 1990s, Barbados imple-mented an ambitious program to introduce ICT in classrooms. More recently, Uruguay and Peru have implemented one- one computer programs. All of these programs have achieved countrywide coverage and include some component of teacher training. Each has different strategies in urban and rural areas.
A somewhat disappointing aspect of the five initiatives is that there has been little effort to provide credible impact evaluations. This is surprising, given the high cost of these interventions. The only exception has been Peru, which has set up a large- scale ran-domized evaluation of its program, with the collaboration of the Inter- American Development Bank.
ICT in Latin American and Caribbean Schools: Limited and Uneven Access
Have governments been effective at bringing ICT resources to stu-dents? How well are these resources being used? To answer these questions, this chapter exploits the rich data from the Segundo Estudio Regional Comparativo y Explicativo (SERCE). This study collected comparative representative data for a large number of countries in Latin America for primary school students between 2004 and 2007. In particular, this chapter uses data related to ICT inputs for sixth- grade students in thirteen countries, starting with computer access in the region.
Source: Alvariño and Severín (2009).
Notes: “Labs” refers to computer laboratory. “Connectivity” refers to availability of Internet connection at the school. “Teacher Training” includes educational uses of ICT. “Web portal” refers to an educational portal at schools. “One-to-One pilot” refers to pilots that provided low-cost laptops to all students in a school. Honduras has not carried out One-to-One pilot pro-grams. Argentina has not implemented labs and connectivity propro-grams.
06_AChong_Ch06.indd 176
Box 6.1 Leading Experiences in Latin America and the Caribbean
Costa Rica. In 1988, Costa Rica introduced computers in schools as a strategy to support learning. The program relied on teaching stu-dents the programming language Logo as a way to develop skills in logic and creativity. Over the years, a number of different action lines were implemented, aimed at increasing the availability of hardware, improving teacher training, connecting schools to the Internet, and increasing digital literacy in the general population. The program presents two modalities for hardware. Computer labs are set up in urban schools. Computers are deployed directly in the classroom in rural schools—a less expensive option that responds to economies of scale. In primary urban schools, students are expected to attend two classes a week in the computer lab, one in mathematics and one in language. Classes are guided by specialized teachers, with vary-ing participation by the regular teachers. The specialized teachers receive intense training, pedagogical support, and close supervision from technology “advisors” to ensure productive use of the comput-ers. A special career of teachers specialized in technology has been created.
Chile. In 1990, the Ministry of Education introduced the program Enlaces. Initially piloted in the Araucarian region, it was introduced nationwide in 1995 and today covers 98 percent of all publicly sup-ported primary and secondary schools. Participant schools receive computers, local networks, educational and productivity software, and free or subsidized Internet access. Urban schools receive com-puter labs, with the number of comcom-puters installed in each school determined by the level of enrollment. In rural schools computers are installed in the classroom, with a minimum of two in each school, regardless of the level of enrollment. Unlike in Costa Rica, there are no specialized teachers. Every teacher is expected to take advantage of the computer lab to promote learning in his or her own subject, while improving students’ skills in the management, presentation, (continued on next page)
06_AChong_Ch06.indd 177
and communication of data and ideas. For this purpose, the govern-ment created a network of universities that provide training, peda-gogical support, and technical assistance.
Barbados. In 1999, the program Edutech was launched. The initia-tive required an investment of US$213 million, a substantial amount for a school system of only 50,000 primary and secondary school students. By 2008, students in all primary and secondary schools in the country had access to computers and the Internet. About a third of primary schools have received computers in labs and in the classrooms, whereas all secondary schools have received at least thirty computers. The program has several interrelated components. Physical infrastructure has been improved, partly to ensure that schools are ready to receive computers and network connections. The ICT component, which originally accounted for about a third of the investment, was planned to deploy about 9,000 computers in primary and secondary schools. There is also a teacher training component and initiatives geared toward improving the education curriculum.
Uruguay. The CEIBAL project (Conectividad Educativa de
Informática Básica para el Aprendizaje en Línea) is a one-laptop-per-student project launched in 2007 with the goal of providing each stu-dent and his family continuous access to a computer, online resources through wireless connectivity, and free software. By the end of 2009, all students in public primary schools were covered. In 2010, the pro-gram was rolled out to secondary schools. The initial investment for CEIBAL was around US$100 million (Lasida, Peirano, and Severin, 2009) which represents 17 percent of the national budget for primary education. The laptops are designed for students. They are durable, lightweight, easy to carry, and are protected against water and dust. The battery lasts between one and two hours. They do not have a hard disk, and they store information only in flash memories. The operative system and its applications are free. Applications include a web browser, text processor, e-mail and chat service, and audio and (continued on next page) (continued)
06_AChong_Ch06.indd 178
Access. Figure 6 .3, panel a, shows the fraction of sixth grad-ers that have a computer at home and at school. While nearly 20 percent of students have computers at home in Paraguay and Guatemala, around 50 percent of students do in Argentina and Chile. In many countries, computer access at home is low, but
video platforms. The laptops have a wireless Internet connection and can also connect to one another. A server is installed in each school (approximately 2,300 have been installed) and provides Internet con-nectivity. To allow teachers to become familiar with the hardware and software and develop the teaching materials, teacher training is offered two months before the laptops are officially released to the students. Approximately 56.1 percent of teachers have been trained to teach subjects using ICTs. Later, support groups visit teachers to help them integrate curricular training in specific content areas and to increase the use of technology. Forty-three percent of schools have submitted curricular innovations for the use of ICTs for educational purposes.
Peru. Peru implemented a one-laptop-per-student program with the goal of increasing the quality of public primary education, espe-cially in rural schools in extreme poverty. Only 4 percent of benefi-ciary students live in urban areas, and 92 percent attend multigrade schools. Distribution of computers started in 2008. By October 2009, 170,000 computers had been distributed in 5,100 primary schools. All students and teachers received a laptop. Laptops are similar to the ones used in Uruguay. Peru selected thirty-nine different soft-ware applications, including games, measurement tools, a word processor, a calculator, chat, Wikipedia, maps, and programming software. Most are not connected to the Internet. Teacher training consists of a five-day, eight-hour-a-day course covering use of the laptops and available software. Teachers also receive ten short guides that describe how to use particular software and a manual that cov-ers the functional use of the laptop and basic maintenance tasks. (continued)
06_AChong_Ch06.indd 179
Figure 6.3 Availability of ICT at Home and at School, 2006 (percent) a. Computer 0 25 50 75 100 Guatemala Paraguay Dominican Republic El Salvador Peru Costa Rica Mexico Argentina Brazil Uruguay Colombia Cuba Chile School Home School Home b. Internet 0 25 50 75 100 Guatemala Paraguay Dominican Republic El Salvador Peru Costa Rica Mexico Argentina Brazil Uruguay Colombia Cuba Chile 06_AChong_Ch06.indd 180 06_AChong_Ch06.indd 180 1/12/2011 7:59:02 PM1/12/2011 7:59:02 PM
this is compensated by access at school. Indeed, many believe that schools could be a powerful means of reducing inequities in access to technology (see, for example, Jara Valdivia, 2008). The rationale is simple: with a limited investment—typically, a com-puter lab in a school—many students without outside access can use a computer regularly. Indeed, access to computers at school is practically universal in Chile, Cuba, Colombia, Uruguay, Brazil, Argentina, and Mexico.
Internet connectivity has the potential to unleash many oppor-tunities for students in terms of accessing vast amounts of infor-mation and collaborating and communicating with peers and experts. Panel b of figure 6.3 presents data on Internet access at school and at home. Internet access at school varies widely, from 96 percent of students in Chile to only 9 percent in Guatemala: a much wider range than the measures of access to computers. Interestingly, Cuba has a 100 percent computer access at school but almost no Internet access.
Clearly, having at least one computer in a school can be inter-preted as having “access” to technology, but this is not the full picture. Consider the number of minutes each student can poten-tially spend in front of a computer every week, which is an
indica-tor of how many resources are available to students (figure 6.4).2
Despite widespread access, the amount of computer time avail-able to students is relatively low. Costa Rica, Mexico, and Chile have the highest computer time availability, with more than forty minutes of computer time per student per week. Paraguay has the lowest availability (fewer than ten minutes). It should be noted that access in public schools tends to be lower than the national average, which also includes students in private schools.
Source: Authors’ calculations based on data from LLECE (2008).
Note: Data from computer and Internet access at home for Mexico is unavailable.
06_AChong_Ch06.indd 181
How wide is the “digital divide” when analyzed at the indi-vidual level? Figure 6 .5 illustrates how much home and school “access” varies according to socioeconomic status (the educa-tion of the student’s mother, classified by quartiles defined for each country). A positive link exists between access at home and socioeconomic status, but the relationship with school is much weaker. However, the socioeconomic gradient of access at school is more pronounced when measured in terms of intensity of access
Figure 6.4 Potential Computer Access, 2006
Average minutes with a computer allocated to each student weekly
Source: Authors’ calculations based on data from LLECE (2008).
0 10 20 30 40 50 60 Paraguay Guatemala Dominican Republic Brazil El Salvador Argentina Peru Uruguay Colombia Cuba Chile Mexico Costa Rica All Public 06_AChong_Ch06.indd 182 06_AChong_Ch06.indd 182 1/12/2011 7:59:04 PM1/12/2011 7:59:04 PM
(minutes of computer time available to each student). The data suggest that the role of schools in closing differences in access is less prominent when intensity of access is taken into account.
Use. Higher access may not necessarily translate into higher utilization if schools do not make effective use of the additional resources. In economic terms, increasing access can be viewed as an increase in the “supply” of this input at the school. However, greater use will not materialize if there is not enough demand for it. Many cases have been documented in which schools have com-puters available but do not use them.
To analyze this issue, students in SERCE were asked how fre-quently they used computers at school. Figure 6.6 shows the frac-tion of students by country who reported that they use computers at school at least once a week. This may be the most important
Figure 6.5 Percent of Students with Access to a Computer by Mother’s Education 2006 0 10 20 30 40 50 60 70 80 90 100
Low Mid-Low Mid-High High
Mother's education
Percentage of students with
access to a computer 0 5 10 15 20 25 30 35 40 45 50
Computer time (in minutes)
School Home Access to computer time (minutes)
Source: Authors’ calculations based on data from LLECE (2008).
06_AChong_Ch06.indd 183
indicator because it provides information regarding actual use of technology, rather than the extent or intensity of access. The fig-ure highlights stark differences in weekly use across countries. On the high end is Cuba, where the majority of students report using a computer weekly. At the low end are Guatemala and Paraguay, where less than 20 percent of students use computers regularly.
Do variations in weekly use reflect disparities in access or
greater efficiency in terms of technology use?3 Apparently,
com-puter access and school enrollment account for much of the divergence across countries in weekly computer use. Thus, the disparities can be blamed largely on the distribution of comput-ers at school. The exceptional case is Cuba, where students enjoy
Figure 6.6 Students Using a Computer at Least Once a Week at School, 2006 (percent)
Source: Authors’ calculations based on data from LLECE (2008).
0 10 20 30 40 50 60 70 80 90 100 Paraguay Guatemala Brazil Argentina Dominican Republic El Salvador Peru Uruguay Mexico Chile Costa Rica Colombia Cuba
All schools Public schools
06_AChong_Ch06.indd 184
much more computer time compared to other countries with sim-ilar levels of access.
Teachers’ Use of ICT
Access to technology must be supported by teachers who know how to use the technology and can integrate it into their pedagogi-cal practices so as to realize its potential benefits (see, for example, Sunkel, 2006; Bruns et al., 2009). To understand the access and interaction of teachers with computers in Latin America, teacher
Figure 6.7 Computer Use by Teachers, 2006
0 20 40 60 80 100
Has e-mail Has e-mail
Use computer Use computer Use computer Use computer Use computer Use computer Use computer Use computer Use computer Use computer Has e-mail
Use computer Use computer Use computer Use computer
Has e-mail
Use computer Use computer Use computerl Use computer
Has e-mail
Use computer Use computer Use computer
Has e-mail
Use computer
Use computer Use computer
Peru Mexico Guatemala El Salvador Dominican Republic Paraguay 0 20 40 60 80 100
Use computer Use computer
Has e-mail
Use computer Use computer Use computer Use computer
Has e-mail
Use computer Use computer Use computer Use computer
Has e-mail
Use computer Use computer Use computer Use computer
Has e-mail
Use computer Use computer Use computer Use computer
Has e-mail
Use computer Use computer Use computer Use computer
Has e-mail
Use computer Use computer
Cuba Chile Uruguay Costa Rica Colombia Argentina
Source: Authors’ calculations based on data from LLECE (2008).
06_AChong_Ch06.indd 185
questionnaires from the SERCE study yield summary statistics on computer access and use.
The SERCE survey provides information about whether grade public school teachers use computers regularly. For teachers who reply affirmatively to this question, the survey delves further into whether they use computers at home or at school. Figure 6.7 presents the information on these questions for twelve of the countries that participated in the survey.
The first striking finding is that only in Cuba, Chile, Costa Rica, and Uruguay do more than 80 percent of teachers use computers regularly. Although the availability of computers at school is high only in Cuba, Chile, and Mexico, more than 50 percent of teachers use the computer at school. The most frequent use of computers is for research purposes. Relatively few teachers have e- mail accounts.
The results suggest that teachers are not very familiar with com-puters and do not use them often. A key factor affecting teachers’ familiarity with computers and their use in the classroom is the training they receive to qualify as teachers. National and subnational governments can improve teacher training in ICT since they deter-mine minimum standards of competence and curricular knowl-edge. For example, countries like Chile, Colombia, Costa Rica, and Peru have mandated that teachers- in- training must be competent in the use of ICT in the classroom. However, other countries, including Argentina and Mexico, do not state that goal explicitly.
Do the institutions that train future teachers include ICT class-room skills as part of their curricula? This information is hard to come by because of the multiplicity of establishments that offer training and the option they have of either introducing ICT skills as a curricular subject or as part of the training in mainstream subjects. Countries planning to develop ICT programs should evaluate the competence of new and current teachers in the use of ICT technologies before embarking on ambitious ICT programs.
06_AChong_Ch06.indd 186
Are Latin America and the Caribbean Lagging Behind?
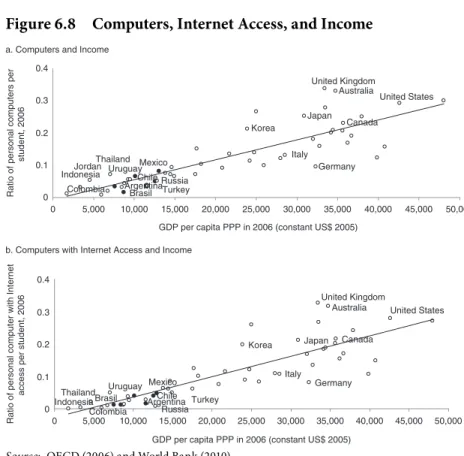
The Programme for International Student Assessment (PISA) periodically evaluates the performance of a nationally represen-tative sample of fifteen- year- old students around the world. The study includes information about students and their schools, and the 2006 waves of PISA included six Latin American countries: Argentina, Brazil, Chile, Colombia, Mexico, and Uruguay. For this chapter, the computer per student ratio and the computer with Internet access per student ratio in each school were averaged for all schools in a given country. Figure 6.8 shows the relationship between these measures and GDP per capita. Each circle repre-sents a country. The superimposed lines are fitted values from a linear model using all countries in the study, with the exception of the Latin American ones.
There is a positive relationship between computers and Internet access and GDP per capita. Although the purpose was not to assign a causal interpretation to these associations, a simple interpreta-tion for these findings can be ventured. The demand for inputs in the educational process is a derived demand. That is, individuals do not demand computers or textbooks per se; they demand edu-cation. If education is a normal good, then as income rises, soci-eties can be expected to demand higher levels of education and to become more educated. In turn, this will affect the demand for school infrastructure in general and ICT in particular.
Costs and Benefits of Computers for Basic Education Although the cost of ICT products has declined significantly in recent years, providing universal access to computers is still an expensive enterprise for most Latin American and Caribbean countries. On one extreme of the spectrum, the most costly
06_AChong_Ch06.indd 187
alternative is to provide each student with a computer to use both in class and at home (the one- to- one approach). A less expensive option is to let students share computers in school by building computer labs. This section quantifies these costs.
To compare the cost of different ICT projects in classrooms, it is useful to define the concept of “total cost of ownership” (TCO), which is typically used to capture the total cost over the life of an initial investment. It includes the original cost of the investment, which has an expected life of several years, as well as the recurrent costs required for that initial investment to work properly over its lifetime (electricity, maintenance, training, and the like).
Figure 6.8 Computers, Internet Access, and Income a. Computers and Income
Indonesia Jordan Thailand
Colombia Brasil Uruguay
Turkey ArgentinaChile Russia
Mexico Korea Italy Japan Germany United Kingdom Australia Canada United States 0 0.1 0.2 0.3 0.4 0 5,000 10,000 15,000 20,000 25,000 30,000 35,000 40,000 45,000 50,000 GDP per capita PPP in 2006 (constant US$ 2005)
Ratio of personal computers per
student, 2006
b. Computers with Internet Access and Income
Indonesia Thailand Colombia Brasil Uruguay Turkey ArgentinaChile Russia Mexico Korea Italy Japan Germany United Kingdom Australia Canada United States 0 0.1 0.2 0.3 0.4 0 5,000 10,000 15,000 20,000 25,000 30,000 35,000 40,000 45,000 50,000 GDP per capita PPP in 2006 (constant US$ 2005)
Ratio of personal computer with Internet
access per student, 2006
Source: OECD (2006) and World Bank (2010).
06_AChong_Ch06.indd 188
A hypothetical analysis that reflects average parameters for the region helps explain the cost consequences of different strategies. Consider the ministry of education of a country that is evaluating whether to make the usage of computers in its schools univer-sal. There are three alternatives. The first is a standard one- one program, which consists of giving one laptop to each student currently enrolled in the school system, and supporting some minimal teacher training. The second is an enhanced one- to- one program that not only provides laptops for the students, but also specially designed learning software and intensive teacher train-ing, and allows each cohort that leaves the school system to take the computer with them (one- to- one). The third is a computer laboratory (lab) in the school that affords students two hours of access to the equipment each week.
ICT projects typically involve the purchase of large amounts of hardware and software at the onset of the program. In principle, the country can buy those resources via international competition; thus, international market prices can be used to value them. The projects usually involve teacher training. The costs will depend largely on prevailing wages and the intensity of training (hours of training and number of teachers that each instructor serves, for example). Since many costs are fixed at the country, school, or classroom level, this analysis is based on an average school in the region that has 300 students enrolled and 24 students in each class. Table 6.1 shows the resulting comparative costs for an urban school.
Assume that a relatively cheap laptop costs US$210 and has an expected life of about five years. In addition, some extra hardware is usually needed in each school to use the laptops fully (servers,
disk storage, and Internet access points).4 The annualized
hard-ware cost adds up to almost US$62 per student per year.5 The
computer lab, on the other hand, is equipped with more expen-sive computers than the ones used in the one- to- one setting and
06_AChong_Ch06.indd 189
is designed to be used by pairs of students for about two hours a week. Given that the school is open only a fixed number of hours each day, bigger schools would require several labs.6 Despite these
higher costs, the initial investment for a computer lab is much lower than in the one- to- one strategies.
All projects also require other start- up investments: software, training, and access to the Internet. Although training and soft-ware costs are relatively low in the one- to- one case, they are substantially higher for the one- one+ strategy. Indeed, one- one+ requires computer- assisted instruction software that allows
Table 6.1 Annualized Total Cost of Ownership per Student (current US$)
One- to- One One- to- One+ Lab Investment Hardware 61.9 61.9 7.1 Software 0.0 39.60.3 Teacher training 3.2 17.4 3.2 Internet 0.1 0.1 0.1 Other 1.7 1.7 1.6 Total 66.9 120.7 12.4 Recurrent Electricity 0.4 0.4 0.3 Teacher training 4.8 49.2 4.8 Internet 1.4 1.4 1.4 Maintenance 20.3 44.63.5 Other 0.3 0.3 0.6 Total 27.2 96.0 10.6 Total Costs 94.1 216.7 23.0
Sources: Author’s calculations based on OLPC (2010) and Vital Wave Consulting (2008).
Note: All costs are calculated for a baseline school of 300 students.
One- to- One+ is similar to the One- to- One project, but it differs in the amount of training provided to teachers. It also incorporates the use of a tutorial software.
06_AChong_Ch06.indd 190
children to learn according to their own capabilities. The software must be specifically designed to meet the curricular requirements of each country. Thus, it is costly.
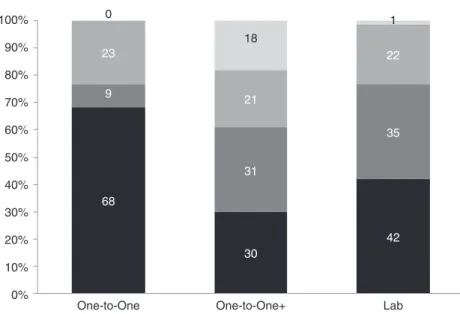
The three strategies also create recurrent costs that are paid every year: operation costs (electricity), access to the Internet, maintenance, and teacher training. As noted, lack of teacher train-ing is one of the main limitations of traditional one- to- one pro-grams. This is why one- to- one+ programs place special emphasis on continuous training. Whereas one- to- one programs concen-trate a high percentage of costs on deployment of hardware and peripherals, one- to- one+ programs devote a larger proportion to training and software (figure 6.9).
The cost of computers has become a paramount concern in the quest to make the one- to- one strategy feasible in developing countries. Total costs include not only the initial investment, but also sizable recurrent costs each year. Recurrent costs account for approximately 44 percent of the TCO of the one- to- one+ projects, and 29 percent of one- to- one projects. In the case of computer labs, recurrent costs are 46 percent of the total cost. High recur-rent costs mean that any universal ICT project generates a perma-nent increase in educational spending.
Performing a hypothetical cost analysis helps reveal the relative cost of each project and the importance of each component, but it has some limitations. Indeed, if a country decides to implement one of these projects, costs would vary from those presented in table 6.1, because the specific configuration the country selects dif-fers from the one chosen as an example, and because of the char-acteristics of the school system and the infrastructure available in the country. In particular, six factors can affect the cost structure of any of these projects: the distribution of school size, the per-centage of rural schools, the number of students per teacher, dif-ferences in teachers’ wages, energy costs, and connectivity costs.
06_AChong_Ch06.indd 191
Combining the hypothetical case with country- specific informa-tion on these six factors reveals how much it would cost for each country to implement the three projects from scratch.
Figure 6.10 shows the annual TCO per student of the three ICT projects as a percentage of annual current expenditure per student in primary education. Countries are sorted from highest to lowest GDP per capita. In better- off countries, implementing even the more expensive one- to- one+ program could be afford-able, in principle. In other countries, like Argentina or Costa Rica,
Figure 6.9 Cost Structure of Three Models of Deploying Computers, 2008 (percent) 68 30 42 31 35 23 21 22 9 0 18 1 0% 10% 20% 30% 40% 50% 60% 70% 80% 90% 100%
One-to-One One-to-One+ Lab
Deployment Training Facilities Software
Source: Authors’ calculations based on OLPC (2010) and Vital Wave Consulting (2008).
Note: Deployment refers to: Hardware, electricity, other investment, and recurrent costs. Training refers to: Training teachers costs. Facilities refers to: Internet and maintenance costs. Software refers to : Tutorial and Microsoft software costs. to-One+” is similar to the “One-to-One” project, but it differs in the amount of training provided to teachers. It also incorporates the use of a tutorial software.
06_AChong_Ch06.indd 192
even the less expensive option of the one- to- one strategy usually implies more than a 10 percent increase in expenditure. Because of the nature of the project, this increase would be permanent.
Benefits: Do Computers Offer Education in a Box?
In 1998, the World Bank issued its first regional report about the role of technology in education in Latin America and the
Figure 6.10 Cost of ICT for Primary Education in Latin America and the Caribbean, 2008
(as a percentage of current public expenditure per student in primary education)
Source: Author’s calculations based on CEDLAS (2010), de León (2009), LLECE (2008), UNESCO (2010), Vital Wave Consulting (2008), Viteri Díaz (2006), World Bank (2008, 2010).
Note: Calculations based on the baseline school and country information. One-to-One+ is sim-ilar to the One-to-One project, but it differs in the amount of training provided to teachers. It also incorporates the use of a tutorial software.
0% 20% 40% 60% 80% 100% 190% Nicaragua Guyana Bolivia Honduras Paraguay Guatemala El Salvador Ecuador Belize Peru Dominican Republic Colombia Jamaica Costa Rica Panama Brazil Argentina Uruguay Chile Mexico Venezuela Barbados Trinidad and Tobago
One-to-one+ One-to-one Lab
06_AChong_Ch06.indd 193
Caribbean (World Bank, 1998). The report presented substantive information regarding costs of alternative technological models, but almost no information about the effectiveness of these options because of a lack of reliable research. Things have changed. Today, substantive quantitative evidence is available regarding the impacts associated with introducing ICT to enhance the learn-ing process. Though important knowledge gaps persist, the accu-mulated evidence can help governments decide how to best use limited budgets.
The available evidence on outcomes focuses primarily on impacts on learning in traditional subjects such as mathematics and language. This is natural, as those are the primary academic goals that schools try to achieve. There is some evidence concern-ing other outcomes, such as impacts on ICT skills, other cognitive and noncognitive skills that computers may change (such as logic reasoning), and certain behavior, such as attendance and dropout rates.
Computers in schools. A vast quantitative literature attempts to estimate the impact of introducing computers to schools.7
Typically, a treatment group of students or schools is beneficiary of some type of intervention, and a number of outcomes for the intervened “units” are compared to those from a comparison group. Among rigorous quantitative studies, two distinct groups can be identified. The first are studies that estimate the impacts associated with increasing access to computers, typically together with some other inputs, such as software, teacher training, and pedagogical support. The second are studies that explore the impacts associated with a particular use of computers in schools.
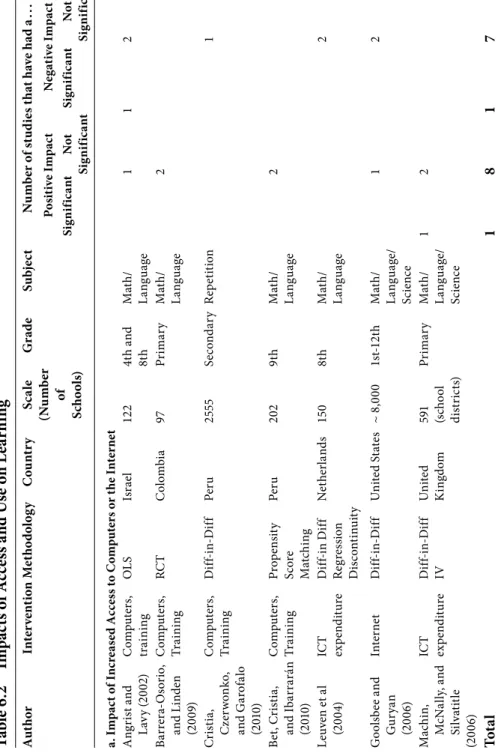
Many studies that have looked at whether increasing com-puter access improves educational outcomes have found either positive or negative impacts, but they cannot convincingly rule out that these interventions had no impact at all (see table 6.2,
06_AChong_Ch06.indd 194
panel a). For example, Barrera- Osorio and Linden (2009) used an experimental approach to evaluate a program that deployed computers to primary and secondary schools in Colombia and found no impacts in mathematics and language. Bet, Cristia, and Ibarrarán (2010) exploited the substantial changes in ICT access from 2001 to 2006 in secondary schools in Peru to explore whether penetration of computers helped reduce the repetition rate, and also found no impacts. Under the same educational context, Cristia, Czerwonko, and Garofalo (2010) compared two sets of Peruvian public secondary schools with different levels of computer access but other similar characteristics and found no differences in math and language learning levels that could be attributed to the differential access to technology. Other studies that have focused on Israel, the Netherlands, the United Kingdom, and the United States and have analyzed programs that have increased the availability of computers or the Internet in schools have also found no statistically significant impacts (see table 6.2, panel a).
These results are rather counterintuitive; additional resources would be expected to produce better outcomes. However, the edu-cation evaluation literature has revealed many interventions that increase some inputs yet do not produce results (see, for exam-ple, Glewwe and Kremer, 2006). Still, how can these results be explained?
To have impacts, these interventions must produce a whole chain of events. If any of the links in the chain are broken, the impacts will not materialize. First, access must translate into use. Second, use must be directed to the areas measured in the exam (typically, mathematics and language). Third, classes in which computers are used to teach mathematics and language should have a greater learning effect than traditional instruc-tion. That is, it is not enough for teaching with computers to
06_AChong_Ch06.indd 195
T ab le 6 .2 Im p ac ts o f A cc es s a n d U se o n L ea rn in g A u th o r In te rv en ti o n M eth o d o lo g y C o u n tr y S ca le (N u m be r of Sch o o ls ) G ra d e S ub je ct N u mb er of st u d ie s t h at h av e h ad a . . . P o sit iv e I mp ac t N eg at iv e I mp ac t Si g n if ic a n t N o t Si g n if ic a n t Si g n if ic a n t N o t Si g n if ic a a . I mp ac t of I nc re a se d Ac ce ss to C ompute rs or t he I n te rne t A n g ri st a nd L av y ( 2 0 0 2) Co m p u te rs, tr ain in g O L S Isr ae l 12 2 4 th a nd 8t h Ma th / La n g u ag e 1 1 2 Ba rr er O so ri o , and L in d en ( 2 0 0 9) Co m p u te rs, Tr ai n in g RC T C o lo m b ia 9 7 P ri m ar y M at h / La n g u ag e 2 Cr is ti a, C ze rw o n k o , and G ar of al o ( 2 01 0) Co m p u te rs, Tr ai n in g D if in - D if f P er u 2 55 5 S ec o nd ar y R ep et it ion 1 B et , C ri st ia , and I b ar ra rá n ( 2 01 0) Co m p u te rs, Tr ai n in g Pr o p en si ty Sc o re Ma tch ing P er u 2 0 2 9 th M ath / La n g u ag e 2 L eu ve n e t a l ( 2 0 0 4) IC T ex p end it u re D if in D if f Re g re ssi o n Disco n ti n u it y N et h er la nd s 15 0 8t h M at h / La n g u ag e 2 G o ol sb ee a nd G u ry an ( 2 0 0 6) In te rn et D if in - D if f U n it ed St at es ~ 8 ,0 0 0 1s 12 th M at h / La n g u ag e/ Sci en ce 1 2 Mach in , M cN al ly , a nd S il va ti tl e (2 0 0 6) IC T ex p end it u re Di ff - i n - Di ff IV Un it ed Ki n gd o m 59 1 (s ch o o l di st ri ct s) Pr im ar y M at h / La n g u ag e/ Sci en ce 12 To ta l 1 8 1 7 06_AChong_Ch06.indd 196 06_AChong_Ch06.indd 196 1/12/2011 7:59:30 PM1/12/2011 7:59:30 PM
b. I mp ac t of C ompute r A ss is te d I n st ruc ti on ( C A I) B ane rj ee e t a l ( 2 0 0 7) C A I R C T In d ia 111 4 th M at h 1 He , L in d en , and M ac L eo d ( 2 0 0 8) C A ty p e R C T In d ia 2 4 2 1s 3r d E n g li sh 1 L ind en ( 2 0 0 8) C A I R C T Ind ia 60 2 3r d M at h 1 1 C ar ri llo, O nof a, and P onc e ( 2 01 0) C A I R C T E cu ad o r 163 rd - 5 th M ath / La n g u ag e 11 Rou se a nd K ru eg er ( 2 0 0 4) CA I R C T U n it ed St ate s 4 s ch o o ls , 45 4 st u d en ts 6t h L an g u ag e 1 D y n ar sk i e t a l ( 2 0 0 7) CA I R C T U n it ed St ate s 132 sch o o ls , 43 9 cla sses 1s t L an g u ag e/ Ma th 3 1 Ba rr o w , M ar k m an , and Rou se ( 2 0 0 9) CA I R C T U n it ed St ate s 17 sch o o ls , 15 2 cla sses Mi d d le and H ig h Ma th 1 To ta l 4 6 1 No te s: S tu d ie s we re s el ec te d if t h ey h ad em p loy ed a s en si b le id en ti fi ca ti on st ra te g y an d h ad sh ow n so m e ev id enc e su p p o rt in g th e id ent if ic at io n a ss u m p ti o n s i n vo k ed . T h e la st f o co lu m n s s h ow w h et h er t h e r es u lt s i n d ic at e p o si ti ve o r n eg at iv e e ff ec ts a n d a ls o w h et h er t h es e w er e s ta ti st ic a ll y s ig n if ic ant o r n o t. A r es u lt i s s ta ti st ic a ll y s ig n if ic an t i f i t i s u n li k th at it o cc u rr ed b y ch an ce . A p ar ti cu la r s tu d y m ay p ro v id e a n u m b er o f e st im at io n s i f d if fe re n t g ra d es o r su b je ct s w er e te st ed . F o r e x am p le , i n A n g ri st a n d L av y (2 0 0 2) , f o u r e st im ti on s we re r ep o rt ed a s te st s co re s we re a n a ly ze d fo r m at h a n d l an g u ag e fo r st u d en ts a t fou rt h a n d e ig ht h g ra d es . I n t h is st u d y, o n e es ti m at io n sh owe d a p o si ti ve an d n o t si g n if ic ef fe ct , tw o sh owe d n eg at iv e an d n o t si g n if ic an t ef fe ct s, a n d o n e sh o we d n eg at ive an d s ig n if ic ant ef fe ct s. R C T re fe rs t o ra n d o m iz ed co nt ro ll ed t ri a ls w it h a r ea so n ab le nu m b er su b je ct s a n d t h at h av e n o t d is ca rd ed r an d o m iz ed t re at m en t d u e to n o n co m p li an ce . O L S r ef er s to O rd in ar y L ea st S q u ar es . D if in - D if f re fe rs t o a d if fe re n ce d if fe re nc es e st im to r. IV r ef er s t o an I n st rum en ta l V ari ab le s es tim at o r. C AI r ef er s to c o m p u te as si st ed in st ru cti o n . C AI - t y p e c o rr es p o n d s t o a s m a ll d ev ic e (n o t a c o m p u te r) t h at a ss is ts s tu d en in l ea rn in g a p ar ti cu la r s u b je ct . 06_AChong_Ch06.indd 197 06_AChong_Ch06.indd 197 1/12/2011 7:59:30 PM1/12/2011 7:59:30 PM
have a positive effect on learning; it should produce faster learn-ing than instruction without computers. If there is no faster learning, then “treatment” schools or students will not do bet-ter academically than their comparison counbet-terparts. This is because the time that teachers spend in the computer lab with students cannot be used to generate learning in a traditional way. Finally, the impacts should be large enough so as to be detected in a statistical fashion. That is, studies that find evidence of “no impacts” cannot conclude that the effect is zero—only that it cannot be ruled out convincingly. Studies that find no impact with large sample sizes are far more informative than those with small sample sizes because the former are able to reject even small effects.
Which of these explanations may explain the results reviewed? In the case of Colombia, the story is quite clear. As part of the eval-uation, students and teachers were surveyed regarding their use of the additional resources. The additional computer access time was used to increase the time allocated to teaching ICT skills, rather than for other subjects. Cristia, Czerwonko, and Garofalo (2010) found a similar explanation in Peru. Virtually all the increased computer access time in schools with high computer access was devoted to teaching ICT skills.
Does this mean that other programs in the region with greater computer access, such as those in Chile and Costa Rica, have also been largely ineffective in improving learning in traditional subjects? The answer to this question is highly speculative. Even though these countries were regional pioneers in the field, they did not embed their innovations in a rigorous evaluation scheme. Hence, though these countries have played an important role in the region by generating potential models to follow, their contri-bution in terms of providing evidence on the actual effectiveness of these models has been much more limited.
06_AChong_Ch06.indd 198
If providing resources and letting schools choose how to use them is not an effective strategy, why not take this option away from schools and teachers and predetermine how computers should be used? A natural way to implement this strategy is by using some type of computer- assisted instruction software. These computer programs aim at producing learning in specific aca-demic areas, such as algebra for third graders or reading skills for fifth graders. The attractiveness of the software lies in its ability to test a student’s initial knowledge, tailor the content and exercises to the needs of the particular student, and provide continuous feedback to students about their progress (see Skinner, 1954). In this sense, it allows each student to have a so- called digital to- one tutor.
An example of this type of intervention is the “Más Tecnología” program implemented by the municipality of Guayaquil, Ecuador, in 2005. This program aims at improving the quality of education in public schools in Guayaquil. To achieve this goal, it provides computer infrastructure, Internet access, training, and assisted instruction (CAI) software. The software is the critical component in the program. It was designed as a learning plat-form for mathematics and language, and tailors the provision of content and exercises based on an initial evaluation conducted for each student.
An experimental evaluation of this program suggests that the program was quite effective in improving test performance in mathematics, but did not attain statistically significant gains in language (Carrillo, Onofa, and Ponce, 2010). The gains in math-ematics were quite large by educational evaluation standards, and are promising in terms of the potential effective use of computers in the school. Importantly, students in the program were expected to devote three hours a week to using the software. Thus, part of the gains may have been produced by the increase in the total time
06_AChong_Ch06.indd 199
students spent studying math—which, in turn, may have been facilitated by the attraction the technology holds for children.
Effective impacts of interventions based on CAI software have also been documented in other developing areas (see table 6.2, panel b). Banerjee et al (2007) ran a randomized evaluation of a similar program in India in which fourth graders shared the use of software for two hours a week to improve learning in mathemat-ics (one hour during school and one hour outside school hours). The program produced impressive results in learning, although the effect was temporary and most gains faded away a year after the program ended. Interestingly, Linden (2008) reports that a randomized evaluation in India led to negative impacts when the software replaced regular classes, but slightly positive impacts when computers were used outside of school. These discrepan-cies in results appear to relate to the quality of teaching in the school where the programs were implemented. In quality schools with effective teaching, the impacts were less; in poor schools, the potential for gains in learning was large. In the United States, where the educational system functions relatively well, these interventions have had little impact (Rouse and Krueger, 2004; Dynarski et al, 2007; Barrow, Markman, and Rouse, 2009).
How can these generally positive but not always consistent results be interpreted and compared to the null results from inter-ventions that increased access? The first clear difference between the “use” interventions as compared to the “access” interventions is that the former, by design, alter the way that classes are conducted. While increased computer access may not change how the instruc-tional process is executed, the “use” interventions alter it directly. Moreover, the positive impacts usually attained by programs based on CAI software may be partly explained by the increase in total study time these interventions represent for students. Also, the fact that positive impacts are found in potentially weak educational
06_AChong_Ch06.indd 200
environments but not when the use of software replaces quality learning time underscores the fact that the effect of intro-ducing software on learning will be positively influenced by the quality of the software, but negatively influenced by the quality of instruction that it replaces. That is, all other things being equal, the introduction of CAI software will generate larger improvements when it replaces (or complements) low- quality learning time.
Do computers affect ICT skills? Is the effect large? In particu-lar, is one hour of access a week enough to erase the “competen-cies” digital divide? The study of secondary schools in Peru by Bet, Cristia, and Ibarrarán (2010) explored these questions by exploiting a sample of two sets of schools that are similar but that have quite different computer access. The treatment schools used the additional access primarily to teach ICT skills. Hence, com-paring both sets of schools can yield some evidence regarding the effects of providing one additional hour of computer access a week to learn ICT skills on these competencies. Results indicate that students in treatment schools score significantly better in a test of ICT skills. The average impact is larger than the difference in average score between children whose mothers have more than a secondary education compared to those with less. In other words, limited computer access can narrow the skills digital divide, at least in the Peruvian context studied.
Can ICT impact student behavior? In particular, could comput-ers indirectly improve learning by making schools more attrac-tive, and hence, increasing attendance and reducing drop- out rates? Unfortunately, computer access does not appear to reduce drop- out rates in Peru, even minimally (Cristia, Czerwonko, and Garofalo, 2010). In India, the impact on school attendance and drop- out rates is similarly inconsequential (Banerjee et al, 2007).
Computers at home. If it is difficult to find gains from intro-ducing computers at school, could the provision of computers at
06_AChong_Ch06.indd 201
home open the path to self- learning? There are two ways of dis-tributing computers at home. One is to give computers to selected (poor) children who probably would not otherwise have access to them. The goal is to boost access to computers at home only. An alternative policy is to give all students a laptop to use both at school and at home (the one- to- one intervention). In Chile, the “Yo elijo mi PC” program delivers 60,000 computers to the best students in the poorest 60 percent of the population. In Argentina, the “Mi PC” program aims to close the digital divide by facilitat-ing financfacilitat-ing and cuttfacilitat-ing the prices of computers.
Is it a good idea to provide students with computers to use at home? Proponents of this policy argue that computers may allow students to master digital skills that are in high demand in the labor market. They may also facilitate learning through the use of educational software or by providing students a plethora of con-tent and materials via the Internet. Critics fear that children may spend too much time playing computer games instead of exercis-ing, which could lead to weight gain. Also, children may be more exposed to violent and sexually inappropriate content and may face increased social isolation.
Clearly, these are strong cases. But what is the evidence? Establishing the causal effect of computer access on a variety of educational and social outcomes is difficult, because just compar-ing children who have access with those who do not may be biased, as typically students who have access come from higher- income households, attend better schools, and have better- educated par-ents. Two recent studies dealt with this issue using ingenious sta-tistical tools.
A program in Romania allocated limited vouchers to buy com-puters to families with incomes below a certain level. Children in families with incomes just below the threshold level were compared to those with incomes just above. Before receiving the
06_AChong_Ch06.indd 202
computers, these two sets of children were similar in a variety of observable dimensions (since being on one side or the other of the arbitrary cut- off was almost random); however, one group received a voucher to purchase a computer at a discounted price and the other did not. Hence, as in a randomized experiment, differences in outcomes for these children can be attributed to the effect of having a computer at home. It turns out that chil-dren in households that received the computers achieved signifi-cantly lower grades in mathematics, English, and Romanian, but demonstrated better ICT skills and performed significantly bet-ter in a test of cognitive ability (Raven’s Progressive Matrices). The decline in academic achievement can be traced to a decrease in time spent doing homework and reading (Malamud and Eleches, 2010).
Children who received the computers in the previously men-tioned study have had low access to the Internet, as this service was not subsidized. A question that arises is whether gaining access to the Internet may by itself produce better academic results. A sec-ond study focused on the state of North Carolina in the United States tackles this question. It exploits rich longitudinal data on test scores and local variations in when broadband Internet ser-vice was introduced. Results suggested that students who live in areas that transition from no Internet providers to several pro-viders experience a modest but significant drop in mathematics test scores; results for reading are also negative, but not significant (Vigdor and Ladd, 2010).
Computers at school and at home. In recent years, gov-ernments around the world have shown tremendous inter-est in distributing laptops to students that can be used both at school and at home; interest is even greater in Latin America and the Caribbean. Unfortunately, aside from studies that use observations and reports from program participants, very little
06_AChong_Ch06.indd 203
quantitative evidence exists regarding the impact of this type of program.
In 2009, a large- scale randomized evaluation was set in place by a technical team at the Inter- American Development Bank, with strong collaboration from the government of Peru. This ongoing evaluation estimates the impacts of the one- per- student program implemented in Peru on learning in math-ematics, Spanish, cognitive and noncognitive skills, and behavior, as well as on the mechanisms that generate these impacts. Results from this evaluation are expected to generate lessons for other countries that are contemplating implementing similar programs, as well as identifying ways to strengthen the program in Peru.
The study covered a sample of 320 schools in eight depart-ments. About two- thirds of these schools were assigned to the treatment group, while the rest were assigned to the control group. Between April and October 2009, treatment schools received lap-tops for each student and teacher in the school while teachers were trained. In November 2009, data were collected to document the short- term impacts of the intervention. At that point, schools had the computers for an average of three months, but exposure time varied substantially across treatment schools.
The government did an excellent job maintaining the evalua-tion design, as virtually all treatment schools received comput-ers, while fewer than 5 percent of control schools received them. Also, teacher training was completed in more than 80 percent of the schools, and typically followed the prespecified format. Lack of electricity or other logistical problems were not acute, nor were cases of theft or computer malfunction prevalent. Teachers used laptops primarily for Spanish, mathematics, art, and science. The most- used applications were word processor, sound and video recorder, calculator, paint, and Wikipedia. Some 18 percent of teachers used the computer every day for teaching purposes, 33
06_AChong_Ch06.indd 204
percent used it three to four days a week, 40 percent used it one or two days a week, and only 10 percent did not use the laptops in class. Teachers who had the laptops available longer seemed to use them less frequently in class, suggesting that some pedagogi-cal support would be needed to ensure proper use over time.
According to surveys of parents and students, 56 percent of stu-dents took their laptop home and typically did so every day. Those who did not take it home blamed their parents’ concerns that the computer could get damaged, broken, or lost. Surprisingly, the program did not affect attendance and expectations regarding the future academic achievement of students. Even more surpris-ing, students’ motivation to attend school and do their homework was significantly lower in the beneficiary schools than in the con-trol group, though the difference was quantitatively small. On the positive side, teacher satisfaction with their relationship with peers, parents’ associations, and especially with students was sig-nificantly impacted. Some 49 percent of teachers in the treatment group were very satisfied with their relationship with students, compared to 34 percent in the control group. A second follow- up is expected at the end of 2010, which may yield important evidence regarding impacts on test scores in mathematics and Spanish, as well as on measures of cognitive and noncognitive skills, behav-ior, and expectations.
Policy Recommendations: Strategies to Implement ICT in Schools
“Dress me slowly, for I am in a great rush.”
–Napoleon Bonaparte Experiment and evaluate. The last few years has witnessed a flurry of high- quality research on the impacts of ICT in edu-cation. However, significant uncertainty still surrounds these
06_AChong_Ch06.indd 205