University of Wisconsin Milwaukee
UWM Digital Commons
Theses and DissertationsDecember 2015
Modeling the Feasibility of Corn Stover
Combustion as a Heat Source at Corn Ethanol
Plants
Sulekha Tamvada
University of Wisconsin-Milwaukee
Follow this and additional works at:https://dc.uwm.edu/etd Part of theMechanical Engineering Commons
This Thesis is brought to you for free and open access by UWM Digital Commons. It has been accepted for inclusion in Theses and Dissertations by an
authorized administrator of UWM Digital Commons. For more information, please contactopen-access@uwm.edu.
Recommended Citation
Tamvada, Sulekha, "Modeling the Feasibility of Corn Stover Combustion as a Heat Source at Corn Ethanol Plants" (2015).Theses and
Dissertations. 1085.
MODELING THE FEASIBILITY OF CORN STOVER COMBUSTION AS A HEAT SOURCE AT CORN ETHANOL PLANTS
by
Sulekha Tamvada
A Thesis Submitted in Partial Fulfillment of the Requirements for the Degree of
Master of Science in Mechanical Engineering
at
The University of Wisconsin- Milwaukee December 2015
ABSTRACT
MODELING THE FEASIBILITY OF CORN STOVER COMBUSTION AS A HEAT SOURCE AT CORN ETHANOL PLANTS
by
Sulekha Tamvada
The University of Wisconsin- Milwaukee, 2015 Under the Supervision of Dr. John Reisel
Alternative energy sources are of prime interest for most of the nations across the world. Rising fuel prices and depleting petroleum reserves are of serious national and global concern. Bio-fuels if proved feasible for larger scale implementation could become the ideal breakthrough in easing the extensive dependence on fossil fuels and retaining the current engine technology of fossil fuels. Current methods of producing bio-fuels rely heavily on the consumption of non-renewable energy in the production process. Therefore, it is desirable to find renewable alternatives to these non-renewable energy sources.
Although bio-mass based fuels have been tested and proven to be applicable in gasoline engines, the technology must be studied and extended for implementation at a larger scale.
This study models the feasibility of corn stover as a heat source at corn ethanol plants. It states the amount of corn stover required for the necessary heat requirement and the model also considers the harvesting techniques, transportation costs, storage costs and the implementation costs. Six ethanol plant locations were considered and evaluated for the viability of installing a biomass fired system in addition to estimating the amount of raw material needed to run the plant. The biomass systems have a decent payback period but are not being realized due to the initial costs involved and the inclination towards cellulosic ethanol. But, that is a technology of the future and
iii
there is an immediate need to sustain the biofuels industry and this can be done through using biomass as a heat source. This model can be used for different locations as a number of parameters can be changed making it very flexible. This model will aide in the development stages of the project and will need an advanced investigation if moved forward through with the project.
TABLE OF CONTENTS
ABSTRACT ... ii
TABLE OF CONTENTS ... iv
LIST OF FIGURES ... vii
LIST OF TABLES ... ix
CHAPTER 1 : INTRODUCTION ... 1
CHAPTER 2 : BACKGROUND ... 4
2.1 Introduction ... 4
2.2 Energy demand and consumption ... 4
2.3 Biofuels ... 11
2.4 Ethanol ... 14
2.4.1 Introduction ... 14
2.4.2 Ethanol Use ... 15
2.4.3 U.S. Ethanol Market ... 16
2.4.4 Food versus Fuel Debate ... 19
2.4.5 Production Process of Ethanol ... 21
2.5 Summary ... 22
CHAPTER 3 : LITERATURE REVIEW ... 23
3.1 Report on Previously-Published Literature ... 23
3.2 Biomass Combustion ... 23
3.2.1 Types of Biomass ... 23
v
3.2.3 Conversion process to Bioenergy ... 28
3.3 Feedstock Supply ... 33
3.3.1 Corn Stover ... 33
3.3.2 Harvest techniques ... 34
3.3.3 Transportation and Storage systems ... 36
3.4 Summary ... 37
CHAPTER 4 : MODELING TECHNIQUE AND APPROACH ... 38
4.1 Introduction ... 38
4.2 Feedstock Requirement ... 39
4.3 Project Costs ... 45
4.3.1 Costs of feedstock supply ... 45
4.3.2 Investment Costs ... 57
4.4 Payback Period ... 61
4.5 Evaluating the model ... 63
4.6 Summary ... 63
CHAPTER 5 : VALIDATION OF THE MODEL AND DISCUSSION ... 64
5.1 Introduction ... 64
5.2 Verifying and evaluating feedstock requirement model ... 64
5.3 Verifying the harvesting model ... 72
5.4 Verifying and evaluating the transportation model ... 76
5.5 Verifying and Evaluating the Investment costs ... 83
5.5.1 Capital Costs (CC) ... 83
5.5.3 Fuel Costs (FC) and Ash disposal costs ... 88
5.5.4 Total Costs (TAC) and Total Savings (TS) ... 90
5.6 Payback Period ... 92
5.7 Summary ... 97
CHAPTER 6 : CONCLUSIONS AND RECOMMENDATIONS ... 99
6.1 Conclusions ... 99
6.2 Recommendations ... 100
vii
LIST OF FIGURES
Figure 2.1: World Energy Consumption (Institute for Energy Research) 5
Figure 2.2: World Energy Demand, projected to 2035. (US-EIA, 2013) 6
Figure 2.3: Petroleum Consumption by Sector in the U.S (US-EIA, 2015) 8
Figure 2.4: World Oil Prices in three cases, 1995-2040 (US-EIA, 2015) 9
Figure 2.5: EV spending by category (2008-2012) 10
Figure 2.6: EV spending by category (2008-2014) 10
Figure 2.7: RFS Volumes by Year [14] 12
Figure 2.8: Aerial view of POET-DSM cellulosic ethanol plant (US-EIA, 2014) 13
Figure 2.9: Corn Production by County and Location of Ethanol Plants [23] 18
Figure 2.10: Corn Production and Corn Used for Fuel Ethanol Production [31] 20
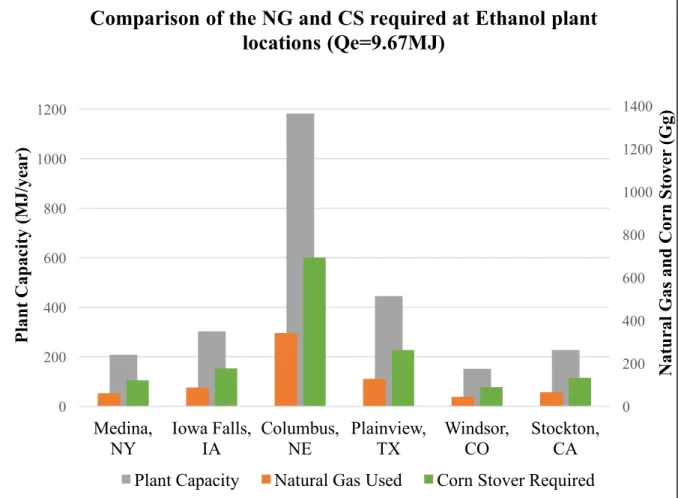
Figure 5.1 Comparison of the amount of natural gas and corn stover required at ethanol plant
locations (Qe=9.67MJ) 67
Figure 5.2 Comparison of the amount of natural gas and corn stover required at ethanol plant
locations (Qe=20MJ) 68
Figure 5.3 Comparison of the amount of natural gas and corn stover required at ethanol plant
locations (Qe=5MJ) 69
Figure 5.4 Comparison of the amount of corn stover available and required at ethanol plant
locations (Qe=9.67MJ) 70
Figure 5.5 Comparison of the amount of corn stover available and required at ethanol plant
locations (Qe=17MJ) 71
Figure 5.6 Model output of transportation costs for each location for different harvest scenarios 82
Figure 5.7 Comparison of the capital costs for a biomass fired and natural gas systems at each
location 85
Figure 5.8 Comparison of the operations and maintenance costs for biomass and natural gas
system at each location. 87
Figure 5.9 Comparison of fuel costs of the different harvest scenarios at each plant location. 89 Figure 5.10 Comparison of the project costs for the biomass system for different scenarios at
each location 91
Figure 5.11 Model output for payback period of different location incorporating different
scenarios 93
Figure 5.12 Comparison of the cumulative savings and the payback period for each location
(Price=8$/GJ, %increase=5) 94
Figure 5.13 Comparison of the cumulative savings and the payback period for each location
(Price=8$/GJ, %increase=3.3) 95
Figure 5.14 Comparison of the cumulative savings and the payback period for each location
(Price=6$/GJ, %increase=5) 96
Figure 5.15 Comparison of the cumulative savings and the payback period for each location
ix
LIST OF TABLES
Table 2.1: Fuel grade properties of Gasoline and Ethanol 14
Table 2.2: Ethanol Blends in various countries 16
Table 3.1:Characteristic enrichment and depletion trends for the chemical characteristics (mean
values) among the biomass groups and sub-groups specified. 27
Table 3.2: Conversion processes of biomass 29
Table 3.3: Heating values and typical applications for different grades of syngas 31
Table 4.1 Ethanol plant inputs and typical values on the spreadsheet model. 40
Table 4.2 Spreadsheet model outputs for Ethanol plant 44
Table 4.3 Different harvest scenarios and the type of equipment used for each. 46
Table 4.4 Spreadsheet inputs and typical values for the harvesting costs section. 47
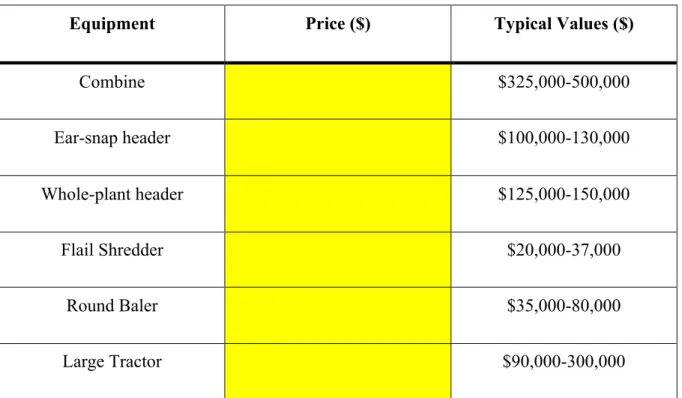
Table 4.5 Typical economic details for the stover harvesting equipment’s used. 48
Table 4.6 Spreadsheet model outputs for the ownership costs section. 49
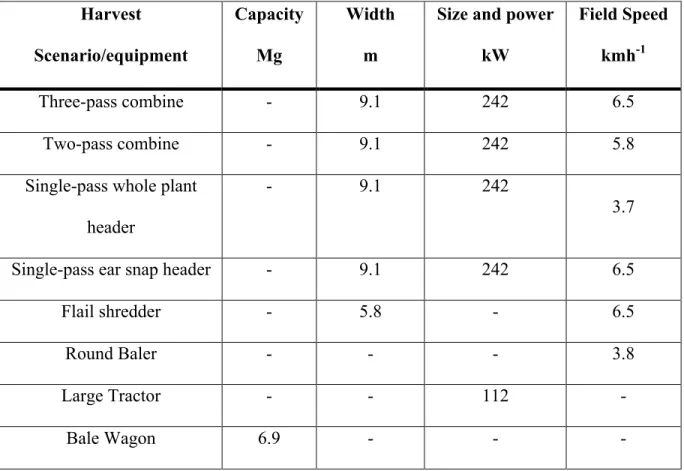
Table 4.7 Typical size and field speed of equipment used. 52
Table 4.8 Spreadsheet model outputs for the operating costs. 53
Table 4.9 Spreadsheet model outputs of the harvesting costs for different scenarios 54
Table 4.10 The model inputs and outputs to calculate the cost of transporting biomass 56
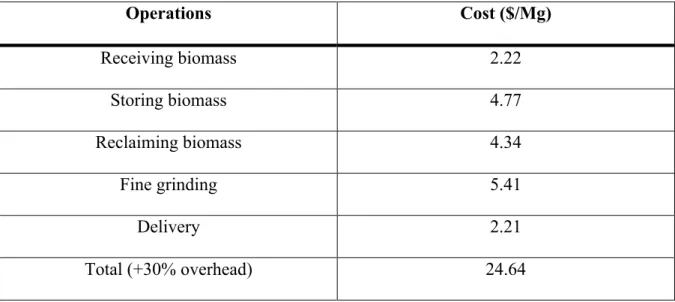
Table 4.11 The estimated costs for receiving, storing and delivery of biomass to boiler. 56
Table 4.12 The total delivered cost 57
Table 4.13 Technical and economic data for the process heat generation system. 61
Table 4.14 Natural Gas inputs for the calculation of cumulative savings 62
Table 5.1 Output values for the corn used and comparing it with literature data and ethanol
plants. 65
Table 5.2 Comparison of the amount of corn stover and natural gas requires for the necessary
heat requirement with literature data 66
Table 5.3 Input data for the harvesting model 73
Table 5.4 Comparison of the model output with literature data for the different harvesting
systems 74
Table 5.5 Model output when gasoline tractors are used 74
Table 5.6 Comparison of prices of gasoline and diesel tractors for the harvest scenarios with
higher combine and header prices. 76
Table 5.7 Comparison of the transportation model outputs with the literature 77
Table 5.8 Comparison of the transportation model outputs with different heat requirement for the
different harvest scenarios 79
Table 5.9 Comparison of the transportation model output for truck and wagon with the same heat
requirement. 80
Table 5.10 Input data for the transportation model for each plant location 81
Table 5.11 Comparison of the model output of capital costs of the biomass fired system and
natural gas systems with literature 84
Table 5.12 Comparison of the model output with the literature data for the operation and
maintenance costs of a biomass and natural gas systems. 86
Table 5.13 Comparison of the fuel costs of the harvesting scenarios of the biomass system with
the literature data. 88
xi
LIST OF ABBREVIATIONS
AFDC Alternative Fuels Data Center
AKI Anti-Knock Index
ASABE American Society of Agricultural and Biological Engineers
BTU British Thermal Unit
CA California
CO Colorado
CS Corn Stover
DOE Department of Energy
EIA Energy Information Administration
EISA Energy Independence and Security Act
EPA Environmental Protection Agency
ESP Electrostatic Precipitator
EV Electric Vehicle
EVI Electric Vehicles Initiative
GHG Greenhouse gases
I.C Internal Combustion
IA Iowa
IEA International Energy Agency
IER Institute for Energy Research
MLY Million Liters per year
MMBTU Million British Thermal Unit
MON Motor Octane Number
MTBE Methyl Tertiary Butyl Ether
NE Nebraska
NG Natural Gas
NHV Net heating value
NY New York
OECD Organization for Economic Co-operation and Development
OPEC Organization of the Petroleum Exporting Countries
PADD Petroleum Administration for Defense Districts
PTO Power Take-off
RFA Renewable Fuels Association
RFS Renewable Fuel Standard
RON Research Octane Number
TX Texas
USDA U.S. Department of Agriculture
VEETC Volumetric Ethanol Excise Tax Credit
xiii
LIST OF SYMBOLS
A" Amount of Corn
A"# Amount of Corn Stover
A"#$ Amount of Corn Stover Available
A%" Annual fuel consumption
A&' Amount of Natural Gas
A# Amount of Soil Required
P)*+ Power of the equipment
Q$-* Thermal Energy Available
Q./0 Average fuel consumption
Q1 Heating Energy Requirement
Q*+* Total Heat Requirement
CC Capital costs
D Depreciation
FC Fuel costs
L Lubrication costs
LC Labor costs
O&M Operations and maintenance
P Payback period
P Payback period
PP Purchase price
Qs Specific fuel consumption
R&M Repair and Maintenance
RF Repair factor
SI Simple annual interest
SP Salvage price
TAC Total annual costs
TC Hourly cost of transportation
1
CHAPTER 1
: INTRODUCTION
Energy has been a necessity from time immemorial. As the world advanced, so did the different ways of producing and utilizing the energy. For over a century, fossil fuels and other non-renewable energy resources have been predominantly used in transportation, industrial, commercial and residential sectors. Although these resources are available abundantly and are
sustainablefor the years to come, their demand and consumption pattern is causing an imbalance
in the environment with far-reaching implications. Renewable resources are more widely available which reduces the dependence on oil imports from politically-unstable regions. There is a tremendous interest, in particular, to search for an alternative fuel for transportation purposes as major production of these fuels is from petroleum. Concerns on the disturbances in the ecosystems and energy security have prompted the need to search for alternatives. Hence, there has been extensive research on biofuels as one method for sustainable development.
Ethanol, one among the biofuels, has a good market in the U.S for use in spark-ignition engines as a fuel additive and an oxygenate. Ethanol is regarded as a potential alternative fuel as it is made from corn that uses solar energy to grow, but the production process of ethanol requires large amounts of process heat which is obtained from natural gas. Hence, there is a need to increase the amount of renewable energy that is used during the production process so as to reduce the consumption of fossil fuels, reduce the greenhouse gas emission and improve the energy costs of the plant.
The renewable source that can be considered for the heat requirement is biomass combustion. Combustion is a technology that has been well-developed and biomass is a resource that can be made readily available. Ethanol is produced from corn, and the residue that is left-over in the field can be considered as a potential feedstock for biomass combustion.
The major purpose of this project is to create a model to evaluate the feasibility of using corn stover combustion for the necessary process heat at the ethanol plant. The model can be used with plant-specific information to accurately estimate the amount of corn stover that is required to replace natural gas as a heat source. The project takes into account the harvesting, storage and transportation costs to estimate the feasibility of using biomass as a potential heat source. It also takes into account the current natural gas prices to give a fair estimate of the pay-back period and cost-savings of the installation of a combustion plant. There are various factors to be considered for the economics of the stover combustion and it is not quite straightforward. There are different harvesting techniques and the choice of the technique depends on the certain location and the harvest window which is hard to determine because of the changing weather conditions.
This project is an extension of the work of Kumar (2009) where he created a model for the energy requirements of a dry mill ethanol plant and which was continued by Ehrke (2012) where she modelled the installation of wind and solar energy at ethanol plants. This work explores the possibility of using a different alternative energy source, biomass combustion, for replacing the process heat in ethanol production facilities.
The renewable energy sector continues to grow and has renewed interest in developing new technologies to improve the efficiency of vehicles, improve the process of producing biofuels, and decrease the equipment prices due to the environmental policies, and security concerns. The growth in market leads to a more economical process.
The following chapters discuss the global energy market and the trends in the U.S as to how ethanol production is expanding. Market projections for the energy sector is also been shown to indicate what the future of energy and the energy costs look like in the next couple of years. Prior to examining the feasibility of corn stover combustion, an extensive literature review of the
3
ethanol production process, the combustion processes of biomass and the harvesting methods of corn stover was conducted and this is presented in Chapter 2. Then a descriptive model is analyzed and the approach for building the model along with determining the costs is discussed. In the Conclusions and Recommendations, the effectiveness of the modeling and further improvements has been discussed.
Biofuels will play an important part in a country’s economy and in the future of energy sector. Using biomass combustion as a heat source for ethanol plants significantly reduces the consumption of fossil fuels thereby, reducing overall energy costs.
CHAPTER 2
: BACKGROUND
2.1 Introduction
As the world energy demand increases, energy has become a major concern in both political and environmental world security. Fossil fuels dominate as a primary energy source in any economic sector. Although these fuels have at least a few decades before they are cost prohibitive, it is important that we search for alternative sources so as to avoid energy shortages later and also, there needs to be sufficient time to make such sources sustainable. The world economy is a major factor in determining energy trends and demand. Biofuels, wind, and solar are not only sustainable for the future generations but, they also provide a viable solution to the reduction of the consumption of fossil fuels.
The following sections give a brief background of the world’s energy demand and consumption patterns, the transportation sector, ethanol properties and the use of biofuels in the U.S. market.
2.2 Energy demand and consumption
For many centuries, a primary source of energy to heat houses and provide power to the world around us was wood. During the Industrial Revolution, coal and oil took over as the major energy sources. Since then, the world energy consumption has been doubling every 14 years. Studies indicate that coal and oil do not have the potential to be sustainable for the future generations. [1] [2]
According to EIA [3], global production of energy will be the same as the consumption of energy for the year 2016. This pattern may remain constant for a while but various studies indicate that it will become increasingly difficult to extract the resources in the required quantities. [2] [4]
5
2) Non-renewable Energy Sources. While the former refers to the sources that have the potential to be sustainable, the latter refers to the sources which are not environmentally sustainable for the future generations. Examples for renewable energy sources are 1) wind,
2) solar, 3) geothermal, 4) hydro-power and 5) biofuels. Examples of non-renewable sources are 1) coal, 2) oil, 3) natural gas and 4) nuclear fuel.
As can be seen in Figure 2.1, fossil fuels/non-renewable fuels account for about 91% (30% coal, 24% natural gas, 33% oil and 4% nuclear) of the world’s energy consumption out of which 51% is accounted to the transportation sector and the remaining for the industrial, commercial and residential sectors. [5]
Studies estimate that based on expected reserves and consumption patterns, the time remaining before coal reserves are exhausted is 217 years, while natural gas has 65 years and oil has 42 years [2]. These are best estimates for the lifetime of the fossil fuels as they cannot be stated with certainty because of the unknown future changes in energy demand as well as uncertainty in finding additional reserves. Declining supplies will dramatically increase the cost of energy unless there is a shift toward unconventional/renewable sources. In addition, these non-renewable sources have an environmental impact with huge consequences.
Figure 2 contains an outline of the projected world energy demand as given by the US Energy Information Administration in their publication of the World Energy Outlook 2014. It can be seen that Asia is the growing dominance in energy trade and demand. It can also be noted that, China dominates Asian demand closely followed by India.
7
As can be seen from Figure 2.2, the countries outside of the Organization for Economic Cooperation and Development (OECD) will account for a 60% increase in the demand for energy by 2035 as their economies continue to grow while that of the OECD countries have insignificant increase in energy demand. According to the EIA, the energy use per capita for the OECD countries will change very little from 190MMBTU in 2010-2040 while the non-OECD countries will see a rise from 50MMBTU to 73MMBTU by 2040.
This energy growth is mostly in the liquid oil consumption in the transportation sector and so there is a continued need for the increase and development of renewable sources in this sector. This will result in lowering the dependence of foreign oil in the United States as the consumption would lower quite significantly.
The global energy market is unstable and will result in conflicts as the demand for energy rises. Throughout the history of the energy market, there have been two oil crises in the United States, the first one in 1973 and the second, in 1979. This brought gas shortages, economic recessions and the need for energy conservation. As a result of the second crisis, in 1978, the United States government eliminated a federal fuel tax on gasoline blended with 10% ethanol. This still continues as a method of reducing gasoline consumption and as a result, increases the energy independence of the United States.
Petroleum, which includes crude oil, gasoline and diesel fuel, is by far the largest energy import and the most-consumed form of energy in the U.S. In 2014, according to EIA, the U.S imported about 9 million barrels per day (MMb/day) of petroleum from 75 countries and exported about 4 MMb/day resulting in net imports of 5 MMb/day. About 46% of the crude oil that was processed in the U.S refineries was imported [6]. This accounts for about 27% of the net import consumption, the lowest level seen since the year 1985.
As shown in Figure 2.3, the transportation sector accounts for about 80% of the petroleum consumption in the U.S. [7] Renewable fuels account for only about 7% of the consumption in this sector. This shows that petroleum imports and usage in the U.S market greatly influences the economy of the country and also, makes it dependent on foreign oil.
Figure 2.3: Petroleum Consumption by Sector in the U.S (US-EIA, 2015)
The increase in oil consumption and the decrease in the available sources has resulted in the development of gasoline alternatives. It should be noted that the price of oil depends on the discovery of new oil sites, the state of global economy, and global relations.
Figure 2.4 shows the world oil prices in three cases. The first is the reference case where the oil price decreases from 39% in 2014 to 37% in 2020 as a result of the U.S crude oil production and the decrease in world oil prices. It increases to 41% by 2040 in response to the demand in OECD countries. The second, is the Lower Oil price case where the oil prices increases slowly from 2015 to 2040 as a result of higher investment by OPEC and low demand by OECD countries. This case sees a rise from 38% in 2015 to 51% in 2040. The third, is the Higher Oil price case
9
where the oil prices increase as a result of significant reduction in the OPEC production coupled with high OECD countries demand. This case will see a decrease to 33% by 2025 and then an increase to 33% by 2040. [8]
Figure 2.4: World Oil Prices in three cases, 1995-2040 (US-EIA, 2015)
There was a rise in oil prices in the early 1980s as a result of the two oil crises in the 1970s. It rose through the 2000s as well but, as a result of the economic downturn, it dropped in 2008. The world demand for oil in comparison to the oil supply determines the cost of oil and the oil prices are currently dropping. But, referring back to Figure 2.4, we notice that the oil prices are highly unpredictable and this is one of the many reasons to look for an alternative source.
The transportation sector can be made sustainable through the use of electric/hybrid vehicles and also, biofuels. Electric vehicles are those vehicles which run on an electric motor and a rechargeable pack of Lithium-ion batteries. These vehicles have the potential to remove the present internal-combustion engines entirely out of the equation resulting in lower petroleum consumption. Although there are advantages and advances in vehicle electrification, there are significant barriers that are unavoidable in the face of widespread adoption. These barriers could be in the form of technology, finance, market or policy challenges and hence, an electric vehicles initiative (EVI) has been launched by IEA in 2010 with over 16 member governments. This is dedicated to the acceleration of the introduction and adoption of electric vehicles. They aim at overcoming these barriers by investing in research, innovative policy and business solutions. [9]
Figure 2.5: EV spending by category (2008-2012)
Figure 2.6: EV spending by category (2008-2014)
As shown in Figure 2.5 and 2.6, the Global EV Outlook published by the IEA for the year 2015 shows an increase in investments for infrastructure and fiscal initiatives from 2012-2014, resulting in a decrease of battery costs and an increase in sales of electric vehicles. [10] [11]
Although, there has been considerable growth in the electrification of the global vehicles, it still occupies only a 1% share in the global market. This suggests that the globalization of electric
11
vehicles is a long-term ambition. Hence, there is a need for a sustainable fuel for the present generation and for the near future.
2.3 Biofuels
Biofuels are fuels which are processed from biomass and bioenergy is the energy that is derived from these fuels. Biofuels are those fuels that are produced from plant matter and they are deemed as carbon-neutral sources as they absorb carbon-dioxide from the atmosphere for the process of photosynthesis. There are two types of biofuels:
1. First-generation biofuels-they are derived from biological sources such as starch, animal fats, sugar and vegetable oil. The processes to produce these fuels is developed and currently in practice throughout the world. Examples include ethanol, biodiesel and biogas.
2. Second-generation biofuels-they are considered to be advanced sustainable fuels and
the production techniques are currently under research. These are derived from cellulosic materials like agricultural bi-products and are considered to be more sustainable. An example is cellulosic ethanol.
The U.S has taken a stance for developing renewable fuels by introducing tax incentives ethanol-blended gasoline in 1978 which continues even today to reduce the dependence on foreign oil. Kauffman et.al states the Energy Policy Act of 2005 which created the RFS program and was subsequently revised and expanded followed by the EISA of 2007 and is currently referred to as RFS2 [12]
The RFS program is a policy to reduce the GHG emissions along with increasing energy security for the U.S. The policy requires a certain volume of a renewable fuel to be mixed with petroleum-based transportation fuel. The expansion of the program requires increasing amounts of
renewable fuel to be added to the transportation fuel escalating by 2022 to about 36 billion gallons. [13]. Figure 2.7 shows the volume requirements that have been established based on the EISA-legislated standards by the EPA which administers the RFS program.
Figure 2.7: RFS Volumes by Year [14]
The four categories of biofuels which are included in RFS2 are as follows.
1. Total Renewable Fuels-These have to reduce the lifecycle of GHG emissions by at least
20% to qualify and the potential feedstock includes corn. The mandate grows to nearly 36 billion gallons by 2022.
2. Advanced Biofuels-They have to reduce the lifecycle of GHG emissions by 50% to qualify.
The potential feedstock includes non-corn feedstocks like sorghum or wheat and cellulosic materials. The mandate grows to 21 billion gallons by 2022.
13
3. Biomass-based Biodiesel-They have to reduce the lifecycle of GHG emissions by 50%.
The potential feedstock would be the one which can be processed to diesel fuel.
4. Cellulosic Biofuels-These have to reduce the lifecycle of GHG emissions by 60%. The
potential feedstocks are cellulosic materials.
From Figure 2.7, it can be seen that the regulations established shows impressive increase in the use of biofuels, increasing the production of these fuels. It can be seen that the production of conventional biofuels is constant while there is a moderate growth in cellulosic biofuels and the advanced biofuels.
The realization of the RFS mandates is delayed as there has not been much progress in the production of cellulosic ethanol. However, there are three cellulosic ethanol plants that have been recently opened and are expected to offer production of cellulosic ethanol at a meaningful scale. [15]
The RFS mandates help reduce the gasoline consumption which in turn reduces oil imports which improves the U.S energy independence. The biofuels can also reduce GHG emissions at a significant level.
2.4 Ethanol 2.4.1 Introduction
Ethanol has been in use for many years as a fuel additive to reduce pollution, improve the octane rating of the fuel and to reduce gasoline consumption. Ethanol, otherwise known as ethyl alcohol is an alternative fuel that is an oxygenate and an octane enhancer [16]. It is hydroscopic, corrosive to common metals that are used in fuel systems and has less energy than gasoline, but the heating value is significantly lower. As can be seen from Table 2.1, the octane rating and heat of vaporization are higher for ethanol as compared to gasoline. [17][18]
Table 2.1: Fuel grade properties of Gasoline and Ethanol
Property Gasoline Ethanol
Research Octane Number 91-93 109
Motor Octane Number 81-84 90
Anti-knock Index 87-88 99
Density(kg/L) 0.75(0.72-0.78) 0.79
Heat of vaporization(kJ/kg) 349 921
Reid Vapor Pressure at
37.8°C (mmHg)
414-776 119
Net Heating Value(NHV) MJ/kgfuel
15
The octane rating is a measure of the fuel’s ability to resist auto-ignition and knock in spark ignition engines. The anti-knock tendency of fuels is determined by two tests: the research octane number (RON) and the motor octane number (MON). The anti-knock index (AKI) is an average of RON and MON and has been used as an octane rating for gasoline in the U.S. The modern engines performance is now better correlated with RON than AKI. Ethanol-gasoline blends have improved octane ratings and the RON increase is essentially linear when evaluated using molar ethanol content. [19] [17]
2.4.2 Ethanol Use
Ethanol blends of E5-E25 are typically used in more than 20 countries in the world. The list of ethanol blends used around the world are shown in Table 2.2 [17]
E100 is a good fuel for I.C Engines because of the properties mentioned earlier but, has poor cold-start properties. On the other hand, E85 has similar cold-start properties as that of 87 octane gasoline. Ethanol addition to gasoline has its own challenges, including increasing (or decreasing) the Reid vapor pressure (RVP) and preventing the transportation through existing pipeline systems due to risk of contamination by water. In the U.S, 90% of the gasoline blends are transported by train or truck. (Kutz, 2008)
Table 2.2: Ethanol Blends in various countries
Country Ethanol Blends Legal Use
USA E10/E15/E85 Mandated only in certain states
Brazil E20-E25 Mandated
Canada E5 Mandated
China E10 Nine provinces
India E5 Mandated
Netherlands E5/E10/E15 Optional
Mexico E6 Mandated
Thailand E10/E20 Mandated
Austria E10 Optional
Denmark E5 Optional
Finland E5/E10 Mandated
Germany E5/E10 Optional
Ireland E4 Mandated
Romania E4 Mandated
Sweden E5 Mandated
2.4.3 U.S. Ethanol Market
The U.S and Europe use E85 in flexible-fuel vehicles and Brazil uses blends of E20-E25. It is primarily processed from corn in the U.S and sugarcane in Brazil. Ethanol can be processed from agricultural wastes/bi-products and has shown promising advantages over corn ethanol, but this is still in the development phase.
17
As of January 1, 2015 EIA reported that there are 195 ethanol plants with a total nameplate capacity of 14,757(MMgal/year). The majority of ethanol production capacity of 13,151 MMgal/year comes from PADD 2 district which is the mid-west area. [21]. This is because the plants are located in closer proximity to the corn-producing farms thereby reducing the transportation costs and ensures adequate supply. Figure 2.9 shows the location of ethanol plants in the United States as of the year 2013 and also, includes the corn production by county.
The U.S consumes about 130-145 billion gallons of gasoline blends a year. These blends only consisted about 10% ethanol. The U.S has recently opened market to E15 and vehicles have not reported any cases of engine damage. Today, E15 is approved for all vehicles built in 2001 or later and is being sold in 12 states, primarily in the mid-west regions. In addition, sales of FFV’s have escalated in response to the RFS requirements and favorable economics. [22]
Figure 2.9: Corn Production by County and Location of Ethanol Plants [23]
Advances in technology, improved productivity in corn farming and ethanol conversion together with biofuel policies have contributed significantly for the growth of this industry in the past 20 years [24]. For ethanol to be competitive in today’s market, government subsidies are required. In the U.S, the Volumetric Ethanol Excise Tax Credit (VEETC) is a policy to subsidize the production of ethanol. The tax breaks include "a 45-cent a gallon tax credit for gasoline blenders, a 54-cent a gallon tariff on imports, a $1.01 a gallon credit to cellulosic ethanol producers, and a 10-cent a gallon small-producer tax credit for ethanol." [25] This credit has been extended until the year 2016. Although there is a lot of criticism surrounding these subsidies, they return more revenue to the U.S Treasury than they cost [20]. This returns to the consumer in the form of
19
lower pump-prices. According to Consumer Federation of America, consumers could be saving $0.08 per gallon when purchasing gasoline with 10 percent ethanol as compared As a result, the U.S continues to have a secure energy supply and it has established itself as a major exporter of ethanol.
2.4.4 Food versus Fuel Debate
As the world progresses towards sustaining the development of biofuels, there are concerns that these fuels are competing with food production. In other words, there is a risk of diverting farm lands for the production of crops that may reduce the potential food supply. This is a more pronounced dilemma in the U.S as ethanol is produced from corn which is one of the largest sources of food in the nation. However, a number of studies and reports contradict these claims [26].
According to USDA, the corn crop that has been harvested in the year 2014/15 has a 5% decrease from the previous year. But the yield per acre has increased by 7.5% for the year 2014/15 from the previous year. [27] Figure 2.11 shows the production of corn in the U.S along with corn actually used for ethanol production. This shows that although the production rates are high for corn and the yield is increasing by every year as the farming techniques continue to improve, the corn that is used for ethanol production is only about 26%. [22]
The DOE continues to stress the importance of biofuels in the fuel market despite these debates in order to deviate the market from the volatile foreign energy markets. The USDA and DOE have conducted an assessment survey and concluded that the forest and agricultural resources have the potential to sustain the supply of 1/3rd of the nation’s current petroleum consumption,
without compromising on the food supply [28]. This shows that the nation has very high hopes for the future of cellulosic ethanol and the advanced biofuels.
This debate leads to the claims that ethanol has a negative energy balance, lowers the fuel economy and increases GHG emissions. The DOE reports a negative energy balance for gasoline which means that it takes more energy to produce than what is delivered [29]. There are claims that this is the same case with ethanol but, others disagree on the basis that the co-products in the process have not been adequately accounted for [30].
Figure 2.10: Corn Production and Corn Used for Fuel Ethanol Production [31]
Corn ethanol net energy balance is about 0.73 BTU energy in to deliver 1BTU while the cellulosic ethanol net energy balance is about 0.1 BTU. [32] The co-products can be used as animal feed and the energy required to produce them can be replaced and hence, have to be considered for the energy balance. Advances in technology and better farming techniques have considerably increased the efficiency of this industry.
The DOE has reported that biofuels burn cleaner than gasoline and are completely bio-degradable. The GHG emissions vary by feedstock and corn ethanol has the potential to reduce the emissions by 52% while cellulosic ethanol has the potential to reduce it by 86% [29]. Unlike
21
MTBE that was used as a fuel additive, ethanol is a clean burning additive. Even though there have been some disparities regarding the reduction of the lifecycle of GHG, ethanol still displaces about 500 million barrels of petroleum thus ensuring energy security.
The production of ethanol along with the government subsidies for biofuels enable the U.S to be independent of energy imports upto a significant level. It also makes the nation a world leader in the exporter of ethanol. Hence, there is a need to sustain this industry by relying on renewable fuels in the production process.
2.4.5 Production Process of Ethanol
The production method of ethanol depends on the feedstock used. For starch or sugar-based feedstocks, the process is short as compared with that of cellulosic feedstocks. Most of the ethanol in the U.S is produced from starch-based crops and 80% of the plants use the process of dry-milling as it is economical [14]. This is a production process where the corn is ground to a flour and fermented to ethanol with co-products of carbon-dioxide and distillers grains.
Typically, this process consists of grain handling and milling, cooking, liquefaction and saccharification, fermentation, distillation, dehydration and co-product recovery. Grain handling and cooking includes the corn that is brought to the facility and is ground to produce starch. Liquefaction and saccharification is the process where starch is converted to glucose and is fermented with yeast to produce beer. Distillation is the process of beer-to-ethanol conversion and is dehydrated to obtain pure ethanol. Co-product recovery is the process where the co-products are made market-ready. The main co-product, distillers grains, is sold as an additive to livestock feed. This is another reason for the location of ethanol plant close to farms as it significantly reduces the energy for transportation of the co-products. As of 2013/14, the U.S ethanol industry produced
about 39.2 million metric tons (mmt) of feed, making the renewable fuels sector one of the largest feed producing sectors. [33]
A typical ethanol plant requires 34695 BTU of process heat and 1.09 kWh of electricity to produce about 1 gallon of ethanol [34]. A survey that was conducted has shown that there has been a decrease in the amount of process heat and the amount of corn required to produce the same gallon of ethanol [35]. About 70% of the total process heat in an ethanol plant is required for the cooking and fermenting process. One of the major reasons corn ethanol is not considered completely renewable is the high amounts of heat requirement for the cooking and fermenting process. Over 90% of the facilities use natural gas for process heat and reducing this usage will make the production process of ethanol more sustainable.
2.5 Summary
From the study of the production process of ethanol, it can be seen that the process required high amounts of energy and has to be made sustainable to align with U.S goals of increasing the use of biofuels and reduce the pollution. Most importantly, this increases the energy security of the nation and helps it reach its energy goals.
23
CHAPTER 3
: LITERATURE REVIEW
3.1 Report on Previously-Published Literature
The main focus is to provide a thorough literature review on biomass combustion and its use as a heat source at Ethanol plants. This also discusses the harvest techniques and storage solutions for corn stover. As to how these are being incorporated in the project as been summarized at the end of this chapter.
3.2 Biomass Combustion 3.2.1 Types of Biomass
Biomass encompasses the living matter on Earth. It is a non-fossil and complex organic-inorganic source that is obtained from several natural or man-made processes [36], [37], [38], and [39]. Biofuels are fuels obtained from the processing of biomass and the bioenergy is the energy that is obtained from these fuels [36], and [39]. Biomass can be obtained from various sources depending on their origin [36], [37], (Vassilev S B. D., 2013). These sources are as follows.
1. Woody biomass- coniferous, stems, branches, bark, lumps and various other species.
2. Herbaceous and agricultural biomass-grasses and flowers, straws and their residues
3. Aquatic biomass-Algae, seaweed, marine or freshwater and others.
4. Animal and human wastes- meat-bone meal, manures, sponges, others.
5. Contaminated and industrial biomass wastes- municipal solid waste, wood pallets and boxes, waste papers and others.
6. Biomass mixtures.
The types of biomass that are the focus in this literature review are the first two types, woody biomass and herbaceous biomass, as they are gaining importance in the past few years as they have the potential to trap solar energy in the most efficient manner. Reasons that they are a
good reliable source of renewable energy are as follows [36], [37], (Vassilev S B. D., 2013), [38], [39] and [41].
1. They are a carbon neutral resource as the amount of carbon that is released into the atmosphere is recaptured in the process of photosynthesis.
2. They are not a contributor to greenhouse effect.
3. They have sufficiently low amounts of carbon and sulfur and the amount of sulfur dioxide
that is produced is about 92% less than that of the solid fossil fuels. 4. Due to lower amount of sulfur, there is a lower possibility of acid rain.
5. They have a very good ignition stability as they consist of high volatile matter.
6. During combustion, they help capture some of the hazardous components by the ash formed.
7. Biomass sources help reduce the problem of waste disposal as they contain mostly waste
matter.
3.2.2 Composition of Biomass
In order to understand the various aspects of biomass, one needs to look at the composition of biomass. This can be a daunting task as there are various sources from which biomass can be obtained, and the composition is based on the following factors [36]
1. The species of biomass.
2. The age of the species.
3. The conditions under which the species grew or is growing.
4. The process of growth.
5. The chemicals used for the species to grow.
25
In general, biomass comprises of organic matter, namely cellulose, hemicellulose, lignin, proteins, sugars, starch and lipids [37], [38], [39], [41] and [42]. Of these, the first three are the main components in biomass that act like lithotypes in coal [37]; that is, these components help define the types in biomass. Lithotype is a stage one petrographic analysis and gives information about the properties of the coal type.
Cellulose is defined as a polysaccharide, an organic compound, that has various linear glucose chains [37], [38] and [42]. These chains have tendencies to form a structure that has crystalline and amorphous domains [42]. Biomass consists of two different phases of crystalline polymorph. Cellulose content is relatively low for woody biomass as compared to paper, cotton, and stalks [37]. Hemicellulose is a class of mixed heteroglycans that is amorphous in nature with little strength and accompanies cellulose in plant cell walls [37] and [42]. This is seen mostly in woody biomass [37]. Lignin is a polyphenolic polymer that is amorphous in nature, and is irregular in shape, acts as a binder in plants and accounts for 1/456 of plant biomass [42]. These three
components are highly variable and cellulose values decline in the following order: contaminated biomass, agricultural biomass, woody biomass and animal biomass. Hemicellulose values decline in the following order: woody biomass, agricultural biomass, animal biomass and contaminated biomass. Lignin values decline in the following order: softwoods, hardwoods, agricultural biomass [37].
The inorganic components of biomass include mineral matter such as silicates, oxides, phosphates, carbonates among others, along with poorly crystallized mineraloids and inorganic amorphous phases from natural or derived sources [37]. The occurrence and distribution of these components in both the biomass and solid fossil fuels play a critical role in the conditions of processing and applications relative to these fuels. There is a possibility of high variation of these
components from plant-to-plant due to the genetic, environmental, and morphological diversities. This inorganic matter is much less when compared to that of fossil fuels possibly because of the considerable differences in the occurrence and formation of these fuels as compared to biomass.
In addition to these components, biomass also consists of liquid matter, bulk extracts and organic minerals [37]. Liquid matter is a solution of complex origin with free ions and non-charged species. The common mobile elements are Cl, K, Mg, N, P, S and at times, Na and Ca. Bulk extracts, most commonly consist of water, ethanol, toluene, benzene and the corresponding mixtures extracted from biomass and hence, do not form a fundamental part of the structure of biomass. These values are variable and decrease as follows: agricultural biomass, woody biomass. It is generally high in content for corn grains, straws, grass and others. Organic minerals are oxalates which are end-products of plant metabolism. During water treatment, these are partially soluble in acidic-to-neutral conditions.
The above-mentioned composition was organic and inorganic phase compositions given by Vassilev et.al [37] while the Table 3.1 gives the chemical composition of biomass by Vassilev et.al. [36].
27
Table 3.1:Characteristic enrichment and depletion trends for the chemical characteristics (mean values) among the biomass groups and sub-groups specified.
Biomass group and subgroup
Enriched in Depleted in
Wood and woody biomass CaO, M, MgO, Mn, VM
A, Cl, N, P2O5, S, SiO2,
SO3
Herbaceous and agricultural biomass
FC, K2O, O, VM C, H, CaO
Grasses K2O, O, SiO2, VM Al2O3, C, CaO, H, Na2O
Straws Cl, K2O, O, SiO2 C, H, Na2O
Other residues FC, K2O, MgO, P2O5 Cl
Animal biomass A, C, CaO, Cl, H, N, Na2O, P2O5, S, SO3 Al2O3, Fe2O3, M, MgO, Mn, O, SiO2, TiO2, VM Contaminated biomass A, Al2O3, C, Cl, Fe2O3, H, N, S, TiO2 FC, K2O, P2O5
The elements in biomass are given by major elements constituting C, O, H, N, Ca and K, and the minor elements constitute Si, Mg, S, Fe, P, Cl, Al and Na while Mn and Ti are the trace elements, which have high variations owing to the genetic variations and physiological conditions of biomass [36]. This composition of chemical elements is more complex for solid fossil fuels as compared to that of the system of biomass.
3.2.3 Conversion process to Bioenergy
Once the composition of biomass is understood, we can look at the various conversion processes of biomass to bioenergy. This can be done in two ways: Thermo-chemical and Biological processes [38], [39], [43], [41], [44], [45], and [46]. The processes have been put forward by Caputo et.al. as shown in Table 3.2.
The choice of these processes, generally depends on the type, properties and applications of biomass [43] and [44]. Fermentation and anaerobic digestion are the main conversion choices for biochemical processes [45] and these processes are conventionally not implemented as they require more reaction time which results in lower efficiencies when compared to thermo-chemical processes [39].
29
Table 3.2: Conversion processes of biomass
Conversion process Solutions End Products
Thermo-chemical process Combustion Steam Process heat Electric energy Gasification Steam Process heat Electric energy Fuel gas methane
Pyrolysis Charcoal Bio-coal Fuel gas Biochemical Process Fermentation anaerobic digestion Ethanol Water for irrigation
Compost Biogas
Thermo-chemical processes as can be seen are classified into combustion, gasification and pyrolysis. Of these, combustion is in the developed stage while the other two are still in the developing stage [43]. The thermo-chemical processes have two methods of conversion depending on the type, properties and application of the waste biomass:
1. Converting the biomass into hydrocarbons after gasification,
Pyrolysis is the process of converting biomass to carbonaceous charcoal, liquid and gases in the absence of oxygen [39], [43], and [41]. The first step is pre-pyrolysis where some bonds are broken but it is in the second step where the actual thermal degradation takes place [39]. There are two types of pyrolysis [39], [41]: (1) slow pyrolysis that takes place at slow heating rates and produces more char, (2) fast pyrolysis that takes place at higher heating rates and results, in favorable yields of liquid products. These products can be used in a variety of applications. Char can be used to produce activated carbon while pyrolysis gas can be used for power generation [43]. Gasification is a process of converting biomass to syngas—a combustible form of bioenergy--which contains H8, CO8, CH<, and CO in the presence of an oxidizing agent which can be 35% oxygen or air [39], [43], and [46]. If air is used then the nitrogen present in air reduces the heating value of the produced syngas, but employing pure oxygen is more expensive. Using steam as an oxidizing agent increases the heating values. Employing carbon dioxide as an oxidizing agent is an advantage as syngas consists of CO8. When employing pure steam or CO8, an external heat source is required for the gasification process [46]. The first step in this process is pyrolysis, which is followed by series of oxidation reactions which are exothermic and provide enough heat for the next few steps. This is followed by the water-gas reactions and a methanation reaction to produce syngas [39].
L. Zhang et.al showed that syngas can be classified into four groups based on the heating values [39] as listed in Table 3.3
31
Table 3.3: Heating values and typical applications for different grades of syngas
Type of syngas Heating values (MJ/m3) Applications
Low heating value gas 3.5-10 Gas turbine fuel, Boiler
fuel, fuel for smelting
Medium heating value gas 10-20 Gas turbine fuel, hydrogen
production, fuel cell feed, chemical and fuel
synthesis
High heating value gas 20-35 Gas turbine fuel, SNG and
hydrogen production, fuel cell feed, chemical and
fuel synthesis Substitute natural gas
(SNG)
>35 Substitute for natural gas,
hydrogen and chemical production, fuel cell feed.
Gasification reactions occur in reactors called as gasifiers [39], and [43] and the main process zones are (1) the drying zone, (2) the pyrolysis zone, (3) the combustion zone, and (4) the reduction zone. There are fixed bed, fluidized bed and entrained flow gasifiers [39], [43] and [46]. Fixed bed gasifiers are classified as updraft and downdraft gasifiers. As the name suggests the different zones are fixed and in the former, biomass and air move in opposite directions and produce syngas along with a lot of tar-like residues while in the latter they move in the same direction and reduce the amount of tar. Entrained flow gasifiers are gasifiers where the biomass
and air move concurrently producing syngas but reducing the overall thermal efficiency. For a fluidized gasifier, there is uniform temperature distribution resulting in syngas with a higher heating value. In this, air is introduced into the gasifier while the biomass is mixed with the circulating bed.
Combustion refers to the complete oxidation of fuel and this is the most widely used and developed process [39] [43], [41], [44], [45] and [46]. The three stages in the process of combustion are (1) drying, (2) pyrolysis, (3) reduction and combustion of volatile matter [39]. Almost 70% of the heat is generated from the combustion of volatile matter and this can be used as direct heating in small-scale applications, heating purposes in a boiler that is used to generate electricity [39], and [44]. At times, a pre-treatment process such as pelletizing or torrefaction is required to upgrade the biomass [43] and [44]. The slow heating of biomass isothermally is called “torrefaction” [47]. For small-scale space heating, the appliances used are wood fires, fireplaces, pellet stoves, central heating furnaces, over-fire boilers. If the burner-boilers are well-designed, efficiencies of over 90% are achieved [44]. Two of the main combustion systems that are employed in large-scale industries are fixed-bed combustors and fluidized-bed combustors [39], [43], and [44].
Fixed bed combustion is the simplest technology and, hence is widely used. In this, air passes through a fixed bed where the three stages occur and then using secondary air, combustion occurs in another chamber. The operating temperatures are between 800-1400°C The types of
systems are grate furnaces and underfeed stokers. The different grate furnace technologies are fixed, moving, travelling, and rotating grates. These are primarily used for biomass with a high moisture and ash content. Depending on how the air and biomass are mixed, there are three operating systems: (i) counter-current flow, (ii) co-current flow, and (iii) cross-flow. Underfeed
33
stokers are used for biomass with low ash content and they provide a safe technology for small and medium scale applications. There are two chambers, one being the primary chamber through which air is supplied and the secondary chamber where combustion occurs.
Fluidized bed combustors have a high efficiency. The different types of technologies that can be used are circulating fluidized and bubbling fluidized beds. Air is injected from below into a self-mixing suspension of gas and solid bed material. The solid bed could be made up of silica sand, dolomite, limestone or any non-combustible material. Operating temperatures are 700-1000°C. In this system, good mixing of the fuel increases the flexibility.
These combustion technologies are used for power production and heat generation through steam turbines, steam-piston engines, water-tube boilers and superheaters [44].
3.3 Feedstock Supply 3.3.1 Corn Stover
Corn is the third leading cereal crop in the world following wheat and rice. The composition of corn is 64-78% starch, 8.3-11.9% cellulose fiber, 5.9-6.6% pentoses, 0.5-3.3% sucrose and minor amounts of glucose, fructose and raffinose [48]. The large amounts of starch present in corn makes it a valuable feedstock for ethanol production. The starch is broken down into simple sugars, which is then fed to the yeast to produce ethanol. In the year 2014, U.S produced 171 bushels of corn per acre. [49] Modern ethanol production techniques produce about 2.75 gallons of ethanol per bushel of corn.
Corn stover is an agricultural residue that is left over after the corn has been harvested. It refers to the stalks, cobs and leaves of the plant. The yield of corn shows that there is a large area that is being harvested and hence, corn stover yields will be very high. For the year 2014, 80.7 million acres was harvested for corn. So, the corn stover yields will be significantly high.
The amount of corn stover that is left-over is almost always on a 2000kg of corn stover/bushel of corn that is harvested on a dry basis [48]. Stover on a dry-matter basis accounts for approximately 50% stalks, 22% leaves, 15% cobs and 13% husks [50]
Hence, this acts as a potential biomass feedstock in the production of ethanol. Although there is research and development going on to produce ethanol directly from corn stover, the immediate concern ought to be the current technologies that are employed in the ethanol production and means to make it sustainable. This can be done by using the corn stover as a feedstock for the process heat generation at corn-ethanol plants as it would replace natural gas as a source.
3.3.2 Harvest techniques
Corn is planted in April or several weeks later and harvested in late October or early November. Corn stover should be allowed to dry down to 20% moisture before it is harvested and the average harvest window for corn stover is typically 40 days after corn grain harvest [51]The amount of corn stover that can be harvested from a field depends on various factors, including the tillage and crop management practices, the type and sequence of operations, the efficiency of the equipment and the environmental constraints. The total amount that is available in an area depends not only on the stover yield and collection fraction but also, on the proportion of corn acreage around the ethanol plant and the number of farmers who are contracted to sell the stover [52].
Corn stover is still considered as an agricultural residue and not as a co-product of farming because harvest practices and development concentrate more on maximizing corn grain harvest [53]. Stover can be collected in the form of chopped or baled stover and may require some pre-processing, such as chop retrieving or debaling/chopping, before it is used in the process of combustion. The final collection depends largely on the harvest window, moisture content, weather
35
changes and soil contamination which cause hindrances for the conventional stover harvest. Slower field drying is possible when stover is windrowed, and raked but, if there is a short harvest window then baling at low moisture contents becomes a challenging process. To reduce soil compaction, farmers may use a “rotating collection” approach where they can collect half of the corn stover from a part of the acre in the first year and collect another half from the other part of the acre in the following year. [53]
Recent interest in the use of corn stover as a potential source for bioenergy production has renewed research to develop alternate stover harvest systems that could reduce the number of field operations along with increasing the harvest efficiency. There are typically three harvesting techniques.
1. One-pass system: this system uses a configured combine which can be attached to a
collection equipment. This system size-reduces the stover on the combine and can be either configured with a forage wagon to collect chopped stover or with a baler.
Advantages- Higher stover yield with low ash content
Disadvantages-Reduced grain harvest rate, and high combine power consumption.
2. Two-pass system: this system uses a combine that is modified to create a stover windrow
during the harvest. This windrow is then harvested with a forage wagon or baler.
Advantages-Requires fewer modifications than one-pass systems, may allow for some stover drying.
Disadvantages-Lower yield as compared to the one-pass system with ash content
3. Three-pass system: this system uses a combine that is modified to create a windrow followed by shredding with a flail shredder. This is then harvested with the help of a forage wagon or a baler.
Advantages-Allows for drying of corn stover, increases the density of bales. Disadvantages-Higher ash content due to soil contamination.
The baler is typically selected on the size required and it can be a round or a rectangular baler. A combine is a piece of farm equipment which processes and transports the grain and non-grain fractions in separate streams and can be modified. These systems can use either an ear-snap header where the husk, cob and some leaf and upper stalk are collected or a whole plant header where the whole plant above the ground is collected. [54] The selection of these techniques entirely depends on the type of yield required, density of the bales, the harvest window, the moisture content and the quality of the soil.
3.3.3 Transportation and Storage systems
Storage is essential for corn stover as it is harvested at a particular time of the year and is generally required by the ethanol plant throughout the year for process heat. In addition, efficient storage improves the drying of stover and increasing the process of pre-treatment, if any. The storage facility can be located at the plant, at the farm or at a location in between the plant and farm. Irrespective of the location of the storage facility, the collected stover has to be transported from the farm to the plant facility.
The stover that is collected can be stored indoors or outdoors. If the stover is baled, then it can be uncovered or plastic-wrapped whereas the chopped stover can be saved in large piles or bunker silos. For the three-pass systems, any of the storage options may be considered. For the two-pass and one-pass systems, uncovered storage of bales cannot be an option as they would be wet for aerobic storage. Typically, outdoor storage is a more economical option even though there would be some amount of dry matter loss. The indoor storage requires extra cost of a storage structure area which is greater than the cost of dry matter loss and hence, is generally not preferred.
37
For bales, the least expensive option was outdoor storage of wrapped bales. For wet, chopped stover, the least expensive option was storage in silage bags. [54]
3.4 Summary
Based on the literature review, as the combustion technologies require corn stover to be
dry, no further discussion on chopped stover is considered. This is because baling is a more reliable option and has more energy density. As the harvesting methods depend on various factors and since this model has been designed to apply to any location, all the three methods have been considered separately and a best estimate of their costs has been given.
CHAPTER 4
: MODELING TECHNIQUE AND APPROACH
4.1 Introduction
There has not been much research on considering corn stover as a potential heat source for ethanol production as most of the research is currently inclined towards cellulosic ethanol. For cellulosic ethanol, agricultural residues such as corn stover can directly be converted to ethanol instead of corn grain. This is an innovative approach for sustaining the industry and even though there are cellulosic ethanol plants that are being developed, this industry might take a while to be sustainable. Hence, there is a need to sustain the current ethanol plants. For the current plants that use natural gas as a heat source, biomass combustion can be considered as an alternative heat source and a model to check the feasibility of such an approach is described below.
A model describing the heating requirements for ethanol and the amount of corn stover required was created to better understand the viability of using corn stover combustion as a heat source and assess the economics of the process. It takes into account the ethanol plants located in or around the corn farms to provide a reasonable pay back period. The model designed for this project is a spreadsheet-model which considers user-defined values for the ethanol plant and inputs for the harvesting equipment. The output data gives the harvesting costs for three different scenarios which enables the user to choose the best technique possible depending on the investment for the plant and the local weather conditions.
The model basis approach that is considered is technically precise and transparent. This model was designed based on the works of Kumar (2008) and Ehrke (2012) except that they worked on solar energy instead of biomass combustion. Using solar energy for heating purposes is a viable option but, considering that most of the ethanol plants are located in the Midwest, solar energy may not be as reliable or a particularly economically-desirable option. Corn stover is more
39
reliable as a potential source as the combustion technologies are well developed and as an advantage, corn stover is a source that is readily available from the farms which are producing the corn to make ethanol.
Hence, the model developed here incorporates corn stover combustion and takes into account the current and projected market prices to estimate yearly energy requirements, costs involved for the supply of corn stover and the pay-back period for the installation of these plants. This can be used for various locations of the ethanol plants and different market conditions. The following sections discuss the approach followed to calculate these output data from the user-defined values.
4.2 Feedstock Requirement
This section helps determine the amount of natural gas that is being used at the plants and the amount of corn stover required to produce the same amount of heat relative to natural gas. In addition, it calculates the amount of corn stover required based on the heating requirement of the plant and determines the land acreage that is needed to produce the required corn stover. User-defined values are as shown in Table 4.1.
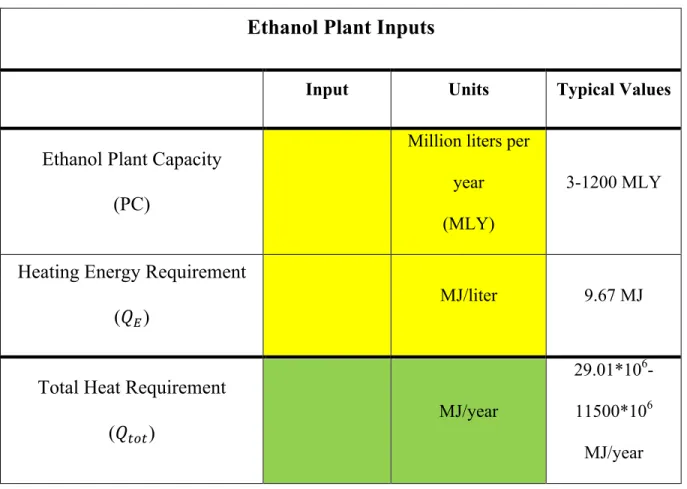
Table 4.1 Ethanol plant inputs and typical values on the spreadsheet model.
Ethanol Plant Inputs
Input Units Typical Values
Ethanol Plant Capacity (PC)
Million liters per year (MLY)
3-1200 MLY
Heating Energy Requirement (𝑄B)
MJ/liter 9.67 MJ
Total Heat Requirement (𝑄5C5)
MJ/year
29.01*106
-11500*106
MJ/year
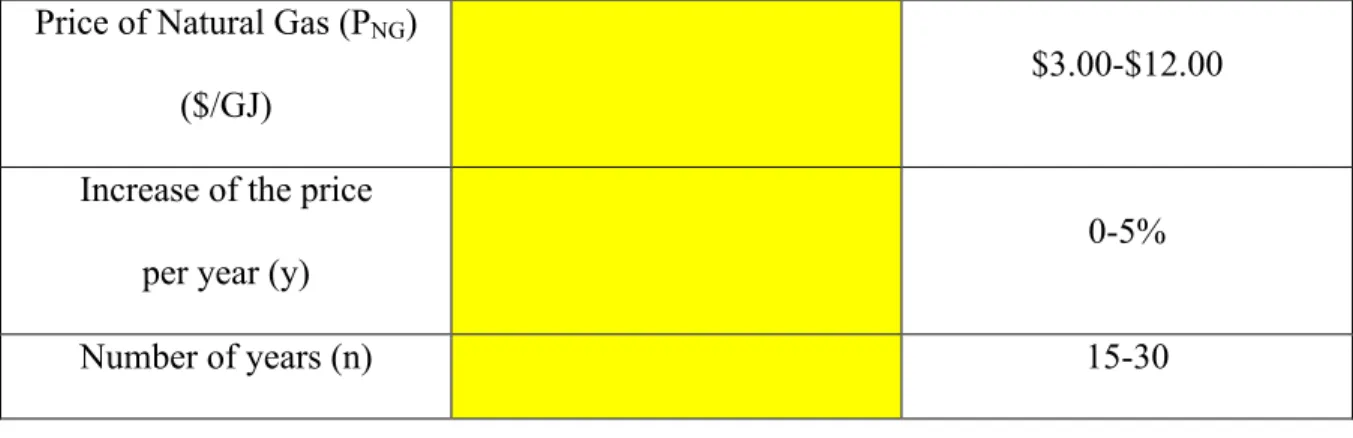
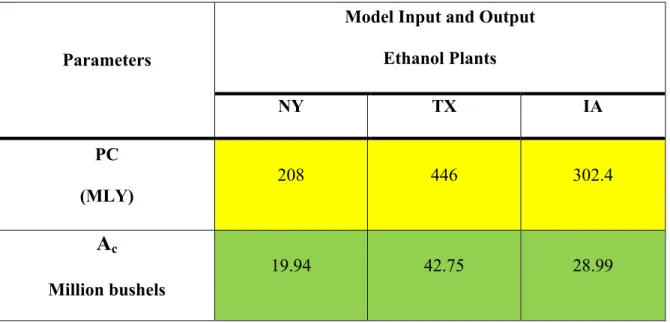
The typical values are available online and in many other peer-reviewed papers [55]. The input cells of the model are yellow and the output cells are green. The first entry in the model is the plant capacity in MLY. All values are considered for anhydrous ethanol unless otherwise mentioned. The nameplate capacity is the main factor that determines the energy use for the facility. To estimate the total heating requirement that is needed by the plant, Equation 4.1 can be used.
41
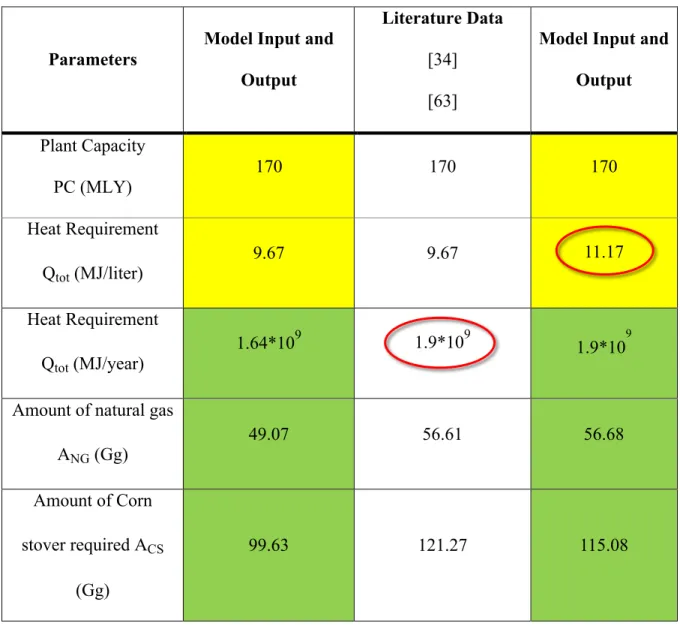
The total heating requirement (𝑄5C5) in MJ/year is calculated by multiplying the plant capacity with the heat requirement to produce one liter of ethanol. On an average, a typical plant requires 9.67MJ to produce one liter of ethanol [34]. This need not be true for every plant as studies show that the heat requirement for ethanol plants is gradually decreasing [35] and hence, it is not necessary that every plant experience the same heat requirement. This value determines the output data hence, making the model flexible.
To calculate the output data, the process requires a step-by-step approach. Given the scale of some ethanol plants, the following criteria have been calculated.
1. Amount of natural gas required.
2. Amount of corn required.
3. Land acreage needed for the necessary amount of corn.
4. Amount of corn stover required that is required for the current plant. 5. Amount of corn stover that is actually available.
6. Thermal energy generated from the available stover.
The first two steps are calculated based on the input data. All calculations are on a yearly basis unless otherwise noted. The amount of natural gas required is based on the heating requirement of the plant (𝑄B
![Figure 2.9: Corn Production by County and Location of Ethanol Plants [23]](https://thumb-us.123doks.com/thumbv2/123dok_us/1225236.2665103/33.918.112.787.108.633/figure-corn-production-county-location-ethanol-plants.webp)
![Figure 2.10: Corn Production and Corn Used for Fuel Ethanol Production [31]](https://thumb-us.123doks.com/thumbv2/123dok_us/1225236.2665103/35.918.114.792.359.677/figure-corn-production-corn-used-fuel-ethanol-production.webp)