Chicago Recovery Partnership Evaluation of
the American Recovery and Reinvestment Act
Practicum Report
Prepared by the following students as part of the policy practicum program at the Harris School of Public Policy Studies at the University of Chicago: Genevieve Benedetti, Sebastian Galarza, Sean Hoskins, Jonathan Jones, Eve Kager, Angeliki Kastanis, Matthew Kirschenman, Kristen Lacapria, Sara LaPlante, Kathleen Loa, Johanna Peterson, Marie Petrmanova, Christopher Piotrowski, Luvia Quinones, Molly Scannell, Melissa Tooley, and Bianca Vilanova.
Table of Contents
PREFACE 4 EXECUTIVE SUMMARY 5 INTRODUCTION 6 BASIC NEEDS 7 WORKFORCE DEVELOPMENT 29 PUBLIC SAFETY 41 HOUSING 56TRANSPORTATION AND INFRASTRUCTURE 67
ENERGY AND ENVIRONMENT 98
CONCLUSIONS 114
ANNEXES 115
Preface
The Recovery Partnership is the City of Chicago’s collaboration with the Chicago philanthropic community to secure funding and provide strategic guidance in allocating funds from the
American Recovery and Reinvestment Act (ARRA) of 2009. The Partnership sought assistance in conducting an evaluation of the impacts of ARRA funding in Chicago, and this report presents the work of the Harris School students who conducted this evaluation. Through the Harris School’s policy practicum program, graduate students in public policy worked on this project under the guidance of James H. Lewis, Senior Program Manager at the Chicago Community Trust; Alexander Gail Sherman of the Civic Consulting Alliance; and Paula R. Worthington, Senior Lecturer at the Harris School of Public Policy Studies.
Executive Summary
From 2009 – 2011, the City of Chicago and Cook County received a total of $2.35 billion in funding provided by the American Recovery and Reinvestment Act [ARRA]. The stimulus money was allocated to seven areas: education, basic needs, transportation & infrastructure, housing & energy, public safety, broadband and workforce development. The Chicago Recovery Partnership Evaluation of ARRA analyzes the impact of the stimulus spending using a cost-benefit analysis framework. This report evaluated $1.09 billion of total spending in Chicago and Cook County, resulting in net benefits ranging from -$173.9 to $2,740.2 million. The wide range in net benefits is attributed largely to education, which received over half of ARRA funding.
Introduction
In February 2009, the United States Congress enacted the American Recovery and Reinvestment Act (ARRA) as a response to the recession that began in December 2007. The stimulus package was intended to create jobs and promote investment and consumer spending. All the interventions (tax incentives, expansion in unemployment benefits and welfare programs, and spending in education, health care, infrastructure, etc.) amounted to $787 billion in stimulus investments. The City of Chicago created strategy teams in seven specific areas: education, basic needs, transportation & infrastructure, housing & energy, public safety, broadband and workforce development to obtain and effectively disburse the available funds. In total, the City of Chicago and Cook County received $2.35 billion in funding, from which $468 million were awarded competitively. Chicago received the second highest level of ARRA funding of all U.S. cities.
In April 2009, Mayor Richard Daley invited Chicago-based foundations to join the city in establishing the Recovery Partnership. The City of Chicago has partnered with the Chicago Community Trust and Civic Consulting Alliance to organize, staff, and manage the recovery efforts. As a part of ongoing efforts to increase transparency in policy making, the Recovery Partnership wished to examine the effects of ARRA in Chicago through a large-scale cost-benefit analysis. This report contains cost-cost-benefit analyses on programs totaling $1.09 billion of funding in six categories (excluding broadband). Each of these six sections tracks ARRA spending for its specific area, provides a thorough literature review, outlines the cost-benefit methodology, and summarizes the net value derived from the programs’ implementation.
Chapter 1. Basic Needs
1. Introduction
1.1.Education
The American Recovery and Reinvestment Act allocated funds via grants to Education programs that totaled more than $869 million. The funds were allocated to the following eight programs: Head Start, Title I funds, McKinney-Vento Homeless Education, National School Lunch Assistance, State Fiscal Stabilization Fund (SFSF) in 2009 and 2010, IDEA fund and Teacher Incentive fund.
According to the City of Chicago’s Recovery website, stimulus money related to education would be used with the goal of: “Promoting innovation and excellence, recruiting, preparing, and rewarding outstanding teachers, encouraging better standards and assessments and investing in early childhood initiatives and college and career preparedness”. This also included funding teachers’ salaries and expanding coverage of existing programs like Head Start.
The largest percentages of funds were SFSF funds. SFSF is a one-time allocation of $53.6 billion from the federal government to states under ARRA. The funds are appropriated through two types of block grants to that are: 1) earmarked for education; 2) other governmental services. States have significant autonomy in how they distribute funds to their state and local education budgets, with a general goal in mind: keep budgets for K-12 and higher education from dropping below FY2006 levels. The Chicago Public School system was allocated $261.05 million in FY2009, and $166.72 in FY2010. While no jobs were “created” using this funding, a high percentage of these funds were dedicated to paying teacher salaries in order to prevent layoffs.
Title I, Part A funds constituted the second largest amount. The ARRA provided the Illinois State Board of Education with an allocation for Title I Part A of $420.15 million in addition to the regular Title I appropriations for FY2010. The Chicago Public School system was awarded $261.61 million out of the total allocation for Illinois. Specific programs and projects to be funded in Chicago include: teacher support and professional development, parental involvement programs, administrative costs, additional after school programming and one-on-one tutoring, pre-K and early education programs, technology to drive student achievement, college and career preparedness.
IDEA, Part B funding for Preschool and Special Education Flow Through was $119.2 million, making it the third largest program funded by the ARRA in Education. Preschool funding provides grants to States, to provide special education and related services for children with disabilities aged 3 through 5. States may include children experiencing developmental delays and 2-year olds who will turn 3 during the school year. Funding under the Preschool Grants program supports early childhood programs that provide services needed to prepare young children with disabilities to enter school ready to learn. According to the US Department
of Education (2010b) Special Education Flow Through funding provide grants to ensure a free, appropriate public education for children with disabilities that meets challenging standards and prepares them for higher education, employment, and independent living.
The Teacher Inventive Fund received $42.2 million in ARRA funds. The program’s goals include: “improving student achievement by increasing teacher and principal effectiveness, reforming teacher and principal compensation systems so that teachers and principals are rewarded for increases in student achievement, increasing the number of effective teachers teaching poor, minority, and disadvantaged students in hard-to-staff subjects and creating sustainable performance-based compensation systems” (US Department of Education, 2010).
The other two programs funded were the National School Lunch Program Assistance ($1.5 million) and the McKinney-Vento for Homeless Children and Youth ($1.1 million). The goal of the School Lunch Program is for children to have access to nutritional food, helping them thrive in the classroom and in life. McKinney-Vento program provides services to homeless children to ensure they continue attending school.
Given the variety of programs we chose to focus our analysis on evaluating the impact of SFSF and Title one funds dedicated to pay for teachers’ salaries, and thus prevent teachers’ layoffs, due to the large percentage these funds represent from the total ARRA funds dedicated to Education.
1.2.Basic Needs
The goal of providing funding for Basic Needs, Health and Human Services, was to improve the quality of life for those residents of Chicago who need it most. With a focus on the homeless, children and low-income individuals and families the funding was dedicated to programs that focused on these communities.
The stated goals of the Basic Needs group as found on the City of Chicago website are1:
• Expansion of services for children through additional slots in Head Start, Early Head Start and Child Care Assistance Program
• Expansion of services for youth through summer employment opportunities, scholarships, engagement of homeless youth; and case management, substance abuse and mental health services for youth involved in the criminal justice system
• Expansion of services for low income residents, including the homeless, through housing placement and stabilization, public benefits outreach and enrollment, counseling and case management, substance abuse and mental health services, and targeted outreach to the chronically homeless
• Expansion of workforce development services including targeted services for veterans, homeless persons, and expanded service delivery at Community Service Centers
1
"City of Chicago :: Basic Needs (Health & Human Services)." City of Chicago. Web. 28 March 2011. <http://www.cityofchicago.org/city/en/progs/recovery_reinvest/education3.html>
• Expansion of Services for seniors through nutrition and job training programs
• Stimulating the local economy through the creation of jobs in the human services sector The Chicago Recovery Partnership report of October 2010 reports that almost $70 million dollars was awarded to the Basic Needs group, with $90 million being requested.2 The programs receiving the largest amounts of funds were Homeless Prevention and Rapid Re-Housing, Head Start/Early Head Start, Community Services Block Grants, and Immunizations.
The programs the basic needs team focused on for analysis were Homelessness Prevention and the Head Start/Early Head Start program. These programs were chosen because they received significant amounts of money and/or were of specific interest to the team based on their potential for producing high-impact results. The funding for these programs would not have existed were it not for the ARRA grants, receiving these funds allowed the City of Chicago to explore and test the viability of these programs without risking a loss of existing city funds.
1.2.1. Homeless prevention
The Homeless Prevention and Rapid ReHousing Program is administered through the U.S. Department of Housing and Urban Development (HUD). Approximately $34 million was awarded to the City of Chicago to provide financial assistance and services to families that are homeless or are at risk of becoming homeless. Of the total funds awarded, $23 million are dedicated to providing direct financial assistance to Chicago residents and will be used to provide short and medium term rental assistance, security deposits, utility payments, moving assistance, and motel vouchers. The remaining $9 million have been set aside for housing relocation and stabilization services that include case management, outreach, housing search and placement, legal services, mediation and credit repair.
To measure the impact of the $34 million spent on Homeless Prevention and Rapid Re-Housing, our team collaborated with the Emergency Fund, a non-profit whose mission is to provide immediate financial assistance to help low-income individuals and families through a crisis or transition. The Emergency Fund was the largest recipient of ARRA funding for Homeless Prevention and Rapid ReHousing receiving $24 million dollars, of which $23 was dedicated to direct financial assistance.
The Emergency Fund will be distributing the ARRA funds over a period of three-years to individuals and families at risk of becoming homeless. This is a short-term program, and all people who enter it must be willing and eventually able to pay for their unit when the assistance ends, as this is not a subsidized housing program.
1.2.2.Head Start Early Head Start
2
"Recovery Partnership Final Report." City of Chicago :: Recovery and Reinvestment (Stimulus). Web. 22 May 2011.
We evaluated Head Start funds dedicated to expansion of coverage due to critical role early childhood education plays in the future success of disadvantaged children. Three types of ARRA funding, totaling $16.4 million, were allocated for Head Start and Early Head Start: Expansion, Quality Improvement (QI) and Cost-of-Living Adjustment (COLA). The goal of the Expansion funding ($7.8 million) was to provide 590 low-income families and their children up to age 5 with early childhood education and other support services. QI funding would mainly provide greater professional development resources for teachers while COLA funding would provide cost of living increases for Head Start/Early Head Start staff. QI and COLA funding amounted to $8.6 million. A much smaller amount of funding, $225 thousand, was awarded to provide technical assistance for these programs.
Title I & SFSF Funds
2. Literature Review
Title I and the State Fiscal Stabilization Funds (SFSF) make up a substantial amount of the total the American Recovery and Reinvestment Act (ARRA) funds allocated to education, together totaling $688.38 million. Both grants are vast in scope and the states have substantial flexibility about where to spend the money. A Report to Congress by the Government Accountability Office (GAO) in December 2009 reports that about 60 percent of the State Fiscal Stabilization Funds allocated to Illinois was intended to pay teacher salaries in order to prevent teacher layoffs. The GAO report estimated that approximately 15 percent of Title I ARRA funding would be spent on teacher salaries. With those assumptions in mind, we chose to focus first on determining the costs and benefits associated with the 60 percent of SFSF and 15 percent of Title I funds that went to pay teacher salaries.
The ARRA funding that infused the Chicago Public Schools (CPS) budget prevented major layoffs throughout the district. Without these funds, CPS would have had far fewer teachers for the same number of students, pushing up classroom size significantly. The Chicago Defender predicted on June 9, 2010, that putting teachers out of work to close the budget gap could result in a 20 percent increase in class size (Hutson 2010). A review of the State’s legislation and Chicago Public School’s Policies regarding teachers’ layoff shows that layoffs are decided based on seniority of teacher, making the possible effects of a reduction in funds on class sizes stronger.
A wide range of estimates have been made about the effect of class size on student outcomes such as test scores, other achievement measures, and earnings. In November of 2000, economist Caroline Hoxby published the study, “The Effects of Class Size on Student Achievement: New Evidence from Population Variation.” She performed an econometric analysis of classes in 649 elementary schools in Connecticut. She used longitudinal data to smooth population variation, and looked at jumps in class size as a result of maximum or minimum class size rule changes. She measured student outcomes by using the log of
standardized tests. Her estimates lead her to conclude that class size does not have any statistically significant effect on student achievement (Hoxby 2000).
Many less conclusive studies have shown mixed results for class size on student outcomes. Joshua Angrist and Victor Lavy used the twelfth century rabbinical scholar Maimonides’ “rule of 40” to create an IV to consider the effect of class size. Maimonides’ assumption that the class sizes should not exceed 40 students per teacher is important because Israeli education policy has been shaped by the belief (Angrist and Lavy 533). The 40 person maximum induces a non linear and non-monotonic relationship between Israeli public school class size (Angrist and Lavy 533). The statistical model developed on the 40-student maximum inference estimates that reductions in class size are correlated with significant and substantial gains in math and reading achievement for fifth graders, modest improvements for fourth graders, and little improvement for third graders (Angrist and Lavy 569).
A paper published in January 2011 evaluates the long-term impacts of Project STAR, a random control trial experiment performed in Tennessee to determine effects of class size and teacher quality on student outcomes. The paper specifically links the long term effects on earnings for STAR participants and an analysis of variance shows that increased test scores in kindergarten have a significant effect on earnings at age 27 (Chetty et al). The study uses administrative data from tax returns to link class size to kindergarten test scores to earned wages in adulthood (Chetty et al). Thus, the paper associates interventions that increase test scores (namely, reduced class size and improved teacher quality) with the increase in adult wages (Chetty et al 2). Another study of Project Star (Krueger 2002) examines the effects of Class Size on Student Achievement performing an analysis of the existing literature and a Cost – Benefit Analysis of class size reduction. Using this data we were able to estimate how wages were affected by class size so that we could monetize the potential benefits that Title I and SFSF funds will produce by preventing teacher layoffs.
3. Cost-Benefit Analysis Methodology
A key impact measure of class size is students’ educational achievement, which is directly correlated with students’ lifetime earnings. Therefore, we endeavored to assess how the ARRA funds dedicated to these two programs may have affected these measures.
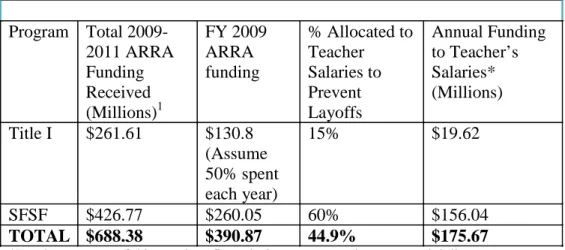
Evidence strongly suggests that CPS would have been forced to lay off teachers and increase the number of pupils per classroom had it not received these funds. (Hutson 2010) A report by the Government Accountability Office indicates that about 15% of Title I ARRA funds and about 60% of SFSF ARRA funds were used towards teachers’ salaries in Illinois (see Annex 1). Based on these figures we estimated that $175.67 million in ARRA funds were used for teachers’ salaries (See Table 1).
Table 1. Overview of ARRA Funding Used Toward Teacher Salaries
We investigated the current number of teachers and students in CPS in 2009 to estimate the impact that not receiving ARRA funds would have had on class size. In 2009, CPS had 409,279 students and 21,320 teachers, for an average ratio of 19.2 teachers for every student (Chicago Public Schools 2010). Based on salary and benefits data, we then estimate that the average annual salary of a CPS teacher is $75,000 and the annual benefits package is $25,000, for a total cost of $100,000 per teacher (Chicago Public Schools). However since teachers are laid off based on seniority (Illinois General Assembly), and as a result teachers with lower than average salaries must be dismissed first, we decided to evaluate three different cost scenarios. We then calculated how many teachers CPS would have laid off had they not received ARRA funds by dividing the cost of a teacher in each scenario into the $175.67 million in ARRA funds used for teachers’ salaries.
Without ARRA funds the total number of CPS teachers would have increased the student-teacher ratio as shown in the following table:
Program Total 2009-2011 ARRA Funding Received (Millions)1 FY 2009 ARRA funding % Allocated to Teacher Salaries to Prevent Layoffs Annual Funding to Teacher’s Salaries* (Millions) Title I $261.61 $130.8 (Assume 50% spent each year) 15% $19.62 SFSF $426.77 $260.05 60% $156.04 TOTAL $688.38 $390.87 44.9% $175.67
*For the purposes of this cost benefit analysis, we assume the same total dollars are spent on teachers’ salaries in both FY 2009 and FY 2010, despite an overall decline in SFSF ARRA funds in FY 2010 relative to FY 2009.
Table 2. Effect of ARRA Funds on Student-Teacher Ratio
The evidence of impact of class size on achievement is not conclusive, with some researchers purporting that class size differences have no influence on students’ educational achievement or other long-term outcomes3 and some purporting it does.45Given this, we decided to look at a range of potential outcomes, with Hoxby’s (2000) research as the “floor” estimate, Chetty et al’s (2010) Project STAR research as a medium estimate and Krueger (2007) as the “ceiling” estimate.
Table 3. How does class size affect student outcomes?
One important point to consider is that prior research in the field has investigated the impact of decreasing class size, whereas our intention is to understand the impact of preventing an increase in class size. Despite this difference, for our purposes, we assumed that the impact would be the same.
We then estimated income gains per student for all our cost scenarios and impact levels. To do so we first estimated earnings for all students given the impact found in the studies used. Since Project STAR research was based on three years of reduced class size and our analysis of ARRA only on two and assuming that each year of reduced class size has an equal impact on students’ lifetime earnings we then adjusted those earnings to reflect the actual timeframe (2/3). Finally since class size could have varied without ARRA funds at different levels than those in 3 (Hoxby, 2000) 4 (Chetty, R, et al, 2010) 5
Scenario 1 Scenario 2 Scenario 3
Annual salary of a CPS teacher $75,0001 $60,000 $45,000
Benefits $25,0002 $20,000 $15,000
Total $100,000 $80,000 $60,000
ARRA funds $175,670,000 $175,670,000 $175,670,000
# teachers funded 1,757 2,196 2,928
# of teachers in 2009 w/ARRA 21,320 21,320 21,320
# of teachers in 2009 w/o ARRA 19,563 19,124 18,392
# of CPS students 409,279 409,279 409,279
# students per teacher w/ARRA 19.20 19.20 19.20
# students per teacher w/o ARRA 20.92 21.40 22.25
Increase in class size 8.98% 11.48% 15.92%
No Effect Medium Effect High Effect
$0
(Caroline Hoxby)
A 33% decrease in class size is associated with a $9,460 income gain (PV)
(2011 Chetty et al, Project STAR)
A 31.8% decrease in class size is associated with a $20,937 income gain (PV)
(2002 Alan Krueger, Project STAR)
the studies chosen, we adjusted earnings to reflect the real class size change. The estimate found reflected the total benefits of Title I and SFSF funds dedicated to teacher’s salaries; when divided by the total number of CPS student we got the income gain per student due to ARRA.
Finally, we performed a Cost Benefit Analysis of the program, using as cost the total amount of funds allocated by ARRA to Tile I and SFSF and the estimated benefits from our analysis.
4. Cost-Benefit Analysis Results
Table 4. Income Gain per Student
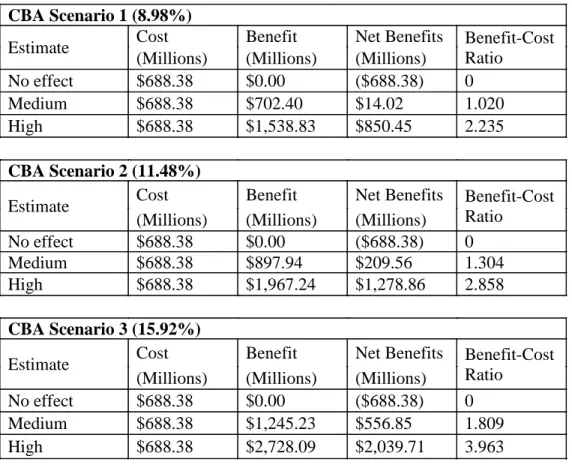
As stated in Table 2, Scenarios 1, 2 and 3 represent class size increase prevented given our three salary levels. Scenario 1 explores income gains per student using a prevented a class size increase of 8.98%, Scenario 2 of 11.48% and Scenario 3 of 15.92%. No, Medium and High effect are based on the findings of Hoxby (2000), Chetty et al. (2010) and Krueger (2002) as stated in Table 3. We estimated that income gains per student range from $0 to $6,666 depending on amount of class increase prevented.
Income gain per
student Scenario 1 Scenario 2 Scenario 3
No effect $0.00 $0.00 $0.00
Medium effect $1,716.18 $2,193.96 $3,042.49 High effect $3,759.87 $4,806.60 $6,665.60
Table 5. Net Benefits and Benefit-Cost Ratio
Net Benefits range from a loss of $688.4 million, if we believe that Class size has no impact on student achievement and future wages, as Hoxby (2000) proposes, to a gain of $2.03 billion for a scenario that assumes a higher impact of class size on achievement. It is important to note that even medium impacts have significant Net Benefits.
Early Head Start & Head Start
2. Literature Review - Early Childhood Education
Over the past several decades, the fields of developmental psychology, demography, sociology, economics, and neurobiology have produced a significant amount of research on the importance of positive, stimulating early experiences and environments for the long-term cognitive and social development and mental health of children.
Recently, neuroscience researchers have discovered “sensitive periods” early in human’s lives when the brain’s circuitry demonstrates the most malleability in response to experiences (Knudsen et al 2006). As a result, we now have evidence that early experiences play a more significant role in shaping children’s temperament, social development, perceptual and cognitive abilities – the general foundation for future productivity – than comparable experiences later in life (Knudsen et al 2006). Social and emotional difficulties that onset in the first five years of life
CBA Scenario 1 (8.98%)
Estimate Cost Benefit Net Benefits Benefit-Cost
Ratio (Millions) (Millions) (Millions)
No effect $688.38 $0.00 ($688.38) 0
Medium $688.38 $702.40 $14.02 1.020
High $688.38 $1,538.83 $850.45 2.235
CBA Scenario 2 (11.48%)
Estimate Cost Benefit Net Benefits Benefit-Cost
Ratio (Millions) (Millions) (Millions)
No effect $688.38 $0.00 ($688.38) 0
Medium $688.38 $897.94 $209.56 1.304
High $688.38 $1,967.24 $1,278.86 2.858
CBA Scenario 3 (15.92%)
Estimate Cost Benefit Net Benefits Benefit-Cost
Ratio (Millions) (Millions) (Millions)
No effect $688.38 $0.00 ($688.38) 0
Medium $688.38 $1,245.23 $556.85 1.809
have been linked to negative effects on school achievement and peer relationships in later childhood (Breitenstein et al 2007). Other studies show that children who attend preschool are more likely than their counterparts to perform favorably in the early elementary grades and, ultimately, to achieve more desirable outcomes at age 19 (Berrueta-Clement et al 1984). A study of the Chicago Child-Parent Centers found evidence that the program: 1) decreased expenditures on school and remedial services, criminal justice system services for youth and adult crime; 2) reduced costs of child care, child welfare services, and college tuition; and 3) increased lifetime earnings. (Reynolds et al 2002)
However, many low-income families lack the necessary resources to invest money or quality time in their children. And many of these families are plagued by other stressors (e.g., poor neighborhood safety, unstable employment, substance or domestic abuse,), or are vulnerable in other ways (e.g., single, teen, mentally ill and/or developmentally-delayed parents), that may reduce the priority that these parents place on their child’s early learning (DeLuca and Rosenblatt, forthcoming). For these at-risk families, early childcare programs are essential in enhancing their children’s intelligence, language skills, and school readiness (Ramey & Ramey 2004).
Two-generation programs have been found to have the potential to maximize the benefits of early intervention programs by providing supports to low-income parents while concurrently addressing the developmental needs of their children. Two of the largest and most prominent two-generation programs are administered by the U.S. Department of Health and Human Services: Head Start and Early Head Start. While program providers have a great deal of discretion in the development of their program models, all are required to provide “high-quality, comprehensive child development services, delivered through home visits, child care, case management, parenting education, health care and referrals and family support.” (Love et al 2005). In 2009, these programs served over 900,000 economically disadvantaged children and families, at an average cost of $7,600 per child (US Department of Health and Human Services 2010b).
The Head Start program was created in 1965, and focuses on school readiness by “enhancing the social and cognitive development of children through the provision of educational, health, nutritional, social and other services to enrolled children and families” (US Department of Health and Human Services 2010a). The program strives to promote parents’ engagement in their children's learning and aid them in making progress toward their own goals.
Studies have found continued benefits from Head Start participation on children participating, including improved test scores, less grade repetition, and lower special education placement rates (Ramey & Ramey 2004). Others have found evidence that Head Start reduces childhood obesity. However, the average demonstrated effects of participation on children’s achievement and school progress are smaller than those yielded by participation in the “model” preschool programs (like Abecedarian and the Perry Preschool Project) that informed Head Start’s creation (Barnett 2002). This result is not surprising given Head Start’s much lower per child funding relative to the model programs, its wide variety of models and approaches, and the
much larger population it serves. A 2010 study by the Department of Health and Human Services (Westat 2010) reports that the quality of Head Start centers is variable, with no centers rated as “poor,” only a few centers rated as “excellent”, and the remainder being of a middling quality level (“Understanding the Head Start Impact Study” 2010). Additionally, some studies on the Head Start preschool program suggest that gains made in low-income children’s cognitive ability and school achievement begin to disappear after a few years if additional supports are not continued after kindergarten entry (Lee and Loeb 1995).
It is difficult to quantify how cognitive and noncognitive skills of young children translate into long-term life outcomes. Ludwig and Phillips (2008) assess the body of research on this topic, and come to the conclusion that the best available evidence suggests that Head Start does produce long-term benefits that outweigh its costs. They look at work by Garces, Thomas, and Currie who attempted to remove self-selection bias and control for any other unmeasured family attributes that could confound a comparison of Head Start participants to non-participants, by comparing outcomes for program participants relative to siblings that did not participate. Garces et al found that Head Start attendance was associated with significant improvements in educational outcomes for whites, and reduced reported criminal activity among African-Americans (Ludwig and Phillips 2008)
Ludwig and Phillips (2008) also analyze the 2010 Department of Health and Human Services Head Start National Impact Study by Westat. Their analysis finds that all cognitive skills effect estimates point in the right direction (focusing on treatment on the treated) although they are not statistically significant. Ludwig and Phillips claim this is likely due to measurement error as a result of poor reliability of assessment criterion (particularly for noncognitive abilities). When evaluating pooled estimates of outcomes for three and four year olds, they do find statistically significant cognitive outcomes.
The Westat study (Westat 2010) is arguably the most rigorous evaluation of the Head Start program to date. This report to HHS assessed differences in cognitive development, social-emotional development, and health status and services for children participating in Head Start (at age three or at age four) relative to very similar children ( a control group) who did not participate in Head Start. It also investigated parenting practices and the quality of the Head Start programs themselves. Compared to the control group, the study found that children who attended Head Start programs had higher-quality early care and education environments, including teacher qualification, classroom literacy and math instructional activities, teacher-child ratios, the nature of teacher-child interactions, and others. At the end of the Head Start year, both the three- and four-year-old Head Start cohorts demonstrated better literacy and language abilities than their counterparts, and were more likely to have received dental care. Three-year-olds were also found to have stronger pre-writing and more advanced math skills than their control group at the end of the Head Start year, and also showed less hyperactive and problem behavior. Parenting practices and parent-child relationships were also healthier for the three-year-old cohort compared to their counterparts.
However, the Westat Head Start Impact Study (2010) found that most Head Start benefits had disappeared by the end of first grade. The few differences that remained at the end of 1st grade for the four-year old cohort included increased receipt of health insurance, less withdrawn behavior, and better receptive vocabulary. The three-year old cohort maintained benefits in oral comprehension, parenting practices and social-emotional development. Thus, one key takeaway from this research is that, as purported by neurobiological and economic research, earlier childhood interventions appear to be more effective than later ones. It also indicates that changing parenting practices sooner may result in improvements in children’s behavior and longer-term outcomes (as behavior is tied to long-term academic success).
Several issues with Westat’s research methodology may have led to underestimation of the true effects of Head Start. First, 60% of the children not participating in Head Start participated in parental childcare or early education programs. In fact, the Head Start non-participants actually spent more hours per week in non-parental care, on average, than the Head Start participants did. Additionally, about 15 percent of the control group children did end up receiving Head Start services, while not all children selected to enroll in Head Start did so, making it even less likely that significant differences between the control group and the Head Start group would arise. Thus, the fact that any positive outcomes were found for Head Start participants relative to non-participants is impressive. Also, the study did not assess the impact of variation in program quality on program outcomes. The researchers found that 70 percent of Head Start programs were rated as having a “good” or “better” quality environment and only 60 percent of the programs provided an emphasis on language, literacy, and math activities. Finally, the social-emotional and health outcomes were not robustly measured, as they were based on parent and teacher self-reports, and hence were subjective (Westat 2010).
Another major concern posed by researchers is that the long-term benefits of Head Start can be identified only for those children who participated in its first few decades of operation, and studies of long-term benefits may not be relevant if effects of Head Start may be changing over time (more preschool options now than previously). Given these caveats, Ludwig and Phillips postulate that Head Start might pass a cost-benefit test if the short-term effects on achievement test scores were as small as 0.1-0.2 standard deviations (assuming current average Head Start costs of around $9,000 per child) (Ludwig and Phillips 2008) and that its benefit-cost ratio could be comparable to those in the model program.
The Early Head Start program was established much more recently, in 1995. Early Head Start (EHS) endeavors to provide high-quality child and family development services to low-income pregnant women and families with children ages three and under. The program promotes healthy prenatal behavior and family functioning to enhance the development of infants and toddlers (“About the Office of Head Start” 2010). EHS allows each community to design the program to best meet the needs of its low-income families.
Little longitudinal research has been done on the Early Head Start program to date. The research available shows that EHS programs that provide a mix of in-home and center-based services produced more significant impacts on a wide range of child and parent incomes,
19
including: increased children’s higher cognitive and language function, which may reduce likelihood of needing remedial services upon school entry; reduced early aggressive behavior in children, which lessens the risk of later behavior problems and difficulty in school achievement; and improved home environments, which support children’s learning and development when children are not in child care (Love et al 2005).
3. Cost-Benefit Analysis Methodology
3.1.Early Head Start & Head Start - Early Childhood Education
We performed a basic Cost Benefit analysis of funds allocated to Head Start and Early Head Start expansion. We decided to focus only on those funds because they could be linked to a specific amount of students to be served.
We take as cost the funds awarded by ARRA to the expansion of services. According to the City of Chicago, this amounts to $7.8 million. In our analysis we will not include the additional cost to the government of providing schooling to those students who would have dropped out had they not been in the program.
To estimate benefits we reviewed the literature and found impacts (in percentages) in Treatment versus Control groups due to attending other early childhood programs that have served as models for Head Start and Early Head Start. We acknowledge that model programs vary in size, scope and curriculum so the results of Head Start will not match the exact results of these programs but they can give a general idea of a ceiling impacts might have in the long run. Evidence has shown that early childhood education does have an impact on students’ outcomes, so we will assume there is not a No Impact scenario.
The Expansion had a goal of serving 590 additional children in the City of Chicago. To estimate the impacts on these children based on the literature findings we took impact measures from both HighScope/ Perry Preschool and the Abecedarian model and multiplied them by the number of additional children the expansion will serve. We only took impact measures of outcomes that had been measured in both programs. Additional measures not included will only improve the amount of benefits.
Table 1. Impact Measures
Outcomes Abecedarian1 High Scope/ Perry2
Dif T v C # participants* Dif T v C # participants*
Special Education -23% -136 -13% -77
Retention -24% -142 -5% -30
High school grad 16% 94 20% 118
Arrested as juvenile 0% 0 -9% -53
Smoker -16% -94 -11% -65
*
Table 2. Assumptions
Note: Dollar amounts in constant 2009 dollars adjusted when needed using the CPI Inflation Calculator provided by the Bureau of Labor Statistics.
To estimate the present value of additional earnings due to an increase in high school graduates we estimated the present value of a deferred annuity based on the difference in earnings of High School Graduates versus those who did not complete High School (U.S. Department of Education, National Center for Education Statistics (NCES). 2010). The Annuity would start when children turned 18 and continue until they retired at 67. For simplicity of calculation we assumed that the additional income per year for being a High School graduate would be the same each year and that all additional students who graduated lived and worked until retirement age. To get the present value of the annuity at age 3 we used a real discount rate of 3.2%. We did not include additional earning of those who graduated high school and then went on to graduate from college nor do we include the additional tax dollars the government will receive due to this increase in earnings.
To estimate health benefits we used the cost reduction due to a decrease in smokers for participants in both programs. To estimate the value of a decrease in smokers due to early childhood education we multiplied the decrease in smokers by the present value of the cost of smoking (private and social cost). Based on findings by the Sloan et al 2004 study “The Costs of Smoking” we estimated the average lifetime cost for men and women as $194,069 per smoker. We do not include in our analysis any other health benefit that might come from these programs.
We also estimated as a benefit cost saving for early childhood education for parents of the students chosen. If Head Start had not been available they would have had to pay for these services themselves. The cost savings increased money available to spend on other items. We estimated that parents of 3 year olds chosen would have to pay for 2 years of preschool and
Assumptions
Kids served EHS 300
Kids served HS 290
Total served by expansion 590
Discount rate (real) 3.20%
Av annual Full time day care 3 year olds $6,801 Av annual Full time day care 4 year olds $6,291
Cost of smoking lifetime women $120,386
Cost of smoking lifetime men $249,858
Cost of smoking lifetime average $185,122
Median annual earnings HS grad $29,893 Median annual earnings HS dropout $23,416
Difference in earnings $6,477
parents of 4 year olds for only 1 year. Cost of preschool was estimated using Child Care costs in the State of Illinois as presented by the National Association of Child Care Resource & Referral Agencies (2011). Average annual full time day care for 4 year olds was $6,290 and average annual full time day care for 3 year olds was $6,801. We assume that these cost were the same in 2009 and 2010.
We do not take into account in our analysis benefits from crime reduction due to decrease in juvenile and adult arrests and benefits from a decrease in welfare use. We also do not take into account other benefits attributed to early childhood education such as a reduction in special education and grade retention.
4. Cost Benefit Analysis Results
Table 3. Head Start Cost Benefit Analysis Results
We estimate that funds allocated to Head/ Start and Early Head Start expansion could produce Net Benefits that range from $22.37 million to $25.4 million, with Benefit Cost ratios around 3.8 - 4.2
Homeless Prevention and Rapid Re-Housing
2. Literature Review
Common impact measures were developed to evaluate both the Homelessness and Rapid ReHousing program, and the Community Service Block Grants aimed at mitigating problems associated with homelessness and mental health. The American Recovery and Reinvestment Act (ARRA) funds allocated to housing relocation will decrease the costs associated with case management, and increase efficiency in processing and placing homeless into subsidized housing. A review of the literature shows a high correlation between homelessness, substance abuse, and homelessness.
Scenario 1 (Abecedarian) Scenario 2 (Perry Preschool) Costs
ARRA Funds Awarded for Expansion $7,802,335 $7,802,335
Benefits
Pre k/ k costs savings $6,030,050 $6,030,050 Health $17,475,509 $12,014,413 Increase in Earnings for Additional HS
Graduates $9,701,473 $12,126,842 Total Benefits $33,207,033 $30,171,304 Net Benefits $25,404,698 $22,368,969 B-C ratio 4.26 3.87
2.1.A New Approach to Homelessness
The passage of ARRA redirected the national approach to addressing homelessness by focusing on prevention of homelessness rather than on those individuals and families who are already homeless. The new Homelessness Prevention and Rapid ReHousing Program (HPRP) provides support to at-risk individuals and also attempts to move homeless households into permanent living situations. The HPRP does not support shelters and other traditional services. While studies of prevention programs in European countries have demonstrated positive outcomes for participants, much more research will be necessary in order to understand the how effective these programs will be in the U.S. (Culhane et al 2010). In their paper, “A Prevention-Centered Approach to Homelessness Assistance: A Paradigm Shift?”, Dennis Culhane, Stephen Metraux, and Thomas Byrne cite the most important goals for homelessness programs as 1) providing affordable and accessible housing to all; 2) eradicating poverty; and 3) preventing substance abuse. These broad ideas can be focused into specific impact measures to be measured in a cost-benefit analysis. Two main measures should be the focus: efficiency and effectiveness (Bush 2005). A successful homeless prevention program will reduce overall homelessness in the target area, reduce costs associated with public health, and a decrease substance abuse rates.
2.2.First-time Homelessness versus Repeat Homelessness
Specifically insightful to the analysis of the value of Homeless Prevention funds was the paper distributed by the U.S. Office of Housing and Urban Development titled, “Costs Associated with First-Time Homelessness for Families and Individuals”, which, using research from seven cities, attempts to estimate the cost of first-time homelessness, a new focus on the area of homelessness studies. The HUD report measures costs associated with first-time homeless families and individuals incurred by homeless and mainstream service delivery systems in six communities. Unaccompanied individuals were studied in Des Moines, Iowa; Houston, Texas; and Jacksonville, Florida. Families were studied in Houston, Texas; Kalamazoo, Michigan; Upstate South Carolina; and Washington, DC.
The first-time homeless individuals in the communities studied were predominantly male (73 to 81 percent) and had an average age of 39 to 41 years at program entry. African-Americans are over-represented among first-time homeless individuals in comparison to the general population of individuals in poverty. The first-time homeless families in the study primarily had only one adult member (80 to 89 percent), were comprised of female adults accompanied by children (82 to 90 percent), and had on average 3 to 3.5 members. On average, adults were 30 to 32 years old when they first used a homeless program, and 41 to 50 percent of the children were 6 years old or younger.6 The majority of individuals studied (55% – 67%) were only homeless for a very short period of time, ranging from one to three weeks, and their use of emergency
6
"City of Chicago :: Basic Needs (Health & Human Services)." City of Chicago. Web. 28 March 2011. <http://www.cityofchicago.org/city/en/progs/recovery_reinvest/education3.html>
shelters represented the best use of funds – given that these shelters are very low cost for individuals.
The findings from the study provide a broad-base for understanding of homelessness and its associated costs; it presents ideas about opportunities for cost savings and lays out the groundwork for communities to successfully deal with their homeless, and at-risk families. The study identified the various costs associated with first-time homelessness and how they vary by region and user; emergency shelters are the lowest-cost option for individual adults, but the highest cost option for families, as they frequently require their own rooms or special accommodations. The highest cost savings were identified for those individuals and families that use these services for longer terms, which quickly deplete funds and reduce the opportunity for turnover or helping many individuals (Abt Associates Inc, et al 2010). Lastly, further research areas are identified such as evaluations of program size or structure as related to cost savings, using characteristics to identify at-risk individuals before they become homeless and the need for further research involving the mainstream costs associated with homeless individuals.
Determining the value of preventing homelessness presents a challenge in that there is no easy way to measure the cost of an individual or family becoming homeless. Estimates vary from $0 to hundreds of thousands of dollars, depending upon the duration of homelessness, the medical and mental condition of the individual, where they are located, and many other factors.
2.3.Homelessness and Mental Health
Homelessness and mental health problems are highly correlated (Gelberg 1988). A 2000 study on service interventions for mentally ill homeless people (outreach, case management, and housing placement) showed positive effects across measures of health and housing outcomes, but major additional costs are also associated with such programs (Rosenheck 2000). A 2003 cost-effectiveness study performed a random control trial experiment on 96 study participants in 1991 to 1993. The treatment group was assigned to a critical time intervention. The study produced significant positive results for the treatment group: they received services at a cheaper rate than the control group for acute care services, outpatient services, housing and shelter services, criminal justice services, and they spent less homeless nights (Jones et al 2003).
A second 2003 study focused specifically on supported housing that integrated clinical services for homeless veterans with mental illness and substance abuse issues. In 1992, 460 participants were assigned to one of three groups 1) a voucher and intensive case management program, 2) a case management only program, and 3) a standard VA care program. Outcomes measured were days housed vs. days homeless, mental health status, community adjustment, and costs. Findings showed that veterans receiving vouchers and intensive case management had 16 percent more days housed than the case management only group, and 25 percent more days housed than the standard care group. Additionally, the first group was served more cost effectively, but it did not show better outcomes in measures of substance abuse, mental health or community adjustment (Rosenheck 2003).
3. Cost Benefit Analysis Methodology
3.1.Homeless Prevention in the United States
In order to determine the impact of the ARRA funding for homeless prevention, we worked with the Emergency Fund to collect data on the funds they have distributed thus far to participants in their homeless prevention program. This data would be used to calculate the average cost of homeless prevention in Chicago. To contrast what was spent with the estimated cost of first-time homelessness, we worked primarily with data from HUD’s report, “Costs Associated with First-Time Homelessness for Families and Individuals”. The key impact measure then was the direct-savings of preventing homelessness; other non-direct costs are noted, but not included in the final analysis. From this study we used their low and high estimates of the direct cost of first-time homelessness and calculated an overall average cost of $2,202 for an individual and $12,935 for a family with children (see table 1). To conduct a baseline analysis we decided to use the HUD report noted above to find an average cost of first-time homelessness.
Table 1: Estimated cost of first-time homelessness from HUD report (2010)
Note: Average calculated using data given from HUD report page ES-7
These cost estimates are of the direct cost of first-time homelessness and include only services that are targeted to and used solely by those who become homeless such as shelters, emergency shelters, street outreach programs, transitional housing, and other services created only for the consumption of homeless individuals and families.
The indirect costs of homelessness are all mainstream costs that are not exclusive to homelessness which cannot be easily separated from the costs of non-homeless users. Mainstream costs include items such as medical expenses, often in the form of emergency room visits, use of law enforcement and the criminal justice system, mental health treatment, drug rehabilitation, and other such services. Various studies of the mainstream costs of homelessness have estimated the cost per individual or family much higher than just the first-time costs we consider further below, these increased costs that could impact the true estimate of first-time homelessness.
Estimated cost of first-time homelessness Low Cost Estimate High Cost
Estimate
Average Cost Estimate
Individual $1,831 $2,572 $2,202
A Massachusetts study found that the average medical cost of a homeless person was $26,124/year.7 The New England Journal of Medicine found that Homeless people spent an average of four days longer per hospital visit than comparable non-homeless people, costing approximately $2,414 more per hospitalization.8 And a two-year survey of homeless individuals conducted by the University of Texas found that each person cost the taxpayers $14,480 per year, primarily for overnight jail.9 While these numbers do not directly translate to Chicago, or to all homeless, they highlight the significant costs of homeless to individuals and society as a whole and illustrate that the cost of first-time homelessness can be much higher and frequently depend on who becomes homeless.
3.2.Homeless Prevention in Chicago
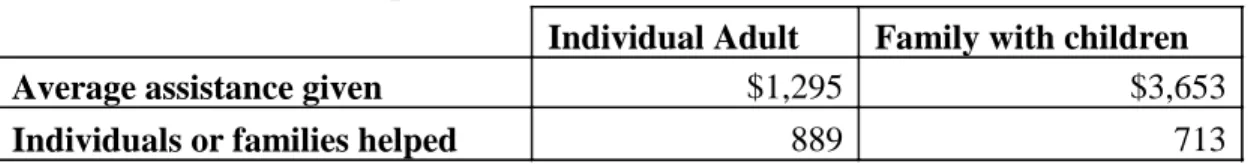
Using the Emergency Fund data on the distribution of ARRA funds from January 2010 to March 2011, we were able to calculate the average amount of money distributed to prevent homelessness in various situations (see table 2). The total amount distributed for homeless prevention was a little over $5 million ($5,076,312), and a total of 713 families (adults with at least one child) and 889 adults were helped and kept in their homes. In our analysis we assume the counterfactual is that if these funds were not distributed, these individuals and families would become homeless, incurring costs on the system.
Table 2: Cost of Homeless prevention in Chicago based on distribution of ARRA funds
Source: Authors’ calculations based on data provided by the Emergency Fund for homelessness prevention funds distributed from 1/10 – 3/11
4. Homeless Prevention Cost-Benefit Analysis Results
The results of the analysis on funding for Homeless Prevention show that investing in homeless prevention is economically sound. In the analysis, which used the average cost of homeless prevention from the data from the Emergency Fund and the average cost of homelessness based on the HUD report, we found that preventing homelessness always led to cost savings. Through the emergency fund’s prevention of homelessness we estimate a cost savings of about 7.5 million dollars (or $7.1 million in 2009 dollars).
7
MA homelessness study
8
New England Journal of Medicine study
9
Individual Adult Family with children
Average assistance given $1,295 $3,653
These savings were derived using the Emergency fund data indicating they had assisted 889 individuals and 713 families with children, costing an average of $1,295 and $3,653 respectively. We then used the average cost of homelessness from the HUD report and subtracted the average cost in Chicago, which always lead to cost savings, with a savings of $907 per individual and $9,282 per family, again, assuming that the counterfactual is that the individual/family would have become homeless had it not been by the ARRA-funded support from the Emergency Fund. To find the overall impact of the funding we multiplied the savings per unit by the total units (either individuals or families) that were prevented from becoming homeless and found savings/ prevented spending of approximately $7.5 million dollars ($7.1 mil. in 2009 dollars) about $800 thousand for individuals and 6 million for families. This is about $2.4 million in net benefits ($2.24 mil. in 2009 dollars). Extrapolating the preceding data for the number of potentially homeless individuals and families served leads to a savings of approximately $7.5 million dollars or a return of $1.46 ($1.39 in 2009 dollars) for every $1.00 spent for prevention. See table 3 for calculations in 2011 dollars, relevant outcomes converted to 2009 dollars in preceding paragraph.
In these calculations we opted to focus on averages rather than breaking out the data to individuals or families receiving one-time assistance versus receiving assistance more than once, as we initially thought would be valuable, because the program is not yet complete and funds are still being distributed. Dividing the data in such a manner prior to the completion of the program would skew the cost of one-time assistance, likely higher, as many of the individuals who are currently marked as ‘one-time’ users, may need assistance again before the funds are spent, especially since the data used ends in March 2011.
Table 3: Savings realized by preventing homelessness in Chicago
Note: Calculations completed by author, using data from tables 1 and 2.
Individual Adult Family with children Average cost of first-time homelessness $2,202 $12,935
Average assistance given $1,295 $3,653
Average savings
(cost - assistance) $907 $9,282
Individuals or families helped 889 713
Savings to date
5. Conclusion and Recommendations
5.1.Title I and SFSF funds
Based on our analysis of the results we find that it was a good idea to invest Title I and SFSF funds to prevent teacher layoffs and class increases. Because of the rules and regulations in place regarding who gets laid off the impact of the possible layoffs would have been on the high side. Though evidence on the impacts of class size has been mixed we believe keeping classes small does have a positive impact on achievement. If we not only kept the classes small, but also retained the best teachers, impact could be even greater. Because the decision on who gets laid off is based on seniority and not on performance one area to explore in the future could be introducing performance results into this decision.
Benefits are not only private, but society and the government can experience some of them as well. By keeping classes small there is an income gain to students, which then translates into higher taxes paid to the government, who in turn invests that additional revenue in programs of benefit to society.
5.2.Early Head Start/ Head Start
Based on our analysis of the Head Start Expansion we think it is a good idea to continue funding Head Start. The problem with early education program is that benefits are accrued throughout the lifetime of the student, with most of them coming long after they finish the program so it is difficult to justify the cost in the short term, especially since cognitive gains in students have proven to fade out over time. However non-cognitive gains have proven to have an even higher impact, with students attending these programs showing, among other benefits, lower crime rates and better health outcomes than their peers. These impacts bring clear benefits to society and the government.
For the Head Start programs to have the maximum results that resemble those of the model programs, some changes are needed. What these are should be explored further in future research.
5.3.Conclusions and Recommendations
Based on our findings, investing in homeless prevention is a good idea and the city should continue to fund, or seek funds to keep this program in action after ARRA funds are depleted. Further, we believe our estimates of the benefits of preventing homelessness may be underestimated and that the benefits realized by the city are far greater. While the direct costs of these outcomes show it may only cost society a few thousand dollars for an individual or family to be homeless, these costs do not include the myriad of non-direct costs that homelessness creates. As noted earlier various studies have found the costs of homelessness can be far greater
than the direct costs in the HUD study and our analysis; 26,124 per year in medical costs, $14,480 per year in overnight jail and an extra $2,414 per hospital stay are just some of the potential increased costs.
Beyond these costs are the social costs of homelessness that cannot be measured, what is the lifetime impact of becoming homeless? How does homelessness impact children? And what are the costs to society of allowing people, just like us, to become homeless? While these questions cannot be directly analyzed, it is worth considering that the benefits from preventing homelessness far outweigh the thousand dollars per person and few thousand per family.
Chapter 2. Workforce Development
1. Introduction
1.1. Overview of ARRA Workforce Investment Act Funding
The eleven-county metropolitan Chicago region received an allocation of approximately $90.4 million for Workforce Investment Act (WIA) Adult, Dislocated, and Youth programs through the American Recovery and Reinvestment Act (ARRA).10 Cook County’s allocation of approximately $64.1 million is roughly 68% of total ARRA funds allotted to the metropolitan Chicago region for workforce development programs and approximately 39% of Illinois’ allocation of ARRA funds for workforce development purposes (Workforce Development Boards of Metropolitan Chicago, 2010). Of the $64.1 million allocated to Cook County, WIA Dislocated Worker programs received an estimated $26.7 million, WIA Youth programs received $25.1 million, and WIA Adult programs received $12.3 million (Workforce Development Boards of Metropolitan Chicago, 2010). Between February, 2009, and June, 2011, we calculate that an estimated 5194 Cook County residents participated in WIA Dislocated Worker programs, 3433 residents participated in WIA Adult programs, and 10,338 residents participated in WIA Youth Programs (Metropolitan Workforce Boards of Chicago, 2010). We return to how we calculated these estimates in the cost-benefit analysis section below.
In order to convey the nature of WIA services, it is useful to briefly describe the target populations of each constituent program. Passed by Congress in 1998, WIA programs replaced the Job Training Partnership Act to create a “comprehensive” set of integrated services, ranging from training services to career planning (Heinrich, Mueser, and Troske, 2008). WIA Dislocated Worker programs primarily assist workers who have been terminated and have difficulty finding employment. Such workers may include individuals who have lost employment due to “permanent” plant closures and are unlikely to find employment in their previous occupation (Illinois Department of Commerce and Economic Opportunity, 2007). WIA Adult programs serve economically disadvantaged adults with weak labor market attachments with entry or reentry into the job market (Workforce Development Boards of Metropolitan Chicago, 2010). Finally, WIA Youth programs assist primarily low-income eligible youth, ages 14 – 21, who encounter barriers to employment. In the metropolitan Chicago region, WIA Youth services primarily provided eligible youth with employment opportunities during the summer of 2009 (Workforce Boards of Metropolitan Chicago, 2009).
10
The 2010 report by the Workforce Boards of Metropolitan Chicago includes allocations for the following counties: Cook, Lake, McHenry, Kane, DeKalb, Kendall, DuPage, Will, Grundy, Livingston, and Kankakee. For a list of allocations by county, see: Workforce Boards of Metropolitan Chicago. 2010. Status Report: Use of American Recovery and Reinvestment Act Funds Expanding the Workforce Investment Act Program. Workforce Indicator Report 09. <http://www.workforceboards
1.2. ARRA-Funded Services and Programs
In the metropolitan Chicago region, ARRA funds supported the following kinds of services. For WIA Dislocated Workers, 60% of enrollees received classroom training, ranging from occupational classroom training to training in green jobs. Private sector training accounted for less than 1% of training services, and 76% of enrollees received career planning assistance (Workforce Boards of Metropolitan Chicago, 2010). With respect to WIA Adult programs, approximately 44% of enrollees received classroom training, and 81% received career planning (Workforce Boards of Metropolitan Chicago, 2010). Finally, for WIA Youth programs, 98% gained paid work experience through ARRA funding, and 67% received some job search and skills training (Workforce Boards of Metropolitan Chicago, 2010). These numbers make clear that some enrollees may receive overlapping services and may experience different intensities of service provision, which is consistent with the literature on workforce development that we discuss below.
In terms of specific workforce development programs, one of the largest recipients of ARRA funds in Cook County was the Workforce Board of Northern Cook County.11 The Workforce Board of Northern Cook County received approximately $3.5 million for WIA Dislocated Worker, Adult, and Youth services. In terms of training and job placement services, the Workforce Board of Northern Cook County focuses on training and job placement strategies in the following sectors: health care, transportation, warehousing and distribution, technology, and hospitality. Another large recipient of ARRA funds was the Community and Economic Development Association of Cook County (CEDA). CEDA received approximately $2 million dollars in ARRA funds and provides both training services and job search/placement services. With regard to training services, CEDA offers occupational skills training, on-the-job training, job readiness training, and education and literacy services.12
The analysis proceeds as follows. In the second section, we review appropriate impact measures through a discussion of relevant studies and evaluate the comparability of WIA participants in the metropolitan Chicago region to participants in these studies. In the third section, we present our methodology and findings for a cost-benefit analysis of Cook County workforce development programs. Finally, in the fourth section, we offer an assessment of our cost-benefit analysis and some considerations for future evaluations of Cook County workforce development programs funded by ARRA.
11
Obtained from www.recovery.gov.
12
2. Review of Literature, Impact Measures, and Participant Demographics 2.1. Relevant Workforce Investment Act Evaluations
In the realm of workforce development evaluations, experimental designs relying on random assignment tend to be costly and politically controversial (Smith, 2000). In this context, “quasi-experimental” methods using propensity score matching have become a popular method among researchers of workforce development programs (Smith, 2000). Within the array of propensity-score matching techniques, the “nearest neighbor” matching method chooses non-participants that are close to non-participants on a range of characteristics (Heckman, LaLonde, and Smith, 1999). Currently, this matching approach is popular in terms of workforce development evaluations, particularly when large sets of administrative data are available (Smith, 2000). In our review of the literature, most studies employ the nearest-neighbor matching method or some variation on this approach when random assignment is not possible.
In the first-ever evaluation of WIA programs for the United States Department of Labor, Heinrich, Mueser, and Troske use state-level administrative data to conduct a non-experimental evaluation of WIA Adult and WIA Dislocated Worker programs across twelve states. Their evaluation includes approximately 160,000 WIA participants who entered the program in 2003-2005 and about three million comparison group members (Heinrich, Mueser, and Troske, 2008). Accoring to Heinrich, Mueser, and Troske, they match participants to non-participants based on a range of demographic characteristics, such as type and duration of labor market experience, receipt of public assistance, and geographic location (Heinrich, Mueser, and Troske, 2008).
For this evaluation, the authors use the change in earnings relative to the control group as the key impact measure, and they do not conduct a full cost-benefit analysis for each program. Importantly, they note that participants in both the Adult and Dislocated programs receive a range of services, may receive more than one service, and the intensity of such services varies across participants. In this vein, they indicate that the impacts or change in earnings that they estimate must be viewed as an “average” (Heinrich, Mueser, and Troske, 2008). In general, the evaluation finds stronger, more positive net benefits for participants in the WIA Adult program and more mixed results for participants of the Dislocated Worker program. Overall, the authors speculate that pre-program dip in earnings is more modest for WIA Adult program participants and more “pronounced” for WIA Dislocated Worker participants. Additionally, they indicate that the opportunity costs of program participation for individuals in the Adult programs may be somewhat less than for their counterparts in the Dislocated Worker programs (Heinrich, Mueser, and Troske, 2008). We return to this observation in our cost-benefit analysis and conclusion below.
For both programs, the authors present average impact estimates for quarters 1-5 and quarters 11-16 in order to compare earnings immediately after program participation to those gained a few years afterward. Importantly, the authors include zero earnings within their estimates for all programs. As such, the authors account for changes in wages and whether