DEEP MULTI-VIEW FEATURES FROM RAW AUDIO FOR ACOUSTIC SCENE
CLASSIFICATION
Arshdeep Singh, Padmanabhan Rajan, Arnav Bhavsar
MANAS LAB, School of Computing and Electrical Engineering,
Indian Institute of Technology, (IIT), Mandi, India
[email protected], [padman,arnav]@iitmandi.ac.in
ABSTRACT
In this paper, we propose a feature representation framework which captures features constituting different levels of abstraction for audio scene classification. A pre-trained deep convolution neu-ral network, SoundNet, is used to extract the features from vari-ous intermediate layers corresponding to an audio file. We consider that the features obtained from various intermediate layers provide the different types of abstraction and exhibits complementary in-formation. Thus, combining the intermediate features of various layers can improve the classification performance to discriminate audio scenes. To obtain the representations, we ignore redundant filters in the intermediate layers using analysis of variance based redundancy removal framework. This reduces dimensionality and computational complexity. Next, shift-invariant fixed-length com-pressed representations across layers are obtained by aggregating the responses of the important filters only. The obtained compressed representations are stacked altogether to obtain a supervector. Fi-nally, we employ the classification using multi-layer perceptron and support vector machine models. We comprehensively perform the validation of the above assumption on two public datasets; Making Sense of Sounds and open set acoustic scene classification DCASE 2019.
Index Terms— Acoustic scene classification, Deep neural net-work, SoundNet.
1. INTRODUCTION
Acoustic scene classification (ASC) aims to utilize the audio infor-mation in everyday soundscapes to recognise the underlying phys-ical environment (commonly referred to as scene). Traditionally, most of the work in audio scene classification, inspired from the closely related fields such as speech recognition and music anal-ysis, employed hand-crafted time-frequency based representations such as spectrogram, log-mel energy, mel-frequency cepstral coef-ficients, constant-Q-transform etc. However, the hand-crafted fea-tures are often not able to adapt to acoustic scenes data owing to the complexity which arises mostly from many independent unknown sources which produces unstructured sounds. Moreover, the audio information in the scene spans whole audio spectrum . To circum-vent this, feature learning based approaches are being applied to learn relevant information directly from time-frequency representa-tions. For examples, the work in [1] applied matrix factorization based representations. [2] used i-vector and deep convolution neu-ral network (CNN) based features. The study [3] used a dictionary learning framework which captures the rare and most frequently occurring sound events. Apart from this, ensemble based methods
which combines multiple channels and models are also being re-ported [4].
A few studies explored the feature representations from raw au-dio directly. For example, [5] demonstrated that deep CNNs trained directly on very long raw acoustic sound waveforms can outperform than CNNs with similar architecture on handcrafted features. The study [6] proposed a pre-trained deep convolutional neural network, SoundNet, that accepts raw audio as input. The work [7] performed a layer-wise analysis on SoundNet layers and proposed an ensemble framework in decision space.
In this paper, we propose a representations framework for ASC by utilizing the intermediate layer representations obtained using SoundNet, from raw audio. Our underlying assumption is that the intermediate representations of different layers in SoundNet, corre-spond to different details of an audio. To illustrate this, we show the frequency response for some of the learned filters in the first and second convolution layers of SoundNet in Figure 1. It can be observed that the filters (a) and (b) in the first convolution layer have different bandpass frequency characteristics and hence, pro-duce different details of an audio. In the subsequent layers, the output of the filters from the previous layer is being operated with a different set of filters, which also posses different bandpass in-formation. As shown in the Figure 1, the learned filters (c)-(e) in the second convolution layer have different bandpass characteris-tic and operate on the output of the filter (a) (learned in the first convolution layer). Similarly, the filters (f)-(h) in the second con-volution layer operate on the output of the filter (b) which is being learned in the first convolution layer. Therefore, an audio signal is operated upon by filters having different frequency responses along the layers. Moreover, the non-linear operations such as batch nor-malization and ReLU transformation, project the data into different subspaces [8]. Therefore, the representations obtained from differ-ent layers can be considered as exhibiting differdiffer-ent characteristics of an audio.
Henceforth, such intermediate representations are further trans-formed into compressed features as explained in subsection 2.2 and concatenated altogether to build a supervector, which captures the multiple details of an audio. Empirically, we analyse the validity of the proposed feature representation approach for two publicly avail-able datasets.
The rest of the paper is organized as follows. Section 2 gives the main idea of our proposed method in which we describe the feature extraction, the compressed feature representation and the classification methods. Section 3 shows the experimental setup and findings. In Section 4, we conclude this paper.
First convolution layer
(c) (d) (e) (f) (g) (h)
Second convolution layer
(a) (b)
Figure 1: Single-sided magnitude of frequency spectrum for some of the learned filters in SoundNet. (a) and (b) shows the frequency response for fifth and sixteenth filters respectively in the first convolution layer. (c)-(h) shows frequency response of filters in second convolution layer. The filters (c)-(e) (here, only three are shown) operate on the output produced by filter (a). Similarly, (f)-(h) shows frequency response for filters which operate on response of (b) filter. Here, the frequency spectrum is computed using 64-point DFT and the magnitude (dB) is 20 log|X(f)|.|X(f)|is the magnitude of frequency spectrum.
2. PROPOSED METHODOLOGY 2.1. A brief on pre-trained 1-D CNN
SoundNet is a 1-D CNN, trained on large-scale weakly labeled video datasets, ultimately performing transfer learning from video to audio. The architecture has 8-layers namely convolution, pool-ing layers and operates on the raw audio directly. Each convolution layer (denoted as C) output is computed by convolution operation followed by batch normalization (denoted as p-C) and non-linear activation operations (ReLU).
An audio signalx, of durationtseconds, and sampled atfs
frequency, can be represented into a 2-D representations∈RN×s
using any intermediate layer of SoundNet. Here,Nandsrepresent the number of feature maps and their size respectively in a given layer.
2.2. Compressed feature representation and classification
T ime Baby cry event T ime C1 layer feature maps Feature map index Feature map index C3 layer feature maps
Baby cry event + silence Audio signal
Figure 2: 2-D intermediate layer representations for first (C1) and third (C3) convolutional layer in SoundNet corresponding to 5 sec-onds audio. Here, the audio is a baby cry event and a silence.
The intermediate 2-D feature representations obtained from SoundNet have very high dimensionality of the order of approx. 16M and 27k for an audio of length 5 seconds sampled at 44.1kHz
for first (C1) and third (C3) convolution layer respectively. In addi-tion, the size of representations depend on the input audio length and the representations are not time-invariant. Figure 2 demon-strates the time-variance of the intermediate layers representations as the input shifts in time.
We reduce the dimensionality in two ways: first, since all the learned filters in SoundNet do not provide discriminatory response [9], some of the filter responses can be ignored. We employ anal-ysis of variance method based pruning procedure as proposed in [10] to identify the filters, which generates discriminating response across scene classes. This is done for each of layers independently. Ignoring the non-discriminating responses result into a reduced di-mension 2-D representations∈RN0×s, whereN0≤N. Second, to
compute the time-invariant representations and compress the inter-mediate representation further, global sum pooling is applied across the response of filters . This results into a fixed-length representa-tions∈RN0of an audio for a particular intermediate layer.
Hence-forth, we call these fixed-length representations ascompressed fea-tures.
We utilize the compressed features from various layers to build a global super-vectorξ, representing different details of an audio by concatenating the compressed features from various layers. A variable length audio of very high dimensionality can now be rep-resented usingξ-features. Since these features represent different characteristics of an audio, therefore we call them“multi-view
fea-tures”. Finally, we employ multilayer perceptron (MLP) model and
support vector machine (SVM) as a classifier. The flow diagram of the overall proposed framework is shown in Figure 3.
3. PERFORMANCE EVALUATION 3.1. Dataset and Experimental setup
We use the following audio scene classification (ASC) datasets for evaluation: first, the Making Sense of Sounds (MSOS) challenge dataset [11], comprising of a development dataset consists of 1500 audio files divided into the five categories, each containing 300 files. The number of different sound types within each category is not bal-anced. The evaluation dataset consists of 500 audio files, 100 files per category. F-measure and accuracy metrics are used to measure the performance.
SoundNet 8-Layer architecture
C1
Input raw audio signal
661501X16 82678X16 41344X32 2585X64 41X1024 5168X32 (1323000 x 1) P1 C2 P2 C3 C7 17X1401
C8 important filtersANOVA-based identification ANOVA-based important filters identification ANOVA-based important filters identification Multi-view features Global sum pooling Global sum pooling Classifier Global sum pooling
Figure 3: Overall proposed framework. The size and number of feature maps for each layer are shown corresponding to input of 30 seconds length sampled at 44.1kHz. C1, P1, C2 etc. represents first convolution, first pooling, second convolution and so on layers.
(a) (b)
(c) (d)
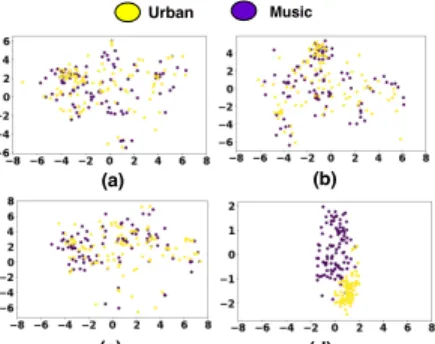
Urban Music
Figure 4: t-SNE plot of compressed features obtained from (a) P2, (b) C3 (c) C7 and (d) the proposed multi-view features from various layers of two classes namely, urban and music from MSOS Evalua-tion dataset.
leaderboard dataset [12] (DCASE), comprising of ten known tar-get classes and one unknown class is used. The “unknown” class has additional data of several unknown acoustic scenes. The train-ing and testtrain-ing development data is divided as described in the task protocol for all 11 classes. We handle the out-of-set classification as follows. A given test recording is being classified as a particular scene class if the class-specific probability is greater than threshold (τ),τ ∈ [0,1). Otherwise, if all classes have lesser thanτ, the sample is assigned as an unknown class label. For DCASE dataset, the weighted average accuracy (αw), the accuracy of known classes (αk) and unknown class (αu) is used as metric as given in the Equa-tion 1. We report the performance for leaderboard dataset using the online portal.
αw= 0.5∗αk+ 0.5∗αu (1) The compressed features are computed from C2 to C7 layer (a total of 4256 filter responses) including the p-C layers. We obtain a total of 1307 non-redundant filter responses, as explained in section 2.2. This leads to give multi-view featureξ∈R1307obtained from
12 intermediate layers after performing global sum pooling on each filter response.
The classification model parameters such as number of hidden layers, neurons in MLP and hyper-parameters of non-linear SVM are selected empirically. The MLP is trained with Adam optimizer
C7 P5 P2 C3 Multi-view(SVM) Multi-view(MLP) SoundNet Layers 0 0.2 0.4 0.6 0.8 1 F-measure
Nature Human Effects Urban Music
Figure 5: F-measure obtained with compressed features from C7, P5, P2, C3 layers using SVM and multi-view features using SVM and MLP for MSOS dataset.
Figure 6: Confusion matrix using multi-view features with MLP for MSOS dataset.
and cross-entropy categorical loss for 100 epochs. Empirically, we find that single hidden layer having 30 neurons with hyperbolic tan-gent activation function suits well for our classification task.
3.2. Results and Analysis
3.2.1. Dataset (A): Making sense of Sounds
Figure 4 shows the t-SNE plot for compressed features obtained from various intermediate layers and ξ-features for two sound classes. It can be observed that theξ-feature space shows lesser
inter-class overlap as compared to the feature space generated from the individual intermediate layers.
In addition to give more separability, theξ-feature space also
utilizes complementary information given by various layers. This can be observed from Figure 5, which shows the F-measure, com-puted using the compressed features obtained from various interme-diate layers andξ-features. The F-measure for a given class varies across layers, for example, “Nature” has larger F-measure for C3 layer as compared to C7 and P2 layers. This is valid for “Human” as well. However, C7 layer has larger F-measure for “Effects” as compared to P2 and C3 layers. This empirically shows that the fea-ture space generated from various layers constitute complementary information. Utilizing the compressed features from various lay-ers to build multi-view features improve the F-measure of all scene class significantly. The accuracy for compressed features from C7, P5, P2, C3 andξ-features using SVM is 64.2%, 79%, 59.6%, 70% and 91% respectively. Using MLP, the accuracy obtained withξ -features is 93.2%. Figure 6 gives the confusion matrix obtained usingξ-features with MLP as a classifier. It can be observed that
“Urban” is most frequently confused as “Nature” and “Human”.
Comparison with existing methods:Figure 7 shows the
Nature Human Effects Urban Music MSOS Scene Classes
70 80 90 100
Accuracy (%)
Baseline State-of-the-art Our proposed
Figure 7: Comparison of class-wise accuracy with the existing methods for MSOS dataset.
(a) (a') (b) (b') (c) (c') (d) (d')
Airport Bus Metro Unknown
Figure 8: t-SNE plot across SoundNet layers for compressed fea-tures from (a) P2 (b) C3 (c) C7 and (d) the proposed multi-view features for three scene class, namely airport, bus and metro. Here, (a’), (b’), (c’) and (d’) shows the same when unknown class is also being considered.
our proposed approach with MLP. For all classes, our proposed ap-proach provides significant improvement as compared to the base-line. On the other hand, the performance is equivalent to state-of-the-art with an improvement for “Nature” and Effects by 3% and 1% respectively, however, the performance degrades for “Human” and “Urban” by 1% and 4% respectively. The accuracy across classes for baseline, the state-of-the-art and our proposed approach is 81%, 93.4% and 93.2% respectively.
3.2.2. Dataset (B): TAU Urban Acoustic Scenes 2019 Openset
Figure 8 shows the t-SNE plot obtained using compressed features from various layers andξ-features for three known classes, airport, bus, metro and one unknown class. It is notable that the proposed multi-view features are able to provide better separation among known classes as compared to the classes considering both known and unknown.
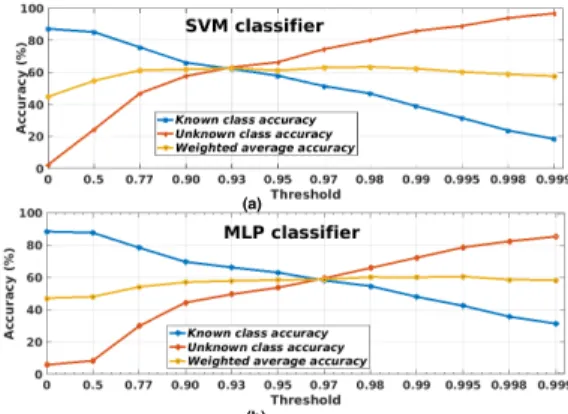
Figure 9 gives the performance obtained using MLP and SVM classifier asτ varies from 0 to 1. Forτ close to 0, the classifiers are able to classify the known classes significantly well. However, the unknown class has poor accuracy. Asτincreases, the unknown
class accuracy increases, however, when τ is very close to 1, the known class accuracy is poor. It can be observed that there is a trade-off in accuracy of the known and unknown class with thresh-old. Our proposed framework improvesαwsignificantly by 12% to 31% (choosing0.5< τ <1) as compared to that of baseline [12]
which hasαwequals to 48.7%.
For leaderboard dataset, αw is computed through the public leaderboard online portal. Figure 10 showsαwas a function ofτ
with MLP and SVM classifiers. In case of MLP, as theτ increases towards 1, theαw also increases and approaches to the baseline performance which is around 44% (private leaderboard). Utiliz-ing SVM, theαwremains constant at 17.5% beyond 0.5 threshold. This may be due to the over-fitting of the SVM classifier towards the
(b) (a)
Figure 9: Known, unknown and weighted average accuracy as a function of threshold (τ) using (a) SVM and (b) MLP as a classifier for DCASE development dataset.
Figure 10: Weighted average accuracy (αw) as a function of thresh-old using MLP and SVM for DCASE leaderboard dataset. training dataset.The predicted scene labels obtained using different
threshold for leaderboard dataset can be found on this link.
3.2.3. Discussion
The proposed approach is performing well for MSOS dataset. How-ever, the overall performance for DCASE dataset especially the leaderboard dataset (recorded at different locations and time in-stants), is not that overwhelming. We speculate that this might be caused because the resulting latent space obtained from a pre-trained model is not able to discriminate each of the classes, es-pecially the “unknown” class. SoundNet is trained using transfer learning from 2 million Flicker videos [6]. The MSOS dataset con-tains the audio files collected from Freesound and the other online sources [11]. This may lead to give similar distributions between the learned parameters of SoundNet and the MSOS dataset, hence, the model shows good representation strength. However, the DCASE dataset is recorded at various locations in an uncontrolled environ-ment and with more confusing classes. Hence, DCASE dataset shows more domain mismatch to the pre-trained SoundNet. In addi-tion, the complexity of DCASE dataset can not be ignored. There-fore, we experiment to adapt the existing model with new datasets such as DCASE and expecting to perform better than the approach proposed in this paper in future.
4. CONCLUSION
We propose a feature representation framework using various inter-mediate levels of the pre-trained deep CNN SoundNet, for acoustic scene classification. The combined features from the intermediate layers are able to provide better discrimination as compared to the features from each of the individual layers.
5. REFERENCES
[1] V. Bisot, R. Serizel, S. Essid, and G. Richard, “Supervised nonnegative matrix factorization for acoustic scene classifica-tion,” DCASE2016 Challenge, Tech. Rep., September 2016. [2] H. Eghbal-Zadeh, B. Lehner, M. Dorfer, and G. Widmer,
“CP-JKU submissions for dcase-2016: a hybrid approach using binaural i-vectors and deep convolutional neural networks,”
IEEE AASP Challenge on Detection and Classification of
Acoustic Scenes and Events (DCASE), 2016.
[3] A. Singh, A. Thakur, and P. Rajan, “APE: Archetypal-prototypal embeddings for audio classification,” in2018 IEEE 28th International Workshop on Machine Learning for Signal
Processing (MLSP). IEEE, 2018, pp. 1–6.
[4] S. Mun, S. Park, D. Han, and H. Ko, “Generative adversarial network based acoustic scene training set augmentation and selection using SVM hyper-plane,” DCASE2017 Challenge, Tech. Rep., September 2017.
[5] T. Purohit and A. Agarwal, “Acoustic scene classification us-ing deep CNN on raw-waveform,” DCASE2018 Challenge, Tech. Rep., September 2018.
[6] Y. Aytar, C. Vondrick, and A. Torralba, “Soundnet: Learning sound representations from unlabeled video,” inAdvances in
neural information processing systems, 2016, pp. 892–900.
[7] A. Singh, A. Thakur, P. Rajan, and A. Bhavsar, “A layer-wise score level ensemble framework for acoustic scene classifica-tion,” in2018 26th European Signal Processing Conference
(EUSIPCO). IEEE, 2018, pp. 837–841.
[8] S. Yu and J. C. Principe, “Understanding autoencoders with information theoretic concepts,” Neural Networks, vol. 117, pp. 104–123, 2019.
[9] A. RoyChowdhury, P. Sharma, E. Learned-Miller, and A. Roy, “Reducing duplicate filters in deep neural networks,” inNIPS
workshop on Deep Learning: Bridging Theory and Practice,
vol. 1, 2017.
[10] A. Singh, P. Rajan, and A. Bhavsar, “Deep hidden analysis: A statistical framework to prune feature maps,” inICASSP 2019-2019 IEEE International Conference on Acoustics, Speech
and Signal Processing (ICASSP). IEEE, 2019, pp. 820–824.
[11] C. Kroos, O. Bones, Y. Cao, L. Harris, P. J. Jackson, W. J. Davies, W. Wang, T. J. Cox, and M. D. Plumbley, “Gener-alisation in environmental sound classification: the making sense of sounds data set and challenge,” inICASSP 2019-2019 IEEE International Conference on Acoustics, Speech and
Sig-nal Processing (ICASSP). IEEE, 2019, pp. 8082–8086.
[12] A. Mesaros, T. Heittola, and T. Virtanen, “A multi-device dataset for urban acoustic scene classification,” inProceedings of the Detection and Classification of Acoustic Scenes and
Events 2018 Workshop (DCASE2018), November 2018, pp.