Automatic Speech Emotion Recognition
-
Feature space
Dimensionality and Classification Challenges
By
Abdulbasit Kamil Faeq Al-Talabani
Department of Applied Computing
University of Buckingham
United Kingdom
A thesis
submitted for the degree of Doctor of philosophy in Applied
Computing to the school of science in the University of
Buckingham.
i
Abstract
In the last decade, research in Speech Emotion Recognition (SER) has become a major endeavour in Human Computer Interaction (HCI), and speech processing. Accurate SER is essential for many applications, like assessing customer satisfaction with quality of services, and detecting/assessing emotional state of children in care. The large number of studies published on SER reflects the demand for its use. The main concern of this thesis is the investigation of SER from a pattern recognition and machine learning points of view. In particular, we aim to identify appropriate mathematical models of SER and examine the process of designing automatic emotion recognition schemes. There are major challenges to automatic SER including ambiguity about the list/definition of emotions, the lack of agreement on a manageable set of uncorrelated speech-based emotion relevant features, and the difficulty of collected emotion-related datasets under natural circumstances. We shall initiate our work by dealing with the identification of appropriate sets of emotion-related features/attributes extractible from speech signals as considered from psychological and computational points of views. We shall investigate the use of pattern-recognition approaches to remove redundancies and achieve compactification of digital representation of the extracted data with minimal loss of information. The thesis will include the design of new or complement existing SER schemes and conduct large sets of experiments to empirically test their performances on different databases, identify advantages, and shortcomings of using speech alone for emotion recognition.
Existing SER studies seem to deal with the ambiguity/dis-agreement on a “limited” number of emotion-related features by expanding the list from the same speech signal source/sites and apply various feature selection procedures as a mean of reducing redundancies. Attempts are made to discover more relevant features to emotion from speech. One of our investigations focuses on proposing a newly sets of features for SER, extracted from Linear Predictive (LP)-residual speech. We shall demonstrate the usefulness of the proposed relatively small set of features by testing the performance of an SER scheme that is based on fusing our set of features with the existing set of thousands of features using common machine learning schemes of Support Vector Machine (SVM) and Artificial Neural Network (ANN).
ii
The challenge of growing dimensionality of SER feature space and its impact on increased model complexity is another major focus of our research project. By studying the pros and cons of the commonly used feature selection approaches, we argued in favour of meta-feature selection and developed various methods in this direction, not only to reduce dimension, but also to adapt and de-correlate emotional feature spaces for improved SER model recognition accuracy. We used Principal Component Analysis (PCA) and proposed Data Independent PCA (DIPCA) by training on independent emotional and non-emotional datasets. The DIPCA projections, especially when extracted from speech data coloured with different emotions or from Neutral speech data, had comparable capability to the PCA in terms of SER performance. Another adopted approach in this thesis for dimension reduction is the Random Projection (RP) matrices, independent of training data. We have shown that some versions of RP with SVM classifier can offer an adaptation space for Speaker Independent SER that avoid over-fitting and hence improves recognition accuracy. Using PCA trained on a set of data, while testing on emotional data features, has significant implication for machine learning in general.
The thesis other major contribution focuses on the classification aspects of SER. We investigate the drawbacks of the well-known SVM classifier when applied to a pre-processed data by PCA and RP. We shall demonstrate the advantages of using the Linear Discriminant Classifier (LDC) instead especially for PCA de-correlated meta-features. We initiated a variety of LDC-based ensembles classification, to test performance of scheme using a new form of bagging different subsets of meta-feature subsets extracted by PCA with encouraging results.
The experiments conducted were applied on two benchmark datasets (Emo-Berlin and FAU-Aibo), and an in-house dataset in the Kurdish language. Recognition accuracy achieved by are significantly higher than the state of art results on all datasets. The results, however, revealed a difficult challenge in the form of persisting wide gap in accuracy over different datasets, which cannot be explained entirely by the differences between the natures of the datasets. We conducted various pilot studies that were based on various visualizations of the confusion matrices for the “difficult” databases to build multi-level SER schemes. These studies provide initial evidences to the presence of more than one “emotion” in the same portion of speech. A possible solution may be through presenting recognition accuracy in a score-based
iii
measurement like the spider chart. Such an approach may also reveal the presence of Doddington zoo phenomena in SER.
iv
Acknowledgement
I would like to express my sincere gratitude to my supervisors Prof. Sabah Jassim and Dr. Harin Sellahewa for the continuous support of my Ph.D study, for their patience, motivation, and immense knowledge. Their guidance helped me in all the time of research and writing of this thesis.
My sincere thanks also goes to the whole staff and researcher students at the University of Buckingham who provided me an opportunity to join many valuable stimulating discussions.
I would like to thank my family: my wife and to my sister and brothers for supporting me spiritually throughout writing this thesis and my life in general.
v
Contents
Abstract ... i
Acknowledgement... iv
Contents ... v
List of Abbreviation ... viii
List of Figures ... x
List of Tables... x
1. Chapter One Introduction ... 1
1.1 Speech based emotion recognition applications ... 2
1.2 Challenges of SER ... 3
1.3 SER as a pattern recognition task... 6
1.4 Contributions of this thesis ... 8
1.5 List of publications ... 10
1.6 Thesis Organization ... 10
2. Chapter Two Emotion and speech signal features ... 12
2.1 How psychologists view human emotion? ... 12
2.1.1 Emotion categories and dimensions ... 13
2.1.2 Discrete emotion model ... 15
2.2 Emotional Speech Data Collection ... 16
2.2.1 Historical review of emotional databases ... 18
2.2.2 Shortcoming of emotional databases ... 20
2.2.3 Cultural influence on emotion ... 21
2.3 Acoustic Feature extraction for SER... 21
2.3.1 Prosodic features ... 22
2.3.2 Spectral Features ... 25
2.3.3 Voice quality features ... 28
vi
2.4 Emotion relevant speech features... 31
2.5 Summary ... 34
3. Chapter Three Feature Pre-processing and Classification ... 35
3.1 Pre-processing methods ... 35
3.1.1 Feature selection... 36
3.1.2 Meta-feature selection ... 37
3.2 Classification and validation ... 44
3.2.2 Linear Discriminant Classifier (LDC) ... 46
3.2.3 Artificial Neural Network (ANN) ... 47
3.2.4 Ensembles ... 48
3.2.5 Validation Protocols ... 49
3.3 Related works on feature Pre-processing in SER ... 50
3.4 Related Works to emotion classification ... 52
3.5 Summary ... 54
4. Chapter Four Excitation source features for SER ... 55
4.1 Introduction ... 56
4.2 LP-residual signal proposed features ... 57
4.3 Low Level Descriptors LLDs... 60
4.4 The Speech Emotion Recognition (SER) model ... 61
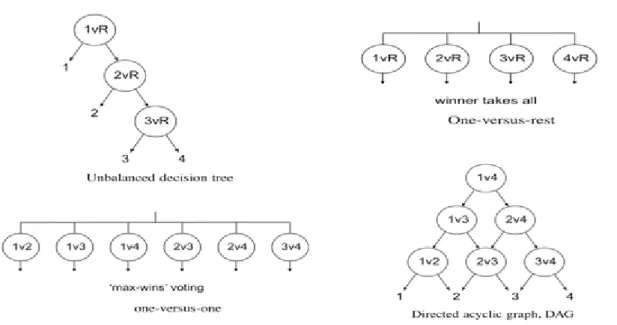
4.4.1 Multi-class SVM and ANN Models ... 61
4.4.2 A Fusion model ... 63
4.5 Experimental Work ... 64
4.5.1 The experimental Datasets and related challenges... 64
4.5.2 Results and discussion ... 67
4.5.3 Comparison with state of the art studies ... 73
4.6 Conclusion ... 74
vii
5.1 Introduction ... 75
5.2 Feature selection using doubly regularized SVM (DrSVM) ... 79
5.2.1 The DrSMV classifier ... 80
5.2.2 Experimental Results and discussion ... 81
5.3 Principal Component Analysis (PCA) ... 83
5.3.1 PCA limitation when number of samples is small ... 83
5.3.2 Data Independent PCA (DIPCA) ... 84
5.3.3 Random projection (RP) ... 85
5.3.4 RP and DIPCA space adaptation... 87
5.3.5 RP and Kernel Functions ... 88
5.4 SER using meta-feature selection. ... 89
5.4.1 Result and discussion ... 89
5.4.2 Comparison to state of the art studies ... 94
5.5 Conclusion ... 96
6. Chapter Six Classifications and Ensembles for SER ... 98
6.1 SVM drawbacks ... 98
6.2 The Linear Discriminant Analysis (LDA) ... 101
6.3 SER using LDC Classifier ... 103
6.3.1 Results and discussion ... 103
6.4 Ensemble classification ... 105
6.4.1 Result and Discussion ... 107
6.4.2 Multilevel SER system ... 109
6.5 Towards emotional content browsing in speech ... 113
6.6 Conclusion ... 117
7. Chapter Seven Conclusion ... 119
viii
List of Abbreviation
Abbreviation Description
AERR Average Emotion Recognition Rate ANN Artificial Neural Network
AUC Area Under Curve
BRP Binary Random Projection
CFS Correlation based Feature Selection
CM Confusion Matrix
CS Compressive Sensing DAG Directed Acyclic Graph DEA De-noising Auto-encoder
DIPCA Data Independent Principal Component Analysis DrSVM Doubly regularized SVM
EEG electroencephalogram EER Equal Error Rates
ES Excitation Source features F0 Fundamental frequency FT Fourier transform
GR Gaussian Random
HCI Human Computer Interaction HOG Histogram of Oriented Gradients i.i.d. Independent and identically distributed ISVM Iterative SVM
IW Importance Weight
k-NN k-Nearest Neighbour
l1-SVM l1 norm within SVM
LDA Linear Discriminant Analysis LDC Linear Discriminant Classifier LLD Low Level Descriptors
LOO Leave One Out
LOSO Leave One Speaker Out LP Linear Predictive
LPCC Linear Predictive Cypstrum Coefficient MC Multi-level Classifier
MER Music Emotion Recognition
MFCC Mel Frequency Cypstrum Coefficient MOS Mean Opinion Score
MSE Mean Square Error
NDMS Non-metric Multi-Dimensional Scaling NP No-deterministic Polynomial-time
ix
OVA One Versus All
OVO One Versus One
PCA Principal Component Analysis PVQ P models Versus Q models RBF Radial Basis Function RFS Random Feature Selection RIP Restricted Isometric Property ROC Receiver Operating Characteristic
RP Random Projection
RRIP Random Restricted Isometric Projection SBS Sequential Backward Selection
SD Speaker Dependent
SER Speech Emotion Recognition
SFFS Sequential Floating Feature Selection SFS Sequential Forward Selection
SI Speaker Independent
SMO Sequential Minimal Optimization
SMOTE Synthetic Minority Over-sampling Technique SN Speaker Normalisation
SVM Support Vector Machine
Tn Toeplitz
UAR Un-weighted Average Recall UDT Unbalanced Decision Tree WAR Weighted Average Recall
x
List of Figures
Figure 1-1: Number of publications on SER from 1990-2014 ... 2
Figure 1-2: Pattern Recognition Steps ... 7
Figure 1-3: Fusion at classification level ... 8
Figure 2-1: Arousal and valence dimensions in emotion representing. ... 14
Figure 2-2: The percentage of emotions from 32 datasets collected in (Koolagudi & Rao, 2012b) ... 20
Figure 2-3: The percentage of dataset types from 32 datasets collected in (Koolagudi & Rao, 2012b) ... 20
Figure 2-4: Example of features used to describe a pitch contour (Buckow, et al., 1999) ... 24
Figure 2-5: Section of speech waveform with short-time energy and zero-crossing rate superimposed... 24
Figure 2-6: simulation of the vocal tract tube. ... 26
Figure 2-7: Speech Production model ... 27
Figure 2-8: Filter of Generating estimated speech signal from Linear Predictive coefficients ... 30
Figure 3-1: A diagram of wrapper feature selection procedure. ... 36
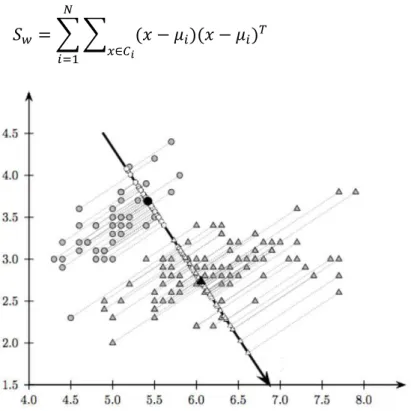
Figure 3-2: The Principal component x’ represent the direction where data has high variance. ... 39
Figure 3-3: Linear Discriminant Directions ... 40
Figure 3-4: (a) Separated classes (b) overlapped classes ... 46
Figure 3-5: An example of Neural Network topology. ... 47
Figure 3-6: 3DEC scheme for five-class Aibo-Ohm database. Key: N-neutral; A-Angry; E-emphatic; P-positive; R-rest. ... 54
Figure 4-1: The spectrum of LP-residual signal of an emotional sentence... 58
Figure 4-2: LPCC of LP-residual function ... 59
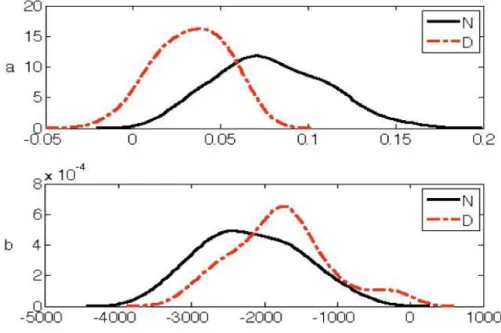
Figure 4-3: (a) the density distribution of 2nd MFCC’s mean of the LP- residual for Neutral and disgust. (b) The density distribution of 2nd MFCC’s mean of the original signal for Neutral and Disgust emotional samples from Emo-Berlin database. ... 60
xi
Figure 4-5: Fusing the SVM and ANN, for 3 classes, (Sc) is a score produced from the ratio of the number of correct decision to (c-1), where c is the number of classes (3 in this example). w_OPSVM and w_OPANN are the LOSO based validated weights for OP feature when applied to SVM and ANN classifier respectively. While, w_ESSVM and w_ESSVM are the LOSO based validated weights for ES
feature when applied to SVM and ANN classifier respectively. ... 64
Figure 4-6: interspeech09 Challenge accuracy achievement including ten different works in addition to the majority voting of all of them (M.V.) (Schuller et al. 2011b). The last bar represents the result obtained in this chapter. ... 73
Figure 5-1: random data projected onto a Gaussian RP and Binary RP. ... 86
Figure 5-2: Example of data transforming to be linearly separated. ... 89
Figure 5-3: UAR for Emo-Berlin database, using different projection matrices ... 91
Figure 5-4: UAR for the Kurdish database, using different projection matrices ... 92
Figure 5-5: UAR for FAU-Aibo database, using different projection matrices ... 92
Figure 5-6: WAR_in &out using BRP and PCA applied on Emo-Berlin dataset. ... 93
Figure 5-7: WAR_in &out using BRP and PCA applied on the Kurdish database ... 94
Figure 5-8: WAR_in &out using BRP and PCA applied on FAU Aibo dataset. ... 94
Figure 6-1: Recognition accuracy of Emo-Berlin using PCA pre-processing followed by LDA ... 101
Figure 6-2: Recognition accuracy of The Kurdish using PCA pre-processing followed by LDA ... 102
Figure 6-3: Recognition accuracy of FAU-Aibo database using PCA pre-processing followed by LDA. ... 102
Figure 6-4: Meta-feature subsets using PCA fused with LDC classifier ... 107
Figure 6-5: NMDS for Emo-Berlin dataset. ... 111
Figure 6-6: NMDS for the Kurdish dataset. ... 112
Figure 6-7: NMDS for FAU Aibo dataset... 112
Figure 6-8: Spider Chart of one sample from each dataset ... 115
xii
List of Tables
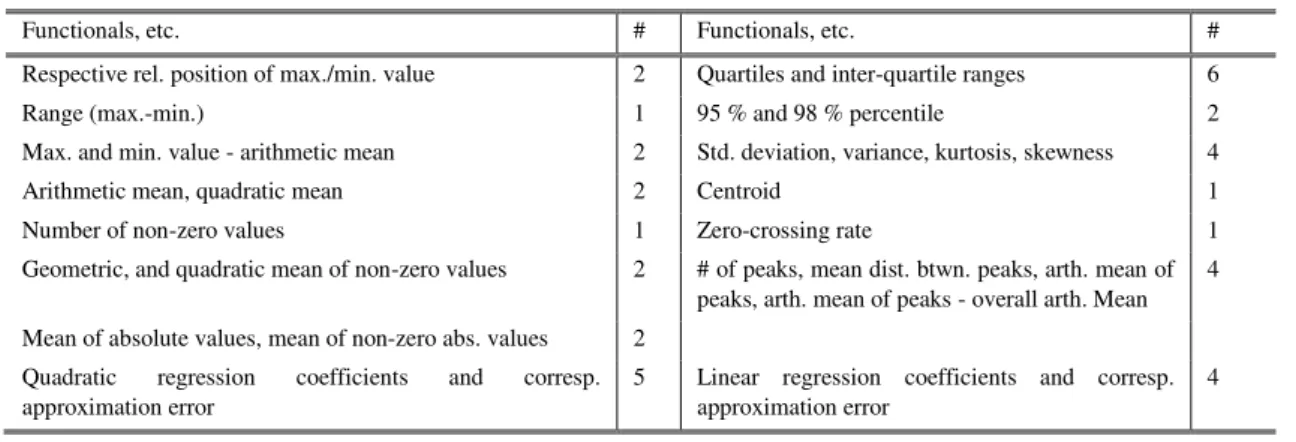
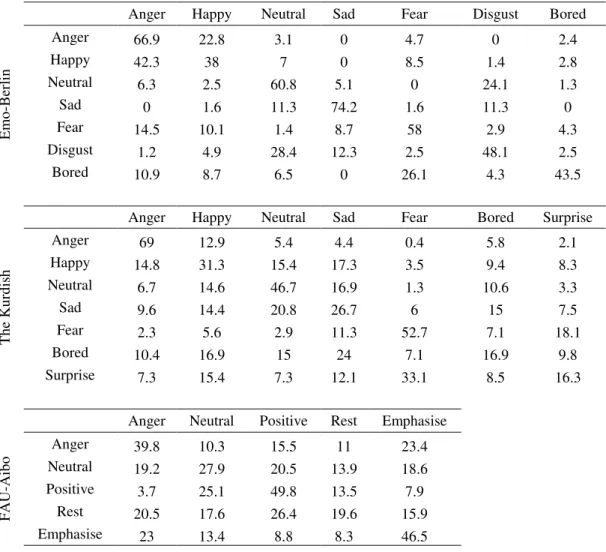
Table 2-1: A Selection of Lists of "Basic" Emotions (Ortony & Turner, 1990)... 15 Table 2-2: Geographic distribution of participants in the eNTERFACE database (Martin, et al., 2006) ... 20 Table 4-1: (33) Low Level Descriptor (LLD) used in Acoustic analysis with Open Ear ... 61 Table 4-2: (39) functionals and regressions coefficient applied to the LLD contour. 61 Table 4-3: SER accuracy rates, numbers in brackets are the fusion weights, Note that the number of categories a 7 for both Kurdish and Emo-Berlin dataset, while just 5 categories are available in Aibo dataset. ... 68 Table 4-4: Confusion matrix for Emo-Berlin, the Kurdish, and FAU-Aibo database for fusion scheme with best Average Recall. ... 71 Table 4-5: Confusion matrix for Emo-Berlin, the Kurdish, and FAU-Aibo database for ES scheme with best Average Recall. ... 72 Table 5-1: Number of samples needed to estimate the kernel function in high dimensions (Silverman, 1986; Webb, 2002) ... 77 Table 5-2: SER model result using SVM fed by OP feature and the DrSVM ... 82 Table 5-3: Confusion matrix of SER using DrSVM. ... 82 Table 5-4: Evaluated number of dimension and there relevant recognition accuracy (a: Emo-Berlin database. b: Kurdish database. c: FAU-Aibo database. LOSO in a. and b. while in c. the interspeech09 challenge standard is followed. The symbol (*) refers to the standard deviation of the experiments over 30 different version of RP matrix. a: Emo-Berlin ... 92 Table 5-5: Confusion matrices of SER model using BRP+SVM ... 95 Table 5-6: A comparison of what achieved in chapter 4& 5 with the State-of-Art (SOA) methods. ... 96 Table 6-1: Meta-feature techniques using LDC for Emo- Berlin database ... 103 Table 6-2: Meta-feature techniques using LDC for Kurdish database ... 103 Table 6-3: Recognition accuracy of Ens1, Ens2 and Ens3. MV refers to fusion at decision, and Sc to fusion at the Score level, while µ and σ refers to the average accuracy of 10 repetitions of experiments. ... 108 Table 6-4: Sets of validated weights per datasets in Ens3. ... 109
xiii
Table 6-5: Confusion matrix of the result obtained by Ens3. ... 110 Table 6-6: Multi level Classifier & Ens3 accuracy rate comparison with state of the art results ... 112 Table 6-7: UAR, AUC for ROC curve for individual emotion vs. all, in Emo-Berlin database ... 116 Table 6-8: UAR, AUC for ROC curve for individual emotion vs. all, in FAU-Aibo database ... 117 Table 6-9: UAR, AUC for ROC curve for individual emotion vs. all, in Kurdish database ... 117
1
1.
Chapter One
Introduction
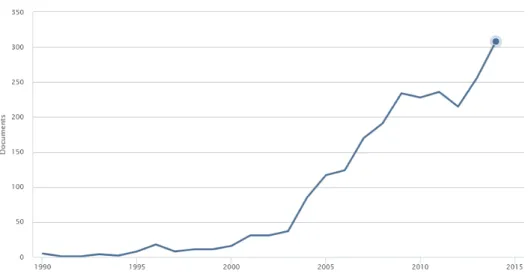
Speech is an important way for people to communicate with one another, and emotion in speech can change the meaning of sentences as perceived by others, and the intentions of the speaker. Spoken text can have several different meanings, depending on how it is said. For example, with the word “really” in English, a speaker can ask a question, express either admiration or disbelief, or make a definitive statement. An understanding of text alone cannot always successfully interpret the meaning of a spoken utterance. Emotion modulates the choice of words and the tone of voice in speech as well as in many other human modes of interaction with other humans and/or computers. Designing automatic systems that have the ability of recognize emotion automatically is deemed to be useful for many applications including in healthcare settings and Human Computer Interaction (HCI). Speech Emotion Recognition (SER) is no longer a side issue. In the last decade, research in SER has become a major endeavour in HCI and in speech processing. The large number of studies published with regard to SER reflects the demand for its use (see Figure 1-1). The main concern of this thesis is the investigation of the ability to recognise emotions within speech from a pattern recognition point of view. In particular, the aim is to design automatic emotion recognition schemes, test their performance in terms of different databases, and identify the advantages and shortcomings of using speech alone for emotion recognition. Our investigations focuses mainly on emotion-related feature extraction from speech, and the use of different classifiers and their fusion. One ultimate objective is to determine the contribution of speech to the emotional state of speakers.
In section (1.1) of this chapter we will focus on the some application regarding SER. The chapter will also present the challenges faced by SER as a pattern recognition task in sections (1.2) and (1.3). The contribution of the thesis is presented in section (1.4) followed by the publications related to this thesis in section (1.5), and finally the organisation of the thesis is shown in section (1.6).
2
Figure 1-1: Number of publications on SER from 1990-2014
1.1
Speech based emotion recognition applications
Studying the emotional state of speakers from their speech signals has emerged as one of the most important areas of speech research. Any speech system can be made more effective by incorporating emotion processing/analysis (Koolagudi & Rao, 2012b). Knowledge of the emotional state of a speaker helps the listener/system understand the meaning of a message. For example, speech recognition systems that are designed to assess stressed-speech in aircraft cockpits have been found to achieve better performance than traditional emotion-ignoring speech recognition systems (Hansen & Cairns, 1995).
We recognize that speech is only one of many modes of interaction with regard to human beings interacting with one another and with machines that are modulated by emotional states. Moreover the expression of emotion is influenced by many factors including culture, personal experience, and by mental health state. Consequently, one cannot expect SER to be other than of limited success in most cases. However, in many applications, speech is the only available mode of interaction, and consequently modestly accurate SER can benefit such applications. For example, customers care interaction systems that assess customer’s satisfaction and quality of service. It is also helpful in fostering interaction systems, which aim to detect a child’s emotional state (Lee , et al., 2011). Another, possible application of SER is hostage negotiation standoffs where speech is most likely to be the only available mode of communication. Building a dialogue system for natural speech is becoming an interesting area of research that could benefit from SER. Most existing applications with regard to automatic dialogue systems are reported to be restricted
3
to using binary responses (i.e. ‘yes’ and ‘no’), or designed for a specific area with a limited vocabulary. Consequently, responding in a more “natural” way to different form of emotional speech is still a serious challenge and one for which there is an ongoing demand1 (Steidl, 2009).
In healthcare, people with anxiety, depression, and stress are frequently asked by psychologists to record their mood changes throughout the day. An application called Xpression, developed by U.K.-based EI Technologies, helps such people by sending a block of 200ms speech voice to the designed server to detect the embedded emotion and then report the changes in their mood to a psychologist every day2. SER is also used to help hearing-impaired people to speak naturally by designing a system, which can tell the users about their speech state. This system is able to train the user to improve his/her skills in terms of natural speech (Pao , et al., 2005). Accurate identification of a patient’s emotional state is also reported to be necessary for psychotherapists (Paulo , et al., 1999); consequently, it is suggested that an emotion recognition framework be integrated into a speech therapist system in (Schipor , et al., 2011). A content delivery system can also benefit from tracking emotional information contained in the objects (video, music) to improve the delivery quality (Malandrakis , et al., 2011). The effect of emotion recognition and regulation on intercultural adjustment is discussed in a study, which used different groups of students from different cultural environments studying at US universities. The study found that emotional recognition has an independent effect on intercultural adjustment (Yoo, et al., 2006). Such a high number of applications encourage further study to improve the performance of SER.
1.2
Challenges of SER
Raw speech signals captured by a microphone over a period of time are represented by a 1-dimentional waveform consisting of different frequencies, the contributions of which vary over time. Different frequency domain transforms can be used to obtain the frequency domain representation of the signal at multiple scales, but identifying the speaker’s emotional state from temporal domain or frequency domain representations is a challenge that has attracted research scientists from different
1
A comprehensive discussion on some real challenges facing automatic call responding system is presented in (Steidl, 2009) pp. 1-3
2
4
disciplines. Variation in voice tones, as well as internal physiological changes while uttering a sentence (or even a single word), combine to generate the speaker’s emotional state. The speech signal, even when uttering a particular word, is affected by external factors such as gender, age, culture and health. In other words, the speech signal contributes to the speaker’s emotional state, but cannot singularly discriminate emotions. The first challenge is to identify emotion-relevant features that can be extracted from the raw signal or from its frequency domain. This challenge remains an active area of research and debate.
Many recent studies have observed that emotion-related information in speech is spread along different kinds of features. This could be due to acoustic variability as a consequence of the existence of different sentences, speakers, speaking styles, and speaking rates (El Ayadi , et al., 2011). Although the number of investigated features has been growing, there are still efforts being made to explore emotion-relevant features from new sites of the speech signal. Chapter four of this thesis focuses on suggesting a new set of features for SER use. The features are extracted from the Linear Predicted (LP)-residual signal.
Researchers have adopted large feature set (thousands), whether directly as in (Hassan & Damper, 2012; Schuller, et al., 2009b), and/or followed by feature selection steps such as are used in (Batliner , et al., 2011). Feature selection applied to high dimensional data is costly and complicated due to the complexity of the optimization that targets a suitable feature subset among a high number of features, especially when using the wrapper methods. Unlike the wrapper feature selection methods, filter based feature selection is not based on classification decision, but on some data characteristics such as correlation or entropy. Filters are reported to be more convenient for high dimensional data (Yu & Liu, 2003). However filter-based feature selection methods are not necessarily suitable for all classifiers, and feature selection cut off points could lead the system to ignore some “important” information included in the non-selected features.
The features can also be selected in a transformed space. Transforming the data in the feature space into another subspace is usually based on a specific transformation map, which aims to help in features de-correlating, samples classifying, or at least reducing dimensions. The new selected features in the transformed space could be
5
referred to as a meta-feature. However, the extraction of the meta-feature is difficult to provide meaning about the more suitable original features, which leads to them being avoided by the studies that target emotional analysis.
Recently, there have been promising efforts in terms of finding various approaches for interpreting meta-features. For instance Simmons et al. (Simmons, et al., 2015) propose a hybrid approach that uses a mutual information-based statistic to have a biologically meaningful interpretation for the Principal Component Analysis (PCA) output. These studies are encouraging further investigation on the use of meta-features for SER. However this thesis is not focussing on meta-feature interpretation, but rather in chapter five the extraction and selection of meta-features is investigated. We shall see how a limited number of the meta-features of emotional speech shows an ability to exploit the information spread in a large set of features.
Beside the challenges related to appropriate SER feature vector representation and extraction, testing the performance of any developed SER scheme faces another serious obstacle. Like any pattern-recognition task, developing and testing the performance of emotion classification schemes needs access to a sufficiently large dataset of feature vectors that are accurately labelled by their emotions or emotion-related states. Creating such databases of speech signals assumes that the collected data do represent real life emotional speech, and can be easily labelled by human experts. This is a tough challenge that has frequently been discussed, questioned, and researched. The traditional method of data collection started with gathering acted emotion data (Batliner , et al., 2011). These data are normally designed by asking actors to repeatedly express different specific emotions, and suppress all other emotions, while uttering the same sentences chosen from a well-selected set of texts. The reliability of the emotional labels is dependent on how good and skilful the actors are. However, the concern is about the extent to which the data is a good representation of real life emotions. For this purpose, trying to collect “natural” emotional data requires repeated recorded speeches of subjects while expressing specific emotions without being aware of the recording. However, this approach might have serious ethical implications. Consequently, researchers have attempted to create non-acted databases by collecting non-prompted data (Steidl, 2009). Capturing the “natural” emotional speech portions and then labelling them in terms of their emotion is challenging. For instance, in designing the FAU-Aibo database, children
6
were convinced that they were controlling a pet robot by their speech instructions, while in reality the robot pet was controlled by a special wizard. Consequently, obeying or disobeying the children resulted in emotional speech states, which were recorded and then labelled to emotional-related states based on the decision of five experts. However such a design still suffers from producing a monologue instead of a dialogue (Schuller, et al., 2011b).
SER accuracy is significantly different from one database to another, due to the design (acted, elicited, or non-acted), the speaker factor (gender and\or age), and the purpose of creating the dataset (analysis, synthesis, recognition). Therefore the recognition performance of a SER system achieves comparable accuracy rate to human raters in subjective listening tests (Vogt , et al., 2008).
Perfect recognition of emotion is not easy even by humans when listening to one another; sometimes the human cannot recognize his own innermost emotion. In fact, some aspects of internal feelings remain hidden and do not appear in the speech, especially when the speaker likes to do that. Therefore, a computer-based system cannot do beyond what is observed from the speech sample input (Picard , et al., 2001).
In this thesis we have tested our developed schemes both on acted and non-acted databases, including an in-house acted database, and we shall attempt to measure and explain the expected discrepancy in accuracy rates achieved by the two types.
1.3
SER as a pattern recognition task
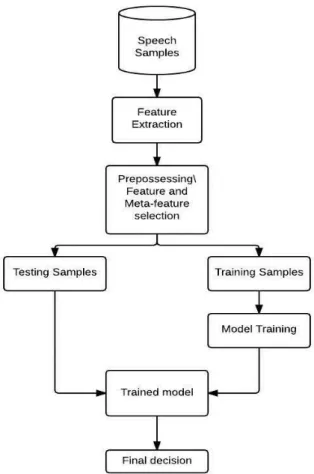
SER follows the same steps of pattern recognition (Figure 1-2), starting with pre-processing the input data by extracting and selecting suitable features, followed by the classification step. The classification techniques have a clear impact on the model’s complexity and performance. Some classifiers are well known in improving model performance such as the Support Vector Machine (SVM), but in contrast, the SVM’s complexity may be considered as a serious disadvantage for some applications. Some other classifiers are simple in terms of computation and implementation, but may not perform well every time like the k-Nearest Neighbour (k-NN), and Linear Discriminant Classifier (LDC), especially in the case of a high
7
Figure 1-2: Pattern Recognition Steps
dimensional data. However, judgments that are based on performance and complexity cannot be generalized everywhere, because the classification models’ characteristics are not completely independent of the previous steps, including feature extraction and selection. For example, LDC draws cluster borders based on a multivariate Gaussian distribution of the data belonging to that cluster, and performs well when applied to de-correlated data. Feature selection techniques, which are able to provide a de-correlated subset of attributes, are more appropriatefor classification methods like the LDC, like the meta-feature selected by PCA. Therefore it is shown in Chapter Six how PCA with LDC scheme can outperform other schemes like the PCA with SVM. The performance of any pattern recognition task can be improved by the fusion of more than one model, whether in terms of the score level or the classification level. The decision of the models can be weighted to highlight the influence of some models over others as in Figure 1-3. In emotion recognition, a speaker-independent classification is more applicable. And mainly the researchers adopt the Leave One Speaker Out (LOSO) cross validation approach.
8
Figure 1-3: Fusion at classification level
In this thesis we investigate and compare the performance of various classifiers and various fusion schemes in terms of accuracy rates. However, we shall also investigate the pattern of performance of such classifiers for different feature selection and feature reduction schemes.
1.4
Contributions of this thesis
This thesis aims to investigate major issues regarding emotion recognition in speech, especially developing and testing the performance of a number of SER schemes. We shall use innovative approaches to feature extraction, feature selection and reduction, and classifiers.
We started by investigating new sites within the speech signal to extract features relevant to emotion. In Chapter Four, a set of features, which are extracted from the LP-residual signal, is suggested for emotion recognition. These features include:
1. Mel Frequency Cypstrum Coefficient (MFCC) of the LP-residual signal. 2. Linear Predictive Cypstrum Coefficient (LPCC) of the LP-residual signal,
and
3. Wavelet Octave Coefficients of Residual (WOCOR).
These sets of features are used for speaker recognition, but are not used in emotion recognition. The suggested features show the ability to improve the accuracy of recognition when fused with a large number of emotional features (6,652) extracted by OpenEar software (Eyben, et al., 2009).
9
In this thesis we also investigate the controversy about a small size feature set relative to emotion, and consequently suggest the use of a large number of features in SER studies. Meta-feature extraction and selection is proposed in this thesis as a solution to avoid the curse ofdimensionality, including the use of Data Independent PCA (DIPCA), where PC projection is computed by data samples independent from the samples involved in training the classification, and the random projections that are based on compliance with the new innovative paradigm of Compressive Sensing (CS). These techniques also avoid model complexity without affecting performance. We suggest a number of CS-compliant Random Projection (RP) matrices for transforming data into a meta-feature space instead of PCA. The advantage of RP matrices over PCA is their non-adaptive nature (i.e. the independence of the data used for model training), which results in significantly lower computational costs. The investigation presented in Chapter Five shows how the RP can be used for emotional space adaptation from speaker influence, together with an SVM classifier. However the SVM have some serious drawbacks, including the need for balancing the number of samples for each pair of classes, and building a set of machines for multi-class models, as well as high computation cost. An alternative classifier is investigated in Chapter Six using the fact that the de-correlated meta-features generated from a high dimensional feature space using PCA is suitable for classification, based on normal multivariate distribution. Therefore LDC using pooled estimated covariance for data pre-processed by PCA outperforms the well-known SVM classifier and the state of the art results.
We have also proposed an ensemble classification model that extracts meta-feature subsets using PCA with “well-selected” weights and have resulted in improved recognition accuracy. For further improving the performance of the SER scheme, we designed a multi-level classification by combining some of the confused classes. The confused classes have been detected using confusion matrices and a Non metric Multi-Dimensional Scaling (NDMS) that visualize the similarities between classes. A comparison with what we are aware of state of the art schemes shows that most of the models suggested in this thesis outperform state of the art models in terms of model performance.
A score-based classification has been used to show that the speech sentences somehow encapsulate a mixture of emotions, such that the same speech sample can
10
reveal different emotions. Classifying speech samples confidently is rarely found in non-acted datasets, and stronger in the professionally acted datasets, especially in the case of datasets that are designed for analysis or synthesis and not for recognition purposes such as the EMO-Berlin dataset. This thesis investigates the presence of more than one emotion in an individual speech sample.
1.5
List of publications
Currently a part of this thesis is presented in two publications:
1. An article submitted to Computer Science and Electronic Engineering Conference (CEEC) 2013, entitled “Excitation source and low level descriptor features fusion for emotion recognition using SVM and ANN”.
The details of the contribution of the publication are presented in Chapter Four.
2. An article submitted to the SPIE 9497, Mobile Multimedia/Image Processing, Security, and Applications 2015 conference, entitled “Emotion Recognition in Speech: Tools and Challenges”.
1.6
Thesis Organization
The thesis includes seven chapters starting with the introduction in Chapter One followed by a background on emotion from a psychological point of view, and the common features extracted from speech signals in Chapter Two. A literature review on emotional datasets and speech features used for SER is also available in two different sections in Chapter Two. In Chapter Three, feature pre-processing techniques are presented, together with the classification methods used. Research regarding feature pre-processing and classification are also reviewed in Chapter Three.
The first contribution of this thesis regarding features extracted from the LP-residual samples is presented in Chapter Four. This is followed by the investigation of meta-feature extraction and selection using different forms of PCA and RP using SVM classifier in Chapter Five. In Chapter Six the use of an LDC classifier is investigated to overcome some of drawbacks of SVM. The data is also pre-processed by some forms of the PCA and RPs. Meta-features subsets extracted by PCA is also fused in this chapter to improve recognition performance, in which the assumption of the
11
availability of a mixture of emotion in the same portion of speech is studied. Finally the conclusion of the whole thesis is come in the last chapter.
12
2.
Chapter Two
Emotion and speech signal features
Emotion is known to modulate a variety of human-machine modes of interaction. Audio-visual modes including speech and facial expression are among the most commonly researched modes of interaction for detection and identification of emotions. Other detectable emotion-related signals include hand and body gesture as well as internal physiological changes. In this thesis the focus is on using speech alone for the detection and recognition of emotion.
SER (Speech Emotion Recognition) is based on two major aspects, the first one is the meaning of emotion and the second one is the kind of speech signal features or parameters that could be relevant to emotion in speech. As a pattern recognition task, pre-processing the emotional speech data by extracting and then selecting the suitable features is followed by classification. A background of the feature extraction step is covered in this chapter.
In this chapter a proper description of emotion from a psychology point of view will be presented in the first section (1.1), to understand how it could benefit in designing an automatic emotion recognition system. In order to highlight the difficulties involved in SER, we review the literature on the databases designed for emotion recognition from speech signal in section (1.2). In section (2.3) the most well-known and important types of speech signal features, which are reported to be relevant to emotion is shown. The final section (2.4) will cover a literature review of emotional features extracted from speech signal.
2.1
How psychologists view human emotion?
Understanding the exact meaning/manifestation of emotion is necessary in any emotion related applications. Psychologists conducting research into human emotions need emotional data/samples to be in a format that includes labelling of the samples by accurate emotions. Such needs raise questions like how many emotional categories should be considered, how to collect emotional data, and how to map the variety of emotional categories to manageable lists of labels.
13
Psychological studies are concerned with factors such as identifying the significant and fundamental list of emotions, how and why are they differentiated, and the situations of emotion eliciting. This would have a clear impact on any emotion related application. Understanding the emotion helps in recognizing it, predicting its influence on other behaviour, and controlling it. However, emotion definition is a matter of opinion amongst the psychologists, regarding the root of the emotion, basic and derivative emotions, and other aspects. The “biology versus culture” debates about the root of emotion attracted many researchers. On one side the traditional theory by Darwin claims the emotion to be survival-related pattern that have evolved to help the adaptation with the species environment in the evolution stages; while many anthropologists and social psychologists attacked the Darwin’s theory; as they attributed the emotion to sociocultural factors (Steidl, 2009). In this study we adopt the concept suggested by Schuller et al (Schuller, et al., 2011b), who followed the definition of Cowie, (Cowie, et al., 2001b) that ‘emotion’ is what is “present in most of life but absent when people are emotionless”; this is the concept of pervasive emotion. This concept includes both the prototypical emotions like (anger, happiness…etc.), and what is called emotion-related states, in addition to the all related concepts to emotion like “emotional intelligence”.
2.1.1 Emotion categories and dimensions
In pattern recognition applications, labelling the data to classes is essential. The model will be trained using some samples labelled to what is assumed to be the correct classes. It is obvious that labelling the emotional data depends on the theory behind the emotion and the observer skill. Defining and predicting the number of emotions face serious difficulties amongst the psychologists. However, categorization of emotions can be done in both dimensional and discrete emotion models.
2.1.1.1 Dimensional categorization
Emotions can be distinguished according to some characteristics like: arousal, valence, and dominance. Emotion is possible to be distinguished using one-dimensional or multione-dimensional model.
14 2.1.1.2 Uni-dimensional Model
Some researcher argues about the usefulness and sufficiency of one dimension categorization of emotion. The dimension can be the arousal/excitation (low to high), or the valence (unpleasant to pleasant). The valence dimension is reported as the most important representation, which represents the principal of emotion. It is now one of the most accepted criteria for emotion and effect studies (Scherer, 2000). Distinguishing emotions to Positive and Negative is an example of one-dimensional categorization.
2.1.1.3 Multidimensional Model
Emotion are also represented in the literature by a multidimensional model. The suggested dimensions are Pleasantness-unpleasantness (valence), rest-activation (arousal), and relaxation- attention (dominance) (Cowie, et al., 2001b). Multi-dimensional approach provides a theoretical model that could be compatible with the Opponents Processing in Emotion sensing (Solomon , 1980).
Figure 2-1: Arousal and valence dimensions in emotion representing.
Multidimensional representation helps in improving the capability for improved separation between emotions that are close in terms of arousal, valence or dominance. The obvious benefits from using two dimensions relate to the ability of visualizing the differences between emotions in an illustration (see Figure 2.1). In two/three dimensional space the Euclidian distance could also be used to measure the differences (Steidl, 2009). However there is no consensus about the exact needed number of emotions.
15
Table 2-1: A Selection of Lists of "Basic" Emotions (Ortony & Turner, 1990)
Reference Fundamental emotion Basis for inclusion
Arnold (1960) Anger, desire, despair, fear, hate, hope, tendencies love, sadness
aversion, courage, dejection, Relation to action
Ekman, Friesen, & Ellsworth (1982)
Anger, disgust, fear, joy, sadness, surprise
Universal facial expressions
Frijda (personal communication, September 8, 1986)
Desire, happiness, interest, surprise, wonder, sorrow
Forms of action readiness
Gray (1982) Rage and terror, anxiety, joy Hardwired Izard (1971) Anger, contempt, disgust,
distress, fear, guilt, interest, joy, shame, surprise
Hardwired
James (1884) Fear, grief, love, rage Bodily involvement McDougall (1926 Anger, disgust, elation, fear,
subjection, tender-emotion, wonder
Relation to instincts
Mowrer (1960) Pain, pleasure Unlearned emotional states Oatley & Johnson- laird (1987) Anger, disgust, anxiety,
happiness, sadness
Do not require propositional content
Panksepp (1982) Expectancy, fear, rage, panic Hardwired
Plutchik (1980) Acceptance, anger,
anticipation, disgust, joy, fear, sadness, surprise
Relation to adaptive biological processes
Tomkins (1984) Anger, interest, contempt, disgust, distress, fear, joy, shame, surprise
Density of neural firing
Watson (1930) Fear, love, rage Hardwired
Weiner & Graham (1984) Happiness, sadness Attribution independent
2.1.2 Discrete emotion model
Another Model of categorization emotion is to label each individual emotion alone as a single state. Many researcher tries to define basic emotions, which are supposed to be expressed by mammals as a result of many theories mostly extending Darwin’s theory of emotion evolution. Although there is a no agreement about the exact number of basic emotions, the most popular list is the Ekman’s categorization of basic emotions. He regarded Anger, disgust, fear, joy, sadness, and surprise as basic
16
emotions. Table 2-1 shows some other suggestions of the basic emotions. This diverse categorization is a result of the disagreement of understanding the emotion concept itself, and would certainly add to the challenge of automatic emotion recognition. Defining basic emotion is important to explain some routine observation about emotion, which appears in human and some higher animals as well (Ortony & Turner, 1990). However recent studies tend to bypass the use of basic emotions and instead consider the alternative concept of Emotion-related states (Batliner , et al., 2011). In this thesis the investigation will include both basic emotion and emotion-related states.
2.2
Emotional Speech Data Collection
Emotion could be present in (or detected from) different human modes of interaction with the environment and is manifested by expressions in the face, changes in speech tones, gestures, and/or electroencephalogram (EEG). Consequently emotion related datasets are collected by different researchers depending on their choice of interaction mode. For example, face expressions datasets include faces in different expressions (Kanade, et al., 2000), whereas SER datasets are collected from speech, which contain emotional speech samples (Engberg & Hansen, 2007; El Ayadi , et al., 2011). Multi modal datasets is also suggested including face images and speech signals in the form of videos as in (Douglas-Cowie, et al., 2005).
Being focused on speech emotion recognition, the main datasets investigated in this thesis are collected in benchmark databases that contain speech samples for sufficiently large sample of the population. Emotional speech applications use these datasets to train suggested models and/or to analyse the emotional characteristic included in the speech signal. Designing or eliciting an emotional data set, is a serious challenging task for the SER research community, due to difficulty in assessing how a recorded dataset is natural and/or usable. The prompted data is frequently criticized for being difficult to create a natural setup for expressing different emotions (El Ayadi , et al., 2011; Batliner , et al., 2011; Steidl, 2009; Schuller, et al., 2011b). Characteristic differences of detected ranges in contour fundamental frequency and other speech parameters values between real life clear emotion sentences and sentences acted by professional actors is reported by (Williams & Stevens, 1972). The actors are asked to act the emotions included in the
17
pre-designed structure of the data set, which might lead to produce a “full blown” emotions.
Another issue regarding the prompted data is the prototypical approach in fixing the emotion included in the database, which lead to the absent of many available emotions or emotion-related states in the real life. In addition to that the prompted emotional data is not applicable when linguistic features are used, because the adopted texts are somehow predefined and fixed independently of any emotion. Deciding whether the acted recordings are really well representing the emotion or not is another challenge that faces the prompted data. Human examiner (annotators or experts) are used to judge and score emotional samples. Some database designers remove the samples that are not representing the emotion well (Burkhardt, et al., 2005). This kind of sentence selection might also influence the emotional data and raise doubts about the recording being natural. However some of these databases (like DES (Engberg & Hansen, 2007), Emo-Berlin (Burkhardt, et al., 2005), SUSAS (Hansen & Bou-Ghazale , 1997)) were not collected for SER, but for quality measuring of emotional content syntheses. In contrast the prompted data is easier in design, and unlike the non-prompted datasets, number of samples per class is controlled/pre-defined.
The non-prompted data is recorded in an unsupervised environment, which means that the subjects are not directed to express a specific emotion, but they are led to an emotional state, and then the produced emotion is recorded without their knowledge. This kind of data seems to be more ‘realistic’. However, some researchers agreed to call this kind of data as a non-prompted emotional data, instead of name it as spontaneous or natural. (Schuller, et al., 2011b).
Recording non-prompted samples of emotional data also faces many serious challenges. In the non-prompted speech data, some emotion-related states might appear, in which not suggested initially, but rather is likely to be available in the real life. The emotion-related states (like emphasized, rest, positive, etc.) are not necessary to be listed under the prototyped emotion categorization or the basic emotions.
As we discussed above, the number of samples per emotion/class is not pre-defined in the non-prompted data, therefore it depends on emotion related states available in
18
the recordings. Additionally the non-prompted data needs another effort to label the speech samples to each individual emotions or emotion-related states. Experts are usually involved to manage this process. Sometimes some of the emotion-related states appear rarely in the collected data, which encourage mapping the available emotion-related states to less number of classes. For instance (Steidl, 2009) suggests a heuristic approach to map many emotional related-states to less number of categories. State of the art studies encourage the use of the non-prompted data, because it is more realistic and helpful in designing a real life application (Batliner , et al., 2011).
The emotional databases are also different in terms of the target that the dataset is designed for. Some emotional databases are designed infant-directed like the dataset designed by (Slaney & McRoberts, 1998), which collect 500 samples from adults talking to their infants and classified 65% of the samples correctly. More other database is adult-directed as shown in the next section.
2.2.1 Historical review of emotional databases
The history of speech emotional databases started in the late 1990s with few databases but mostly limited in the number of samples (about 500), number of enrolled subjects (about 10), and number of uttered sentences (about 10). For example, the DES database (Engberg & Hansen, 2007), contains 419 speech utterances, expressed by 4 professional actors (2 male and 2 female) who were acting 5 emotions, using 9 different sentences. The emotions that were meant to be expressed by the speakers in this database were anger, happiness, neutral, sadness, and surprise. The recordings are judged by twenty native speakers, whereby 67% are correctly evaluated. The Emo-Berlin database (Burkhardt, et al., 2005), contains studio recording of 10 sentences uttered repeatedly by 10 subjects (5 male and 5 female) who were asked to express 7 emotions (anger, happiness, neutral, sadness, fear, disgust, and bored). There were 20-30 judges participating afterwards in evaluating and labelling the emotion recordings. About 500 out of 800 utterances are evaluated by 20 subjects as appropriate emotional sentences with minimum score of 60%, assignable with minimum of 80%, and correct labelling accuracy rate of 84.3%. The Emo-Berlin database is one of the databases that will be used in this thesis.
19
Expansion of the size of the databases in terms of samples, subjects, and modals, in addition to adding more natural life characteristics to the database is followed in designing the later databases. For example, the eNTERFACE database (Martin, et al., 2006) uses 42 subjects (9 female) and 1227 samples. To add more cultural diversity factors the subjects were chosen from 14 nations (see Table 2-2). Another naturalize attempt in this database was leading the subjects into an emotional situation by preparing them to listen to an emotional story and then they asked to utter five appropriate sentences per each emotion. The emotions induced in this database are anger, disgust, fear, joy, sadness, and surprise.
The first attempt to create a “spontaneous” data set was made through the SUSAS database (Hansen & Bou-Ghazale , 1997), where a predefined set of words captured from English air-commands. A total of 3593 samples under different level of stress are produced. This was followed by the design of a comprehensive spontaneous database, called FAU Aibo database (Batliner, et al., 2008a;Steidl, 2009).
The FAU-Aibo database (Steidl, 2009;Batliner, et al., 2008a), was designed by recording children's sound, which are coloured by different emotion, when they interact with Sony’s pet robot Aibo. The children were led to believe that the robot is responding to their commands, whereas it was actually controlled by a human operator in a Wizard-Of-Oz manner. Five experts labelled each word in the database independently, into 10 categories: angry, touchy, joyful, surprised, bored, helpless, motherese, reprimanding, emphatic, and ‘other’ for the remaining cases. The categories were mapped into four classes: anger, emphatic, neutral, and positive in addition to the fifth class for rest. The Aibo corpus formed the focus of the Interspeech 2009 emotion challenge (Schuller, et al., 2011a). Aibo dataset is one of the datasets that adopted in this thesis, and more details about it will be given in chapter 4.
For further details a comprehensive review on databases can be found in (Schuller, et al., 2009b; El Ayadi , et al., 2011; Koolagudi & Rao, 2012b). Figure 2-2, shows the percentage of number of emotions used in 32 datasets reviewed by (Koolagudi & Rao, 2012b)) while Figure 2-3 shows the number of simulated, elicited, and non-prompted datasets. The number of non-non-prompted datasets is just 25%, and the 2-class datasets is the more present in the available emotional datasets.
20
Table 2-2: Geographic distribution of participants in the eNTERFACE database (Martin, et al., 2006)
Country Number of Subjects Country Number of Subjects
Belgium 9 Cuba 1 Turkey 7 Slovakia 1 France 7 Brazil 1 Spain 6 USA 1 Greece 4 Croatia 1 Italy 1 Canada 1 Austria 1 Russia 1
Figure 2-2: The percentage of emotions from 32 datasets collected in (Koolagudi & Rao, 2012b)
Figure 2-3: The percentage of dataset types from 32 datasets collected in (Koolagudi & Rao, 2012b)
2.2.2 Shortcoming of emotional databases
State of the art studies encourage using non-prompted (spontaneous) data sets due to their similarity to the real life human emotional states. Still the non-prompted data sets have two major problems, which could be taken into account when generating
0 5 10 15 20 2 3 4 5 6 7 not defind % Number of Emotions 0 10 20 30 40 50 60 %
21
emotional data. The first issue is regarding the neutrality of the monolog form of emotional speech that adopted in the available data sets. This shortcoming happens because of the absence of emotion-related state that accompany the dialog conversation. The difficulty of preparing the recording situation for spontaneous emotional dialog conversation is a serious challenge, but necessary to bring the emotional datasets furthermore towards the real life environment.
The second issue is that the universality assumption (albeit implicit) of collected datasets as representing a wide range of cultures presents yet another serious research challenge due to the fact that no existing emotional dataset can claim such another characteristic of existing. In the next section a brief review on some cultural influence on emotion is presented.
2.2.3 Cultural influence on emotion
Some researcher as a consequence of the argument about the linguistic, has studied the influence of culture on emotion expressed by people brought up in different cultures, and culture influence verses the universal characteristic of emotions. Generally, studies report the universality of emotion to some extent. For instance in (Elfenbein & Ambady, 1986) listeners’ ability of recognizing emotions from different cultures, has been claimed to lead recognition accuracy score much higher than the random probability chance of recognition. This kind of claims are used to some extent as an indicator of the universality of emotion in different cultures. In contrast some other studies reported the influence of linguistic prior knowledge that judgers have on the emotional contents. The comprehensive study by Scherer et al. (Scherer, et al., 2001) show that recognition accuracy score of native judgers of German language emotional contents range from 74%- 84%, while Indonesian judgers of the same recording achieved only 52% accuracy. These two seemingly different investigations seems to indicate that the emotional characteristic is universal to some extent, but the linguistic characteristic has also its role in understanding the emotional contents in a text. We believe that this argument needs more investigations to settle this kind of questions.
2.3
Acoustic Feature extraction for SER
Feature extraction is one of the most important steps in pattern recognition (if not the most). In quantitative pattern recognition studies, extracted features are usually used
22
to build a mathematical model governing the variability of these features. Extracting the appropriate SER features reflects the available knowledge about emotion characteristics as well as the influence of the person’s emotional state on the speech signal. In this study we deal with acoustic features of the speech signal that extracted using different approaches.
In general, features are either selected depending on a pre-knowledge based approach or “brute force” approach”. In pre-knowledge based feature extraction, experience plays a role in fixing the number of targeted features to feed the classification model. Practically, the number of features in a pre-knowledge SER system tends to be limited to not more than few hundreds. While in the “brute force” approach, feature extraction aims to cover as much as possible characteristic that the speech signal has, hopping to capture as much as possible information about emotion embedded in the speech signal, although this may result in the presence of redundancies.
The vocal tract system produces speech from a time varying signal with a time varying excitation. Therefore the speech signal is non-stationary in nature, while most signals processing tools assume time invariant system and excitation, i.e. stationary signal. Therefore these tools are not directly useful for speech processing, and mainly short time parameter estimation is more applicable. Therefore, to overcome this issue of non-stationary over a long utterance of speech, it is customary to divide speech signal into frames through which the signal is almost stationary (Rabiner & Schafer, 2007). In the rest of this section a background of feature sites will be covered.
2.3.1 Prosodic features
Prosodic refers to some speech signal characteristics like stress, rhythm, and intonation, which are reported to reflect the emotional states, as well as the intonation of the speaker which change the meaning of sentences forms like question, or command. In this section major prosodic parameters, will be presented.
2.3.1.1 Pitch and fundamental frequency
Although the pitch and fundamental frequency are different in the sense that pitch refers to perceptual characteristic, while fundamental frequency is physical parameter of the speech signal, but there are an agreement about the correlation of both of pitch and fundamental frequency. Fundamental frequency (F0) changes
23
through a spoken sentence, offer information about the intonation and stress happens along spoken words and sentences. F0 is measured in Hertz according to the fundamental period of vocal closure. F0= 1/T, where T is the fundamental period. Due to the non-stationary characteristic of the speech signal F0 is usually computed in the short-term signal. To have more clear view of the changes happen of the F0 along the speech signal sample, F0 envelop parameters (like slope, onset, offset, etc.) is computed, beside other statistics like minimum, maximum, mean, median, etc. of F0 value along the whole signal (Buckow, et al., 1999). Figure (2-4) shows some statistics computed from the pitch contour. In this work we follow the implementation of openEAR toolkit (Eyben, et al., 2009), which use the cepstrum and Autocorrelation based algorithms for F0 computation.
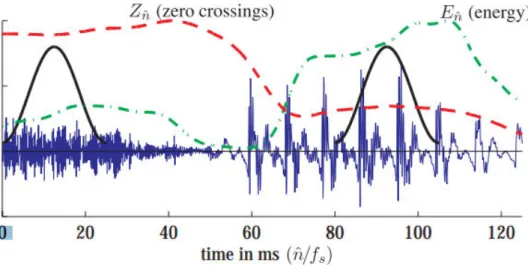
2.3.1.2 Energy and zero crossing based features
Like the F0, short-term energy is computed for each frame, and the statistics is applied for the whole utterance. Unlike the fundamental frequency some statistics like the minimum, onset, and offset of the energy envelope, does not make sense because the minimum energy is usually zero or close to zero (see Figure 2-5).
The short time energy is computed as follow (Rabiner & Schafer, 2007):
= ∑ −
∞ =−∞
(2.1) Where w is hamming window.
While the zero crossing is computed by:
= ∑ . | − − |
∞ =−∞
24
Figure 2-4: Example of features used to describe a pitch contour (Buckow, et al., 1999)
Figure 2-5: Section of speech waveform with short-time energy and zero-crossing rate superimposed
2.3.1.3 Duration and Pauses features
The duration of the words, and the normalized duration by the number of syllables is the core of this set of duration and pauses features. This kind of feature is usually computed by manually segmentation of the words. For full automatic emotional data analysis the computation of this kind of feature is not necessary. Speaking rate is also reported as duration related features (Muto , et al., 2005), consequently, the position of maximum and minimum of F0 and the energy, beside the onset and offset of F0, are used for this purpose.
25
The duration of pauses, whether it is filled (like “Emm”, “Ahhh”, etc.) or silent pauses, is considered as pauses-based features (Steidl, 2009).
2.3.2 Spectral Features
Spectral information reflects the distribution of waveform frequencies along the speech signal. Spectral features are reported to carry information on text contents, speaker’s identity, and emotional state (Paliwal, 1998;Pérez, et al., 2012). Formant frequencies are widely used spectral features that characterize the phones in a speech signal, especially the lower formants. Speaker-related information can also be found in the higher formants. Furthermore frequency bands magnitudes, spectrum Roll-off and centroids are all computed to represent the spectral features. We first describe some of these spectral features.
2.3.2.1 Formants
Formants of a speech signal represent the resonance that happen while the generated airwaves pass through the vocal tract. To model the speech resonance characteristic, the vocal tract is modelled by a simple tube of length L (about 170mm), this tube is normally divided into N equal length sub-tubes Si with different widths, (see Figure 2-6).
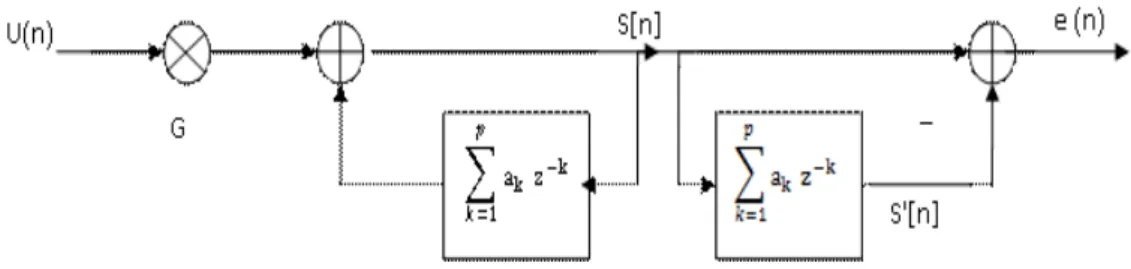
To understand how the formant is estimated, it is necessary to refer to Fant’s suggested model of speech production (Fant, 1970) as shown in (Figure 2-7). The passage of the speech signal, generated by the vocal cords, through the vocal tract is subject to multiple filtrations. This system is modelled by the following Z-space filter equation:
= . . . Here, U represent the glottal pulses scaled by the voiced controller, V is the vocal tract filter, and R represents the lip radiation filter. This system can model the speech production as a linear time invariant system.
The disruption of signal flow happened with the transition from one cylinder to another. Thus V(z) filter is defined by the following formula:
=
− ∑� −