University of Connecticut
OpenCommons@UConn
Doctoral Dissertations University of Connecticut Graduate School7-11-2018
High-Ability Students with Emotional Behavioral
Disorders: An Exploration of Intelligence as a
Protective Factor
Karen L. Cross PhD
University of Connecticut - Storrs, karen.cross@uconn.edu
Follow this and additional works at:https://opencommons.uconn.edu/dissertations Recommended Citation
Cross, Karen L. PhD, "High-Ability Students with Emotional Behavioral Disorders: An Exploration of Intelligence as a Protective Factor" (2018).Doctoral Dissertations. 1880.
High-Ability Students With Emotional Behavioral Disorders: An Exploration of Intelligence as a Protective Factor
Karen Louise Cross, Ph.D. University of Connecticut, 2018
Given the increased numbers of students being served by disability services offices at the postsecondary level, a better understanding of how intelligence functions as a protective or risk factor is essential to inform services for adolescents in secondary education. Therefore, this study examined whether intelligence functions as a protective factor against the negative effects of adverse childhood experiences and their role in the onset of Emotional Behavioral Disorders (EBDs). Consequently, school service provision was also examined, as it has the potential to serve as a protective factor against long-term disorder prevalence. Finally, the personality characteristic openness was evaluated to determine how the combination of ability and EBDs influence openness. As such, two groups of adolescents from the National Comorbidity Survey-Adolescent Supplement (NCS-A), ages 13 to 17, were studied (N = 5,023): (a) high-ability students (IQ ≥ 120) with EBDs; and (b) average ability students (85 ≤ IQ ≤115) with Emotional Behavioral Disorders. Logistic regression analyses were conducted to compare the odds of disorder and school services in adolescents who have had a history of adverse childhood experiences. Additionally, within the high-ability group, odds ratios were computed between males and females for disorder prevalence and school services. Finally, an exploratory factor analysis of the NCS-A personality interviews was conducted and mean group differences for openness were computed for students across EBDs. Results supported the current literature, demonstrating that high-ability students (IQ ≥ 120) do not have statistically higher rates of EBDs when exposed to childhood trauma. However, across groups, males received disproportionate levels of school services. Group differences in openness, though statistically significant, were functionally negligible, with all students scoring in the somewhat range. In conclusion, this
Karen Louise Cross – University of Connecticut, 2018
research demonstrated that intelligence is not a risk factor for the onset of EBDs; however, the results did not substantiate the hypothesis that intelligence was a protective factor.
i
High-Ability Students With Emotional Behavioral Disorders: An Exploration of Intelligence as a Protective Factor
Karen Louise Cross
B.A., Mills College, 1985 M.A., University of Connecticut, 2015
A Dissertation
Submitted in Partial Fulfillment of the Requirements for the Degree of
Doctor of Philosophy at the
University of Connecticut
ii Copyright by Karen Louise Cross
iii
APPROVAL PAGE
Doctor of Philosophy Dissertation
High-Ability Students With Emotional Behavioral Disorders: An Exploration of Intelligence as a Protective Factor
Presented by
Karen Louise Cross, B.A., M.A.
Major Advisor ___________________________________________________________________ Melissa A. Bray, Ph.D. Major Advisor ___________________________________________________________________ E. Jean Gubbins, Ph.D. Associate Advisor ___________________________________________________________________ James Kaufman, Ph.D. Associate Advisor ___________________________________________________________________ Alan S. Kaufman, Ph.D. University of Connecticut 2018
iv Dedication
“Are not all lifelong friendships born at the moment when at last you meet another human being who has some inkling (but faint and uncertain even in the best) of that something which you were born desiring, and which, beneath the flux of other desires and in all the momentary
silences between the louder passions, night and day, year by year, from childhood to old age, you are looking for, watching for, listening for? You have never had it. All the things that have ever deeply possessed your soul have been but hints of it — tantalizing glimpses, promises never quite fulfilled, echoes that died away just as they caught your ear. But if it should really become manifest — if there ever came an echo that did not die away but swelled into the sound itself — you would know it. Beyond all possibility of doubt, you would say ‘Here at last is the thing I was made for.’”
~ C. S. Lewis (1888-1963)
This dissertation is dedicated to each member of my family who believed in me when I did not believe in myself and encouraged me throughout the process. Charlie and Janet Ottone (Dad and Mom), you always told me that I could be anything I wanted to be! Thank you for supporting me in all my endeavors and encouraging me to put one foot in front of the other. Mark, you have continually reminded that I was made to do this. Thank you for being a voice of truth and stability in the midst of the insanity. And, to my children – you three inspired me to pursue my doctorate. I watched each of you exhibit incredible giftedness alongside overwhelming struggles; yet, you persevered. Thank you for modeling resilience in the midst of challenges! Watching you pursue your dreams gave me courage to pursue mine!
v
Acknowledgments
I want to express my deepest gratitude to my co-advisors, committee members, professors, and mentors. You have inspired and challenged me throughout my time at the University of
Connecticut. Thank you, first, to E. Jean Gubbins and Melissa Bray, my co-advisors. Jean, you recognized my passion for students who exhibit twice-exceptionality and paved the way for me at UConn. You saw potential in me that I did not see in myself. Plus, your kindness and
compassion in the midst of the many challenges I faced while in graduate school have deeply touched me. From the depths of my heart, I thank you. Melissa. Your constant encouragement and reminder that I will make it to the finish line gave me hope when I wanted to quit. Thank you for sharing your passion for mind-body health with me and encouraging me in my research efforts. I never thought I would see the day when the girl who hated writing would author publications!
Thank you, Alan and Nadeen Kaufman, for providing me the research opportunity of a lifetime! Working on the K-TEA 3 project with you changed the course of my life; I had never considered research as a potential career path. Thank you, also, for mentoring me and recognizing my natural propensity toward quantitative analysis. Alan, this dissertation is because you connected me with the NCS-A dataset and supervised my analyses, patiently enduring multiple failed attempts to build a solid model. Your research expertise has been invaluable! And, James Kaufman, thank you for helping me add a creativity component to the dissertation! There is no way to study the “mad genius” theory without including creativity. And more than that, thanks for including me as one of your “unofficial” advisees; I am honored to work with and know you.
vi
You and your family are not only amazing scholars but genuinely kind, good, and loving human beings.
John Driscoll, thank you for taking me in at the last minute! My year as an intern at Rockville High School has forever changed my view of school psychology. You are the embodiment of the research-practitioner; you have stayed current with best-practice in school psychology and advocated for the field. Thank you for living out excellence in assessment and consultation within the context of the ever-shifting environment of a school. Thank you, also, for challenging me to grow in my areas of weakness and for nurturing my strengths.
As I have shared previously, Susan Baum, you are the reason I applied to the University of Connecticut. Your passion for twice-exceptional students is contagious! Thank you for encouraging me to pursue excellence in the field of twice-exceptionality. And, Stephen Chou, your knowledge of the assessment and social emotional needs of gifted/twice-exceptional students added important insights to my discussion of this study. Thank you for your help and participation in my successful completion of graduate school.
Finally, a special thanks to the wonderful friends that I have made in both the gifted education and school psychology programs. Susan, Lorrie-Anne, and Pam have all encouraged me to pursue excellence and run the race to the finish line. Nilani and Maria, my friends and CT “daughters” – thank you for befriending me even though I am old enough to be your mothers! You both are such an inspiration to me of women who pursue their dreams and never give up. I look forward to working with you all in the future!
vii
Table of Contents
Dedication ... iv
Acknowledgement ... v
CHAPTER ONE: INTRODUCTION ... 1
Statement of the Problem ... 1
Purpose of the Study ... 3
Theoretical Rationale ... 4
Deprivation ... 4
Threat ... 5
The Deprivation Threat Model ... 5
Research Questions ... 6 Hypotheses ... 7 Hypothesis 1a ... 7 Hypothesis 1b... 7 Hypothesis 2... 8 Hypothesis 3... 8 Hypothesis 4... 8
CHAPTER TWO: REVIEW OF LITERATURE ... 9
Postsecondary Mental Health Crisis ... 9
Adolescents With Emotional Behavioral Disorders ... 10
Disorder Prevalence ... 11
Gender ... 12
viii
Educational Outcomes for Students With EBDs ... 14
EBDs and Dropout Rates ... 15
Adverse Childhood Experiences ... 16
Secondary Education Outcomes and ACEs ... 18
High-Ability Adolescents and Emotional Behavioral Disorders ... 19
Openness, High Ability, and EBDs ... 22
Openness and High Ability ... 23
Openness and Emotional Behavioral Disorders ... 24
CHAPTER THREE: METHODOLOGY ... 26
Participants ... 26
School Services and Openness Subsamples ... 29
Anxiety Disorders ... 29
Mood Disorder ... 31
Behavior Disorders ... 31
Substance Abuse Disorders... 32
Adverse Childhood Experiences (ACEs) Subgroups ... 32
Interpersonal Loss ... 34
Parental Maladjustment ... 34
Mistreatment ... 34
Financial Duress... 35
Measures ... 35
National Comorbidity Survey–Adolescent Supplement (NCS-A) ... 35
ix
Variables ... 37
Dependent Variables from NCS-A Dataset ... 37
Disorder by Type ... 37
Anxiety Disorders ... 37
Mood Disorders ... 38
Behavior Disorders ... 38
Substance Abuse Disorders... 38
Adverse Child Experiences (ACEs)... 39
Interpersonal Loss ... 39
Parental Maladjustment ... 39
Mistreatment ... 39
Financial Duress... 39
Special School Services ... 40
Openness ... 40 Independent Variable ... 41 Group ... 41 Covariates ... 41 Age ... 41 Gender ... 41 Ethnicity ... 41 Region ... 41 Urbanicity ... 42
x
Poverty Level ... 42
Socioeconomic Status (SES)... 42
Comorbidity ... 42
Statistical Analyses ... 42
Power Analyses ... 43
Exploratory Factor Analysis ... 43
Crosstabs Analyses ... 44
Multiple Logistic Regression Analyses ... 44
Assumption of Logistic Regression ... 45
Group Comparisons ... 46
Analysis of Covariance (ANCOVA) ... 46
Assumptions of ANCOVA ... 46
CHAPTER FOUR: RESULTS ... 48
Research Question 1a ... 48
Crosstab Analysis... 48
Binary Logistic Regression Analyses for Full Sample ... 49
Anxiety Disorder Logistic Regression Analysis ... 49
Mood Disorder Logistic Regression Analysis ... 51
Behavior Disorder Logistic Regression Analysis ... 53
Substance Abuse Disorder Logistic Regression Analysis ... 55
Group Comparisons of Odds Ratios ... 57
Anxiety Disorders ... 57
xi
Behavior Disorders ... 57
Substance Abuse Disorders... 58
Research Question 1b ... 58
Crosstab Analysis... 58
Binary Logistic Regression Analyses for Full Sample ... 59
Anxiety Disorder Logistic Regression Analysis ... 59
Mood Disorder Logistic Regression Analysis ... 61
Behavior Disorder Logistic Regression Analysis ... 61
Substance Abuse Disorder Logistic Regression Analysis ... 64
Group Comparisons of Odds Ratios ... 64
Anxiety Disorders ... 64
Mood Disorders ... 65
Behavior Disorders ... 65
Substance Abuse Disorders... 65
Research Question 2 ... 66
Interpersonal Loss ... 66
Crosstab Analyses ... 66
Binary Logistic Regression Analyses for Interpersonal Loss ... 67
Anxiety Disorder Logistic Regression Analysis ... 67
Mood Disorder Logistic Regression Analysis ... 70
Behavior Disorder Logistic Regression Analysis ... 72
Substance Abuse Disorder Logistic Regression Analysis ... 74
xii
Anxiety Disorders ... 75
Mood Disorders ... 76
Behavior Disorders ... 76
Substance Abuse Disorders... 76
Parental Maladjustment ... 77
Crosstab Analyses ... 77
Binary Logistic Regression Analyses for Parental Maladjustment ... 78
Anxiety Disorder Logistic Regression Analysis ... 78
Mood Disorder Logistic Regression Analysis ... 80
Behavior Disorder Logistic Regression Analysis ... 82
Substance Abuse Disorder Logistic Regression Analysis ... 84
Group Comparisons of Odds Ratios ... 86
Anxiety Disorders ... 86
Mood Disorders ... 86
Behavior Disorders ... 87
Substance Abuse Disorders... 87
Mistreatment ... 88
Crosstab Analyses ... 88
Binary Logistic Regression Analyses for Mistreatment ... 88
Anxiety Disorder Logistic Regression Analysis ... 88
Mood Disorder Logistic Regression Analysis ... 91
Behavior Disorder Logistic Regression Analysis ... 93
xiii
Group Comparisons of Odds Ratios ... 96
Anxiety Disorders ... 96
Mood Disorders ... 96
Behavior Disorders ... 97
Substance Abuse Disorders... 97
Financial Duress... 97
Crosstab Analyses ... 97
Binary Logistic Regression Analyses for Financial Duress ... 98
Anxiety Disorder Logistic Regression Analysis ... 98
Mood Disorder Logistic Regression Analysis ... 99
Behavior Disorder Logistic Regression Analysis ... 102
Substance Abuse Disorder Logistic Regression Analysis ... 103
Group Comparisons of Odds Ratios ... 105
Anxiety Disorders ... 105
Mood Disorders ... 105
Behavior Disorders ... 106
Substance Abuse Disorders... 106
Research Question 3 ... 107
Within High-Ability Group Comparisons by Disorder ... 107
Disorders and Gender ... 107
ACEs, Disorders, and Gender ... 108
Interpersonal Loss and Gender ... 108
xiv
Mistreatment and Gender ... 110
Financial Duress and Gender ... 111
School Services and Gender ... 112
Research Question 4 ... 113
Exploratory Factor Analysis for Openness ... 113
ANCOVA by Disorder and Group ... 114
Openness by Group ... 115
Openness by Group in Adolescents With Anxiety Disorders ... 115
Openness by Group in Adolescents With Mood Disorders ... 116
Openness by Group in Adolescents With Behavior Disorders ... 117
Openness by Group in Adolescents With Substance Abuse Disorders ... 117
CHAPTER FIVE: Discussion and Implications ... 119
Describing the Differences Between Average- and High-Ability Students by Disorder... 119
Describing Anxiety Disorders by Ability ... 119
Describing Mood Disorders by Ability... 120
Describing Behavior Disorders by Ability ... 120
Describing Substance Abuse Disorders by Ability ... 121
Describing Schools Services Between Average- and High-Ability Students With EBDs ... 122
Describing School Services for Anxiety Disorders by Ability ... 122
Describing School Services for Mood Disorders by Ability ... 122
xv
Describing School Services for Substance Abuse Disorders by Ability ... 123
Describing Adverse Childhood Experiences, Disorder Prevalence, and Ability... 124
Describing Interpersonal Loss in Average- and High-Ability Students ... 125
Describing Parental Maladjustment in Average- and High-Ability Students .... 126
Describing Mistreatment in Average- and High-Ability Students ... 127
Describing Financial Duress in Average- and High-Ability Students ... 128
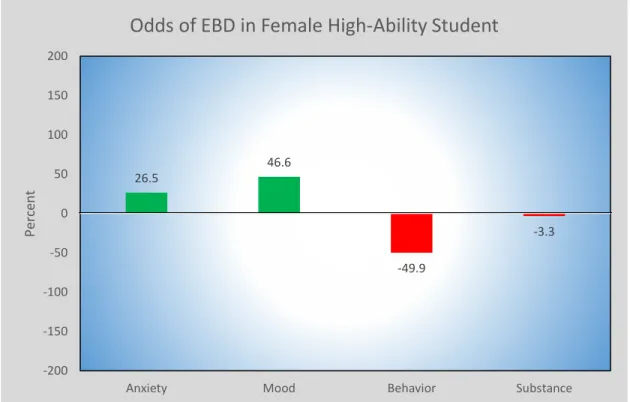
Describing Gender Differences in High-Ability Students by Disorder ... 130
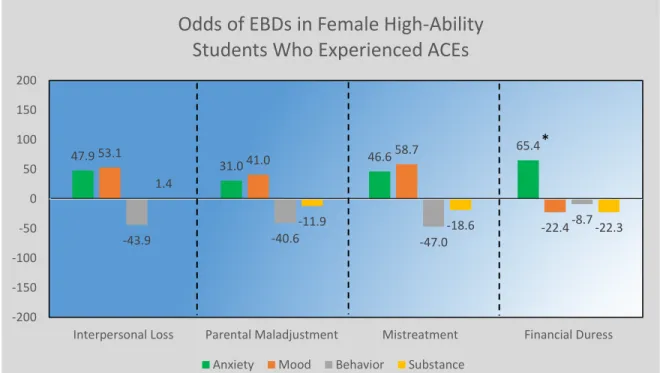
Describing Gender Differences, Adverse Childhood Experiences, and High Ability ... 131
Describing Gender Differences in School Services for High-Ability Students ... 134
Describing Differences in Openness Between Ability Groups... 136
Future Research ... 138
Limitations ... 138
Conclusion ... 139
References ... 141
Appendix A: Definition of Terms ... 150
Appendix B: Dummy Coding for Regression Analysis ... 154
xvi List of Tables
Table 1. Sociodemographic Frequencies and Percentages by Ability Groups ... 28
Table 2. School Services & Openness: Sociodemographic Frequencies and Percentages Across Disorder Classes and by Ability Group ... 30
Table 3. Adverse Childhood Experiences: Sociodemographic Frequencies and Percentages Across Disorder Classes and by Ability Group ... 33
Table 4. Power Analyses by Research Question and Analysis Type... 43
Table 5. Goodness of Fit by Research Question ... 45
Table 6. ANCOVA Model Fit by Research Question ... 47
Table 7. Disorder Prevalence by Group and Disorder Class ... 48
Table 8. ANOVA: Odds Ratio for Anxiety Disorders in Average- and High-Ability Groups ... 50
Table 9. ANOVA: Odds Ratio for Mood Disorders in Average- and High-Ability Groups ... 52
Table 10. ANOVA: Odds Ratio for Behavior Disorders in Average- and High-Ability Groups ... 54
Table 11. ANOVA: Odds Ratio for Substance Abuse Disorders in Average- and High-Ability Groups ... 56
Table 12. Average- and High-Ability Group Comparisons: Odds Ratios by Disorder Class ... 57
Table 13. Prevalence of School Services by Disorder Class and by Ability Group ... 59
Table 14. ANOVA: Odds Ratio for School Services in Adolescents With Anxiety Disorders ... 60
xvii
Table 16. ANOVA: Odds Ratio for School Services in Adolescents With Behavior
Disorders ... 63
Table 17. ANOVA: Odds Ratio for School Services in Adolescents With Substance Abuse Disorders ... 64
Table 18. School Services Ability Group Comparisons: Odds Ratios by Disorder Class ... 65
Table 19. Interpersonal Loss: Comparison Between Average- and High-Ability Groups by Disorder... 67
Table 20. Interpersonal Loss ANOVA: Odds Ratios for Anxiety Disorders... 69
Table 21. Interpersonal Loss ANOVA: Odds Ratios for Mood Disorders ... 71
Table 22. Interpersonal Loss ANOVA: Odds Ratios for Behavior Disorders ... 73
Table 23. Interpersonal Loss ANOVA: Odds Ratios for Substance Abuse Disorders ... 75
Table 24. Interpersonal Loss: Odds Ratios Between Average- and High-Ability Groups by Disorder Class ... 76
Table 25. Parental Maladjustment: Comparison Between Average- and High-ability Groups by Disorder... 77
Table 26. Parental Maladjustment ANOVA: Odds Ratio for Anxiety Disorders ... 79
Table 27. Parental Maladjustment ANOVA: Odds Ratio for Mood Disorders ... 81
Table 28. Parental Maladjustment ANOVA: Odds Ratio for Behavior Disorders ... 83
Table 29. Parental Maladjustment ANOVA: Odds Ratio for Substance Abuse Disorders ... 85
Table 30. Parental Maladjustment: Odds Ratios Between Average- and High-Ability Groups by Disorder Class ... 86
Table 31. Mistreatment: Comparison Between Average- and High-Ability Groups by Disorder... 88
xviii
Table 32. Mistreatment ANOVA: Odds Ratio for Anxiety Disorders ... 90
Table 33. Mistreatment ANOVA: Odds Ratio for Mood Disorders ... 92
Table 34. Mistreatment ANOVA: Odds Ratio for Behavior Disorders ... 94
Table 35. Mistreatment ANOVA: Odds Ratio for Substance Abuse Disorders ... 95
Table 36. Mistreatment: Odds Ratios Between Average- and High-Ability Groups by Disorder Class ... 96
Table 37. Financial Duress: Comparison Between Average- and High-Ability Groups by Disorder... 98
Table 38. Financial Duress ANOVA: Odds Ratios for Anxiety Disorders ... 99
Table 39. Financial Duress ANOVA: Odds Ratios for Mood Disorders... 100
Table 40. Financial Duress ANOVA: Odds Ratios for Behavior Disorders ... 102
Table 41. Financial Duress ANOVA: Odds Ratios for Substance Abuse Disorders ... 104
Table 42. Financial Duress: Odds Ratios Between Average- and High-Ability Groups by Disorder Class ... 105
Table 43. Differences in Prevalence Between Groups and Across Disorders by Gender ... 108
Table 44. Interpersonal Loss: Prevalence in High-Ability Males and Females Across Disorders by Gender ... 109
Table 45. Parental Maladjustment: Prevalence Differences in High-Ability Males and Females ... 110
Table 46. Mistreatment: Prevalence Differences in High-Ability Males and Females ... 111
Table 47. Financial Duress: Prevalence Differences in High-Ability Males and Females ... 112
Table 48. School Services: Prevalence Differences in High-Ability Males and Females ... 113
xix
xx List of Figures
Figure 1. Deprivation/Threat Model ... 6 Figure 2. Factor Analysis Scree Plot for Openness ... 114 Figure 3. Odds of Disorder in High-Ability Students Who Have Experienced Interpersonal
Loss ... 126 Figure 4. Odds of Disorder in High-Ability Students Who Have Experienced Parental
Maladjustment... 127 Figure 5. Odds of Disorder in High-Ability Students Who Have Experience Mistreatment .. 128 Figure 6. Odds of Disorder in High-Ability Students Who Have Experienced Financial
Duress ... 129 Figure 7. Odds of EBDs in Female High-Ability Students When Compared With
High-Ability Males ... 130 Figure 8. Odds of EBDs in Female High-Ability Students Who Experienced ACEs When
Compared With High-Ability Males ... 132 Figure 9. Odds of School Services for Male High-Ability Students When Compared With
High-Ability Females... 135 Figure 10. Difference in Openness Between Average- and High-Ability Students ... 137
1
CHAPTER ONE: INTRODUCTION
Giftedness and creativity have been associated with the “mad genius” stereotype since the time of the ancient Greeks. Aristotle questioned, “Why is that all those who have become
eminent in philosophy or politics or the arts are clearly melancholic’s . . . ?” (Akiskal & Akiskal, 2007, p. 1). Theories have historically been based on retrospective examinations of the lives of eminent historical figures like Vincent Van Gogh, Amadeus Mozart, Michelangelo, and Edgar Allen Poe in which anecdotal accounts of symptoms consistent with mental illness were reported (Missett, 2013). Lombroso (1889) not only examined the biographies and products of eminent individuals, but he scrutinized physical characteristics like skull size, thereby determining the mad genius to be “degenerate,” “maniacal,” and “neurotic” (pp. 5-19). Yet, without a
standardized classification system for mental illnesses, there was no way to know whether these accounts provided an accurate mental health picture. Yet, in support of the theory, Akiskal and Akiskal (1988) observed patients at the Memphis Mood Clinic noting that “artistic creativity and eminence were associated with the bipolar II subtype characterized by such temperaments as cyclothymic and hyperthymic” (p. 3). They posited that creativity is mediated by cyclothymia without full-blown depressive symptomology. It was not until the rise of psychometric
intelligence measures that empirically sound studies could be conducted on the link between intelligence and mental illness.
Statement of the Problem
According to the Bureau of Labor Statistics (2009), nearly half of newly created jobs (between 2008 and 2018) will require a postsecondary degree. Consequently, it is all the more essential that individuals with psychiatric disabilities, who experience unemployment rates as
2
high as 90%, attend postsecondary institutions and complete their degrees (National Alliance on Mental Illness [NAMI], 2010). Currently, 33% of students receiving services in postsecondary institutions either have a psychological/psychiatric disorder or attention deficit-hyperactivity disorder (ADHD), exceeding Specific Learning Disabilities (SLD) as the most prevalent disorder served (Raue & Lewis, 2011). Furthermore, Hunt, Eisenberg, and Kilbourne (2010) stated, “it is important to keep in mind that college mental health personnel report not only increased numbers of students seeking mental health services but also increased severity among the case mix” (p. 5). It should also be noted that 64% of college dropouts indicated that they stopped attending college due to mental health related reasons and close to half of those who had dropped out did not receive accommodations, mental health services, or disclose their mental health disability while in college (NAMI, 2010). Taking these data into consideration, the needs of students on college campuses suffering from mental illness is reaching crisis level proportions.
Because of the increasing urgency to meet the needs of postsecondary students with mental health related disorders, examining current practices in high schools for college-bound students with Emotional Behavioral Disorders (EBDs), especially high-ability students with EBDs, is essential. Martin, Burns, and Schonlau (2010) conducted a meta-analysis/review of literature on high-ability adolescents with EBDs. Their literature review acknowledged limited research on high-ability students with EBDs; therefore, they were able to examine only nine articles addressing internalizing disorders and none addressing externalizing disorders. They reported that high-ability/gifted youth “exhibit significantly lower levels of anxiety compared with their nongifted peers and do not differ from their nongifted peers with respect to depression or suicide ideation” (p. 38). Nevertheless, none of the research from the meta-analysis and current searches of the literature addressed the onset or severity of psychopathology or the
3
effects of adverse childhood experiences (referred to as ACEs) on psychopathology in high-ability students.
Given the paucity of research on high-ability students with EBDs and the increasing number of students in postsecondary education requiring services for EBDs, the ultimate purpose of this research is to provide a foundation for further research to develop services and
interventions for high-ability secondary students with EBDs as they transition to postsecondary education. Consequently, it will examine the role intelligence on EBD prevalence and school-based services in high-ability adolescents from the National Comorbidity Survey-Adolescent Supplement (NCS-A, Kessler et al., 2009).
Purpose of the Study
The purpose of this secondary analysis of an existing database (NCS-A) is to describe high-ability students (IQ ≥ 120) with regards to the prevalence of EBDs and school-based services for students with EBDs to determine whether intelligence may serve as a protective factor against EBDs. To do this, the researcher evaluated how high-ability students differ from average-ability students. Differences in EBD prevalence between high-ability and average-ability students accounted for trauma in the form of interpersonal loss, parental maladjustment,
mistreatment, and financial duress. Creativity as another measure of intelligence was compared between high-ability and average-ability students. Additionally, within the high-ability group, gender differences was examined across EBDs with and without accounting for childhood trauma. Finally, school services provision for students within four EBDs categories was examined.
4
Theoretical Rationale
To better understand the function of ACEs, Sheridan and McLaughlin (2014) examined the neurological effects of ACEs on the brain. They proposed a theory that moves away from the reigning conception that focuses on child adversity within a stress framework and ignores the impact of environmental experience. Consequently, they have divided ACEs into two
neuroscientific constructs: threat and deprivation.
Deprivation
Sheridan and McLaughlin (2014) define deprivation as involving, “the absence of expected environmental inputs in cognitive (e.g., language) and social domains as well as the absence of species- and age-typical complexity in environmental stimulation” (p. 580). When a child experiences deprivation (i.e., institutionalization, neglect, poverty), Sheridan and
McLaughlin (2014) propose that deprivation reduces the thickness of the association cortex in the regions that handle multifaceted cognitive and social inputs (i.e., prefrontal cortex, superior parietal cortex, inferior parietal cortex, superior temporal cortex . . .). In terms of
institutionalization, increased rates of anxiety occur as a result of the lack of an attachment figure and are mediated by structural and functional changes in the amygdala (Tottenham, 2012). Furthermore, children who have been institutionalized have reduced exposure to language, changing routines, cognitive stimulation, and interaction with peers and adults (Nelson, Furtado, Fox, & Zeanah, 2009; Smyke et al., 2007; Zeanah et al., 2003). McLaughlin et al. (2014) noted reduced grey matter volume in the prefrontal cortex, superior parietal cortex, inferior parietal cortex, superior temporal cortex, which result in cognitive, receptive language, and expressive language deficits with an increased incidence of developmental disorders (Kreppner et al., 2001;
5
Zeanah et al., 2009). Although not as momentous, low parental socioeconomic status (SES) also puts children at risk for decreased cognitive inputs, especially in the areas of language and executive functioning (Sheridan, Sarsour, Jutte, D’Esposito, & Boyce, 2012). Finally, parental neglect produces deficits similar to those seen in children who have been institutionalized or from families that experience low SES (Dubowitz, Papas, Black, & Starr, 2002; Spratt et al., 2012). In particular, children suffer from poor cognitive control as observed in widespread activation of the dorsolateral prefrontal cortex (Mueller et al., 2010).
Threat
Sheridan and McLaughlin (2014) define threat as follows: “Experiences of threat involve the presence of an atypical (i.e., unexpected) experience characterized by actual or threatened death, injury, sexual violation, or other harm to one’s physical integrity” (p. 580). When a child experiences threat, the literature supports that enduring alterations in neural circuits negatively impact the hippocampus, amygdala, and ventromedial prefrontal cortex (fmPFC), thereby affecting emotional learning and fear conditioning (Sheridan & McLaughlin, 2014).
The Deprivation Threat Model
Sheridan and McLaughlin (2014) developed a model that depicts how deprivation and threat may exist either in isolation or in co-occurrence (see Figure 1). It should be noted that poverty in and of itself does not inherently determine exposure to deprivation or threat. It, however, often serves as a “marker” of exposure. The different types of deprivation or threat are determinative of neurodevelopmental outcomes. Complex Exposures usually involve experiences of both deprivation and threat, whereas, Typical Developmental Environments involve neither.
6
Therefore, the model illustrates the “dimensions of exposure that can be measured among children exposed to a range of adverse childhood experience, both those that occur in isolation . . . and those that are co-occurring . . .” (p. 581). As has been supported in the literature for students who have been affected by psychopathologies, ACEs also profoundly affect academic outcomes.
Figure 1. Deprivation/Threat Model (permission to reproduce granted by K. McLaughlin).
Research Questions
The research questions for this study examine the relationship of IQ as a potential protective and/or risk factor for psychopathology in adolescents who have experienced adverse childhood experiences.
1) To what extent do students with high ability (IQ ≥ 120) significantly differ from average-ability students (85 ≤ IQ ≤ 115) on prevalence of emotional behavioral disorder by (a) disorder class and (b) on receipt of school services by disorder class, when controlling for sociodemographic variables and comorbidity?
7
2) To what extent do high-ability students (IQ ≥ 120) who have experienced Adverse Childhood Experiences (ACEs) differ on rate of emotional behavior disorder by class when compared to average-ability students who have experienced ACEs when controlling for sociodemographic variables?
3) To what extent do male and female students within the high-ability group differ in terms of rate of disorder and receipt of school services when controlling for sociodemographic variables?
4) To what extent do students within the high-ability group differ from average-ability students in terms of openness to new experiences when controlling for
sociodemographic variables?
Hypotheses
Based on the literature review, the following hypotheses were constructed:
Hypothesis 1a
The odds ratio for high-ability students (IQ ≥ 120) will be significantly lower for anxiety and mood disorders than in average-ability students (85 ≤ IQ ≤ 115) and will not statistically differ for behavior and substance disorders.
Hypothesis 1b
The odds ratio for high-ability students (IQ ≥ 120) will be significantly lower for school services in average-ability students (85 ≤ IQ ≤ 115) with anxiety and mood disorder and will not statistically differ for behavior and substance disorders.
8
Hypothesis 2
In students who have experience ACEs, the odds ratio for high-ability students (IQ ≥ 120) will be significantly lower for anxiety and mood disorders than in average-ability students (85 ≤ IQ ≤ 115) and will not statistically differ for behavior and substance disorders.
Hypothesis 3
High-ability males will receive a higher rate of school services across disorder class than high-ability females.
Hypothesis 4
High-ability students will have statistically higher levels of openness than average-ability students.
9
CHAPTER TWO: REVIEW OF LITERATURE
This review of literature summarizes the relevant research pertaining to the components of this study. An examination of the increase of EBDs being served at the postsecondary level along with its effect on graduation rates was completed. Then the characteristics of students with EBDs was described along with the effects of EBDs on academic performance. Finally, an examination of the research on high-ability students with EBDs was conducted, thereby identifying gaps in the literature that the present research investigation will help fill.
Postsecondary Mental Health Crisis
According to the Bureau of Labor Statistics (2009), close to half of newly created jobs between 2008 and 2018 will necessitate a postsecondary degree. However, nearly two-thirds of students who are no longer attending college reported that they dropped out due to a mental health reason (Gruttadoro & Crudo, 2012). Collins and Mowbray (2005) indicated that approximately 86% of students with mental health conditions did not complete their degrees, though a study found a reduced effect. In a study of 350 college students who self-identified as having depression or a psychiatric/mental condition, Koch, Mamiseishvili, and Higgins (2013) found the 6-year persistence to degree rate to be 54.7%; a concerning finding, but definitely not as discouraging as previous research has indicated. Hunt et al. (2010) found that Bipolar
Disorder I, Antisocial Personality Disorder, marijuana addiction, amphetamine addiction, and cocaine addiction were all significantly associated with failure to graduate from college. Major depression, social anxiety, and generalized anxiety were also significantly and positively related to dropping out of college; however, this effect did not persist when the model did not control for sociodemographics. Furthermore, the American College Health Association (2009) reported that
10
suicide is the second leading cause of death on university campuses. According to Garlow et al., (2008), 84% of undergraduate students with current suicidal ideation did receive
psychological/psychopharmacological services, including post-secondary disability services, thereby suggesting that reported rates fall short of accurately representing the severity of the problem. Interestingly, Schwartz (2013) reported that being a college student status did not serve as a risk factor for females and, in fact, served as a protective factor for males.
In fact, of reported disabilities on postsecondary campuses, EBDs have exceeded Specific Learning Disability: (a) 33% to 31% respectively on 4-year campuses, (b) 39% to 29%
respectively on 4-year public campuses, and (c) 39% to 36% on 4-year private campuses (Raue & Lewis, 2011). According to NAMI (2010), college students reported suffering from depression (27%), bipolar disorder (24%), anxiety (11%), schizophrenia (6%), post-traumatic stress disorder (6%), ADHD (5%), and substance abuse (1%). The seriousness of the trend in these data
demands that the special education community ask: “How can we better understand and support the needs of students with EBDs in secondary school settings?” Only when this question is answered can we ensure a higher degree of positive transitions to the postsecondary 4-year university system and better graduation outcomes within the system.
Adolescents With Emotional Behavioral Disorders
The NCS-A, one of the most comprehensive studies of EBDs in adolescents. The dataset for this study provided data on the characteristics and outcomes of adolescents with EBDs: anxiety disorders, mood disorders, behavioral disorders, and substance abuse disorders. Merikangas et al. (2010) reported that 49.5% of adolescents experience a mental disorder and 22.2% experience symptoms intense enough to severely impair daily living. Anxiety, the most
11
common condition, affects 31.9% of adolescents diagnosed with an EBD. Behavior disorders follow at 19.1%, mood disorders at 14.3%, and substance abuse disorders at 11.4%.
Disorder Prevalence
Depending on sampling and survey criteria, studies disagree on the prevalence of disorder. Ford, Goodman, and Meltzer (2003) utilized the 1999 British Child and Adolescent Mental Health Survey to report a 9.5% overall prevalence of DSM-IV disorders in a sample of 10,438 British children between the ages of 5 and 15. In terms of adolescents, 5.0% were diagnosed with anxiety disorders, 2.5% with depressive disorders, and 7.0% with disruptive disorders and 3.6% with “not otherwise specified” disorders.
In contrast to Ford et al. (2003), Copeland, Shanahan, Costello, and Angold (2011) reported substantially higher rates of disorder in an analysis of the Great Smoky Mountains Study that followed 1,420 participants between the ages of 9 and 21. They found that by the age of 21, 61.1% of participants had met criteria for a psychiatric disorder. Results by disorder were as follows: (a) mood disorder – 14.8%; (b) anxiety disorder – 20.0%; (c) behavior disorder – 23.5%; and (d) substance disorder – 42.0%. It should be noted that an additional 21.4% met criteria of a “not otherwise specified” disorder, thereby potentially increasing the overall prevalence to 82.5%.
According to Kessler et al. (2012), the 30-day prevalence of disorder in the NCS-A study was 23.4%, the 12-month prevalence of disorder was 40.3%, and the lifetime prevalence of disorder was 79.5%. The prevalence ratios for anxiety and behavior disorders were higher at 30-days and 12-months than mood and substance abuse disorders. Separation anxiety demonstrated the most variability in prevalence, ranking the 7th most common over a lifetime and the 14th
12
most common over 12-months/30-days because it is the only disorder that typically resolves by adolescence. Mood and anxiety disorders were significantly more prevalent in girls at
30-days/12-months, while behavior and substance abuse disorders were significantly more common in boys at 30 days/12 months. The data indicated that only children had a lower prevalence of behavior disorders than adolescents, though the number of biological parents in the home was inversely predictive of prevalence. Adolescents of parents who had less than a college education experienced a higher prevalence of disorder than those with parents who were college graduates. Finally, urbanicity was significantly associated with the 12-month prevalence of disorder. Given the variability of prevalence by disorder, an examination of gender rates becomes fundamental to better understanding how EBDs affect adolescents.
Gender
In the Great Smoky Mountains study, Copeland et al., (2011) reported that males were significantly more likely to meet criteria for disruptive behavior disorders (29.8% to 16.9%) and substance abuse disorders (49.7% to 34.8%). They found slightly higher (but not statistically significant rates of anxiety (24.8% to 21.1%) and depressive disorders (17.5% to 12.8%) in females. Interestingly, prior to puberty males had higher rates of depressive disorder than females.
In the NCS-A study, Merikangas et al. (2010) noted that mood and anxiety disorders were more common in females (18.3% to 10.5% and 38.0% to 26.1%, respectively), while males had three times the rate of ADHD as females (13.0% to 4.2%, respectively). Males also had slightly higher rates of oppositional defiant disorder (13.9% to 11.3%), conduct disorder (7.9% to 5.8%), and substance abuse disorders (12.5% to 10.2%). As one examines the complexity of
13
factors that lead to EBDs in adolescents, it is important to examine the services provided for adolescents in a school setting.
EBDs and School Services
According to Merikangas et al. (2011), services for students with EBDs in the NCS-A sample were provided across multiple settings, including mental health providers and schools. Schools surpass mental health providers in the provision of services for ADHD and behavioral disorders. In spite of the notable role in service provision for ADHD in males, there is a need for improvement in identification procedures and service provision for females with ADHD.
Additionally, schools lag behind mental health providers in providing interventions for students with internalizing disorders (mood: 39.8% to 58.8% and anxiety: 28.9% and 40.0%,
respectively). The study also noted that females receive services, across all types of service provision, less frequently than males and minorities. Comorbidity does increase service provision across intervention settings, including schools.
Langer et al. (2015) examined mental service use in schools and outpatient settings for 933 adolescents between the ages of 11 and 18 who were identified as having a serious
emotional disturbance. They reported that 52.95% of participants received school-based services. In particular, school-based service provision was provided in the following four categories: (a) counseling or therapy (18.15%); (b) special help in regular education classroom (7.80%); (c) special classroom in district school (28.13%), and (d) outside district clinical school placement (22.92%). However, service provision and cognitive abilities were not explored in either of these studies; therefore, there is no information on whether high-ability students with EBDs receive similar levels and numbers of interventions.
14
Educational Outcomes for Students With EBDs
Across the literature, externalizing disorders consistently predict reduced academic performance, increased absences, and disciplinary action (Suldo, Gormley, DuPaul, & Anderson-Buther, 2014). Valdez, Lambert, and Ialongo (2011) found that 1st grade students with above average behavioral symptoms were at increased risk for low academic performance in
adolescence. Furthermore, the decreased academic skills in adolescence then predict internalizing disorders in early adulthood. Burt and Roisman (2010) stated, “A statistically significant ‘cascading’ path from early externalizing problems in preschool, through academic achievement in early grade school, and then to internalizing problems in middle childhood was observed, over and above effects of within-time covariation and stability” (p. 565). In a
longitudinal study of 205 children between the ages of 8 and 12, Masten et al., 2005, reported that externalizing problems in childhood predict externalizing, academic, and internalizing problems in young adulthood. Finally, Moilanen, Shaw, and Maxwell (2010) conducted a study of 291 boys from low socioeconomic status families concluding that,
. . . high levels of externalizing problems at ages 6 and 8 were respectively associated with poorer academic competence at ages 8 and 10. In turn, poor academic competence at ages 10 and 11 was related to high levels of externalizing problems at ages 11 and 12. Poor academic competence at age 10 was also linked to high levels of internalizing problems at age 11. High levels of externalizing problems around the time of initial school entry (age 6) and during the transition to middle school and adolescence (age 11) were predictive of high levels of internalizing problems at ages 8 and 12. (p. 14)
In contrast, internalizing disorders do not predict a decrease in grades but do predict a decrease in attendance and high school completion. In a 15-year longitudinal study of 2,000 children
15
across Quebec from 1986 to 2000, Duchesne, Vitaro, Larose, and Tremblay (2008) reported a significant difference across trajectory groups (𝜒2(3) = 24.71, p < .001). Notably, 41% of the chronic anxiety group did not earn a diploma. Valdez et al., (2011) found that 1st grade students with above average depressive symptoms were at increased risk (30.9%) for low academic performance in adolescence. Additionally, poor academic achievement affects mental health and is manifested in internalizing disorders (Suldo et al., 2014). As the authors state:
Abundant evidence supports the co-occurrence of risk across psychological, social, and academic domains, such that students with problems in one area tend to simultaneously show problems in the other areas, whereas well-adjusted children are defined by positive social and academic competence and minimal problems in terms of externalizing or internalizing symptoms. (pp. 87-88)
Therefore, comorbidity compounds the adverse effects of psychopathologies on academic achievement.
EBDs and Dropout Rates
Of the adverse effects on academic achievement, high school dropout rates are correlated with long-term unemployment and incarceration, especially in at-risk populations (Porche, Fortuna, Lin, & Alegria, 2011). Utilizing the Collaborative Psychiatric Epidemiology Surveys, Porche et al. reported dropout rates of 24.22% for students with substance abuse disorders and 28.51% for students with conduct disorder. The authors noted a significant difference (p < .01) between the dropout rate of students with EBDs (19.75%) and those without (13.60%).
Additionally, Fergusson and Woodward (2002) reported that students who experience depression are more likely to experience anxiety OR = 3.9%, 95% CI [2.7-5.8] and school failure OR = 1.8
16
95%, CI [1.1-2.7] and less likely to pursue post-secondary education OR = 0.6%, 95% [CI, 0.4-0.8]. Consequently, both externalizing and internalizing disorders negatively predict high school graduation. Given the negative effects of EBDs, an examination of how adverse childhood experiences and high-stress environments affect the onset of psychopathologies is indicated to better understand the role interventions prior to adolescence can play on the outcomes of secondary students.
Adverse Childhood Experiences
Porche, Costello, and Rosen-Reynoso (2016), in an analysis of the National Survey of Children’s Health 2011/12, found that 53.4% of the parents reported their child had been exposed to at least one ACE with an average exposure of 2.09 ACEs [±SE 0.02 (95% CI 2.05, 2.12) weighted] and a range of 1 to 9 ACEs. Percentages based on exposure to type of ACE are as follows: (a) 25.8 % (0.4) household poverty; (b) 25.1% (0.4) parental divorce; (c) 4.2% (0.2) death of parent; (d) 8.1% (0.3) incarceration of parent; (e) 8.9% (0.3) witnessed domestic violence; (f) 11.5% (0.3) victim or witness of neighborhood violence; (g) 10.1% (0.3) family member with a mental health condition; (h) 13.2% (0.3) family member with substance abuse problem; and (i) 5.6% (0.2) experienced racism. Furthermore, the authors reported that mental health mediated educational outcomes in students with ACEs.
From the NCS-A, McLaughlin et al. (2012) reported that 58.3% of adolescents had been exposed to at least one adverse childhood experience (ACE). The prevalence of ACEs were as follows: (a) 7.3% (0.6) parental death; (b) 28.4% (1.2) parental divorce; (c) 4.9% (0.6) other parental loss; (d) 15.6% (0.8) parental mental illness; (e) 10.7% (0.7) parental substance abuse; (f) 26.3% (1.1) parental criminality; (g) 8.4% (0.5) family violence; (h) 4.2% (0.5) physical
17
abuse; (i) 4.4% (0.4) sexual abuse; (j) 5.9% (0.7) emotional abuse; (k) 2.2% (0.5) neglect; and (l) 16.2% family economic adversity. ACEs strongly predicted behavior disorders and were
correlated with 28.2% of the onset of mental disorders represented and 40.7% of the behavioral disorders. Maladaptive family functioning (MFF) accounted for 23.7% of the risk for a disorder and 37.0% of the risk for a substance use disorder and 32.1% of the risk for a behavior disorder. Parental divorce accounted for 6.8% of distress disorders while family economic adversity accounts for 6.4% of behavioral disorders.
Saunders and Adams (2014) conducted a review of literature based on studies that utilized national samples of youth in the United States. They reported that “. . . conservative estimates would be that approximately 8% to 10% of American youth have experienced at least one sexual assault, with higher rates of sexual victimization among girls (13%-17%) relative to boys (3%-5%)” (p. 174). Depending on how physical abuse was defined, prevalence ranged between 4% and 19%. The prevalence of physical assault with intent to kill or injure was 17% (based on the National Survey of Adolescents) and without intent to kill or injure was 69%-71%. Adolescents reported witnessing family violence 33% of the time and 18% had lost a family member to homicide. Furthermore, 33% of adolescents have experienced a natural disaster in which they worried they would be injured or killed. Other forms of trauma included motor vehicle accidents, unintentional falls, and animal attacks. Given the significant percentages of ACEs experienced by adolescents, the effects on school performance must be examined.
18
Secondary Education Outcomes and ACEs
According to Porche et al. (2016), school engagement, grade retention, and the likelihood of having an Individualized Education Program (IEP) are significantly affected by the
combination of family adversity and Emotional Behavioral Disorders. In fact,
Children with higher numbers of adverse family experiences were more likely to have higher numbers of mental health diagnoses, and those with higher numbers of diagnoses were less likely to be engaged in school and more likely to be retained in grade or on an IEP. (Porche et al., 2016, p. 55)
The authors found that the number of adverse family experiences had a negative direct
relationship [𝛽 = -0.066, p < .001] with school engagement. Furthermore, there was a positive direct relationship with school retention [𝛽 = 0.014, p < .001] and having an IEP [𝛽 = 0.005, p < .05]. The number of child mental health diagnoses mediated the effect of adverse family
experiences on each of the outcome variables.
Goodman, Miller, and West-Olatunji (2012) utilized the Early Childhood Longitudinal Study, Kindergarten Class of 1998-99 to examine the relationship between childhood trauma and academic achievement. They reported significantly decreased achievement scores in reading, mathematics, and science (p < .001). In particular, a child who had experienced traumatic stress had a mean reading score 11.932 points lower than one who had not, a mean mathematics score 10.883 points lower, and a mean science achievement score 5.689 points lower. Traumatic stress did not predict absences (0.167, p = .084). However, children who had experienced traumatic stress were 3.03 (p < .001) times as likely to have an IEP.
Burke, Hellman, Scott, Weems, and Carrion (2011) conducted a retrospective medical chart review to examine the presence of ACEs and their association with learning/behavior
19
problems and BMI in sample of low socioeconomic children. They found that children who were exposed to 1+ ACEs were 10.3 times (p < .001) as likely to have a learning/behavior disorder and those exposed to 4+ ACEs were 32.6 times (p < .001) as likely. Given the consistent correlation between ACEs and psychopathology reported in the literature, one must consider whether high ability acts as a risk factor or protective factor in the prevalence of EBDs, thereby allowing researchers to better prepare high-ability students with EBDs for postsecondary education.
High-Ability Adolescents and Emotional Behavioral Disorders
To understand the role intelligence plays in the onset and severity of EBDs, one must first examine whether intelligence and EBDs are associated with one another. Intellectual ability, as described by the Cattell-Horn-Carroll theory of intelligence (Carroll, 1993), defines intelligence in terms of broad and narrow abilities that include crystallized intelligence (Gc), fluid
intelligence (Gf), short-term memory (Gsm), long-term memory (Glr), visual processing (Gv), auditory processing (Ga), processing speed (Gs), quantitative knowledge (Gq), and reading and writing (Grw; Carroll, 1993). According to Benson, Kranzler, and Floyd (2016), fluid
intelligence loads the closest to g (the overall intelligence factor). Consequently, Keyes, Platt, Kaufman, and McLaughlin (2017) used fluid intelligence to examine the relationship between intelligence and EBDs in the NCS-A. They concluded that EBDs were not associated with higher IQ and that lower fluid intelligence appeared to be a risk factor for behavior disorders. Past-year bipolar and behavior disorders (ADHD, ODD, CD) for higher IQ students were all significantly below the mean, averaging about 5 points lower. Participants with specific phobia and separation
20
anxiety, both early onset disorders, also had significantly lower IQ scores, while there were no associations with the other fear and distress orders.
Bracken and Brown (2008) studied 45 gifted education students and 45 general education students in which they compared behavioral and adaptive characteristics. Overall, gifted
education and regular education students were not significantly different in terms of internalizing and externalizing behaviors. However, gifted education students (M = 41.02, SD = 9.45) had significantly lower levels of anxiety than regular education students (M = 49.4, SD = 8.56). This was also true for depression (M = 42.4, SD = 9.83; M = 49.44, SD = 8.93, respectively) and ADHD (M = 40.4 SD = 9.8; M = 48.7, SD = 8.7, respectively). In contrast, there were no statistically significant differences between gifted and general education students in terms of anger, aggression, or bullying.
Martin et al. (2010) conducted a review of literature/meta-analysis comparing the
prevalence of anxiety, depression, and suicidal ideation in gifted and general education students. The authors were not able to find any studies for externalizing disorders (e.g., ADHD or bipolar). They found, overall, that gifted students have a similar or reduced risk for depression, anxiety, and suicidal ideation when compared to general education students. In particular, gifted students did not exhibit statistically different levels of depression (ES = -0.17) or suicidal ideation.
However, gifted students did have significantly lower levels of anxiety (ES = -0.72) than general education students. They cautioned that the studies reviewed all had small sample sizes.
Missett (2013) examined the literature that contributed to the “mad genius theory,” which has purported that highly intelligent individuals are at higher risk for mental health disorders. Findings of Mueller (2009), did not confirm the theory, reporting that gifted adolescents were less depressed than their nongifted peers. Richards, Encel, and Shute (2003) also showed
21
significantly (p < .05) fewer depressive symptoms in gifted students when compared to their nongifted peers on the Behavior Assessment System for Children (BASC) across teacher, parent, and self-report ratings. Mueller (2009), in an analysis of the National Longitudinal Study of Adolescent Health (Add Health), found that gifted students (M = 8.67, SD = 6.67) were
significantly less depressed than their nongifted peers (M = 10.69, SD = 7.05 p < .000). Koenen, Moffitt, Rogers, Martin, and Kubzansky (2009) evaluated childhood IQ and adult mental health disorders. They found that high-IQ (> 115 on WISC-R) predicted a 42% reduction in the odds of schizophrenia, a 26% reduction in the odds of anxiety disorders, a 23% reduction in the odds of depression. However, higher IQ predicted a 300% increase in the risk of adult mania.
Furthermore, Suldo and Shaunessy-Dedrick (2013), in a study of 480 high school students in academically rigorous programs (Advanced Placement and International Baccalaureate), reported that the students had significantly higher (p < .05) levels of perceived stress when compared to general education students. In spite of the increased perceived stress, the students did not have significantly different levels of internalizing symptoms, externalizing symptoms, or anxiety leading the authors to posit that that students with giftedness utilize adaptive strategies to cope with academic stressors, thereby indicating that intelligence may operate as a protective factor.
Based on a series of studies completed by Antshel and colleagues, the apparent protective factor of IQ may be compromised when comorbidity exists. Antshel et al. (2007) found a
statistically significant correlation between ADHD and mood, anxiety, and disruptive behavior disorders (p < .001) and one-fifth of the students with ADHD were retained a year in school. At follow-up, Antshel et al. (2008) reported similar levels of comorbidity with significant
22
affective disorder and ODD. Furthermore, ADHD was implicated in impairments in academic, social, and family functioning. It should also be noted, that the majority of the research
demonstrates little to no relationship between giftedness and mental illness. MacCabe et al. (2010) found that participants who earned A grades had a significantly (p < .05) higher risk for bipolar disorder than students with average abilities and academic performance.
All in all, the literature strongly supports the perspective that high-ability provides a protective factor against the onset of EBDs. As was noted by Keyes et al., (2017), “Lower IQ is associated with chronic psychiatric disorders rather than transient disorders, . . . suggesting that children with early psychiatric disorders may experience persistent challenges in cognitive development and ability” (p. E7). Regardless of ability level, these challenges are evidenced by negative educational outcomes.
Openness, High Ability, and EBDs
Gifted education focuses not only on students who exhibit intellectual giftedness but also students who demonstrate high levels of creativity (Renzulli & Reis, 2014). Therefore, to
thoroughly examine high-ability students with EBDs, an understanding of how creativity factors into the equation is necessary. However, the NCS-A does not include a creativity measure; therefore, the use of the personality characteristic openness will be examined. The use of
openness as a surrogate for creativity is supported by a meta-analysis of 83 studies, Feist (1998) demonstrated across domains and creativity measures, openness to novel ideas, people, or circumstances was highly correlated with creativity. Conner and Silvia (2015) reported that people who were open reported more creativity than other personality characteristics. In fact, Colin Martindale (1989) noted that “measures of openness to experience seem so much more
23
related to being creative than to being open that it was a cause for debate, why the factor wasn’t just called creativity” (p. 97). Consequently, the literature strongly supports the measurement of openness in research as a predictor of creativity.
Openness and High Ability. The personality characteristic openness (see Appendix A) has been shown to be associated with intelligence throughout the literature. In a meta-analysis, Ackerman and Heggestad (1997) found openness to be related to Gc (crystallized intelligence), Gf (fluid intelligence), and Knowledge and Achievement. Additionally, in a study of 1,147 undergraduate students, Goff and Ackerman (1992) found that openness was highly correlated with crystallized intelligence (Gc; r = .398). Finally, with participants from the Western Ontario Twin Project, Ashton, Lee, Vernon, and Jang (2000) found the Openness/Intellect personality variable was correlated with crystallized intelligence (r = .37; p < .001), pictorial fluid
intelligence (r = .24; p < .001), total fluid intelligence (r = .18; p < .001), and overall intelligence (r = .29; p < .001).
Ackerman and Beier (2003) found that openness might affect the intensity and
investment of fluid intelligence, thereby leading to a greater breadth and depth of knowledge or crystallized intelligence. Chamorro-Premuzic, Moutafi, and Furnham (2005) studied the
relationship between subjectively-assessed (SAI) intelligence, fluid reasoning (Gf; the ability to solve novel problems using deductive an inductive reasoning) and the “Big Five” personality traits in 185 undergraduate students. They found that openness correlated significantly with Gf (r = .22, p = .01) and SAI (r = .20, p = .01) and that, “Openness and Gf may both underlie the development of Gc and adult intellectual competence. . . .” (p. 1525).
Openness to ideas, a type of openness to experience, was significantly correlated with both fluid and crystallized intelligence (Harris, 2004; Moutafi, Furnham, & Crump, 2003).
24
Zimprich, Allemand, and Dellenbach, (2009) found that Aesthetic Interests (interest and appreciation for beauty and art), Intellectual Interests (love of intellectual pursuits), and
Unconventionality (willingness to question established religious, political or social values), all of which are facets of openness, were significantly associated with fluid and crystallized
intelligence, with Intellectual Interests and Unconventionality more strongly correlated with crystallized intelligence. Interestingly, Zimprich et al., (2009) found that
While individuals who are more open to matters that have to be grasped intellectually (Openness clusters Intellectual Interests and Unconventionality) show higher cognitive performance, in particular regarding crystallized intelligence, those open to matters that require a more emotionally-loaded processing (Openness cluster Aesthetic Interests) tend to have lower levels of intelligence. (p. 453)
Consequently, openness to intellectual questioning and pursuits appears to be highly associated with intelligence.
Openness and Emotional Behavioral Disorders. The positive association between openness and intelligence and negative association between EBDs and intelligence argues for an examination of the personality characteristic openness in individuals with EBDs. Across the literature, openness has had weak to no association with psychopathologies. In a meta-analysis, Kotov, Gámez, Schmidt, and Watson (2010) found “weak and equivocal associations” (p. 804) between these factors. Additionally, Watson and Naragon-Gainey (2014) found no relationship between openness and anxiety (r < .09). In study with children between the ages of 6 and 13, Vreeke and Muris (2012), parents of clinically anxious children ranked their children lower on openness [t(190) = 5.00, p < .001] than parents of the control group.
25
Additionally, openness has not been shown to be correlated with behavioral disorders, in particular ADHD (Jensen et al., 2001; John et al., 1994; Miller, Miller, Newcorn, & Halperin, 2008; Nigg et al. 2002; Parker, Majeski, & Collin, 2004; Ranseen, Campbell, & Baer, 1998) or Oppositional Defiance Disorder (Burke, 2012). For example, Martel, Goth-Owens, Martinez-Torteya, and Nigg (2010) found that students with ADHD (M = 6.05, SD = 1.2) were no more likely to exhibit openness than controls (M = 5.94, SD = 1.1) However, students who described themselves as perfectionistic or obsessive were characterized by high openness, in addition to neuroticism and conscientiousness.
Research, however, has shown weak to moderate correlations with Bipolar Disorder (Bagby et al., 1996; Bagby et al., 1997). In contrast to their results with anxiety, Watson and Naragon-Gainey (2014) did find a weak relationship with bipolar (r = .14; p < .05) along with mania, obsessive intrusions, agoraphobia, and dysthymic disorder. Barnett et al. (2011) also reported a relationship between bipolar and openness (t = 53.9, SD = 11.0, p < 0.001) and Tackett, Quilty, Sellbom, Rector, and Bagby (2008) found openness to be substantially higher in the bipolar group.
Overall, when examining high ability as a potential protective or risk factor for students with EBDs, it is essential to examine how high-ability students differ with EBDs differ from high-ability students without EBDs and from average-ability students with EBDs. It is
particularly important to examine if intelligence in high-ability students functions as a protective factor when coping with adverse childhood experiences.
26
CHAPTER THREE: METHODOLOGY
This study, a secondary analysis of the NCS-A, focused on how disorder rates and services differ between high-ability students (IQ ≥ 120) and average-ability students (85 ≤ IQ ≤115) with Emotional Behavioral Disorders (EBDs). The study was an attempt to find variables that predict increased or decreased disorder rates or service delivery within schools. A
combination of descriptive statistics and binary logistic regression were used to determine disorder rate and odds ratios. Further group comparisons (ANCOVA), beyond those in the logistic regression analyses, were conducted to examine differences within the high-ability group.
Participants
The NCS-A was administered to 10,123 adolescents, age 13-17-years-old, between February 5, 2001 and January 31, 2004. The household sample included a total of 879
adolescents who were currently attending school. The school sample included 9,244 adolescents from schools represented in The National Comorbidity Survey-Replication (NCS-R) study. Adolescents were interviewed face-to-face while parents completed a self-administered questionnaire, with an 83.7% parent response rate for the school sample and 82.5% parent response rate for the household sample (McLaughlin et al., 2012). A total of 5,477 adolescents from the NCS-A (n = 10,488) were included in the analyses for this study. Adolescents were included in this study if they had Adverse Childhood Experiences (ACEs) data on both the adolescent and parent reports; cases with missing data were eliminated. Furthermore, all students with a K-BIT Normed Score (IQ) < 85 and were eliminated. Also, students whose IQ fell
27
analysis) was 130 or above, thereby leaving a total of 5,023 adolescents. The groups were then divided into an average-ability group (n = 4,414) and high-ability group (n = 609).
The sample included 2,402 (47.8%) males and 2,621 (52.2%) females between the ages of 13 and 18, inclusive. Furthermore, the sample included 579 Hispanics (11.5%), 748 Blacks (14.9%), 289 adolescents from other ethnic backgrounds (5.7%), and 3412 non-Hispanic Whites (67.9%). Adolescents were selected from the four major regions of the United States. Overall, 987 (19.7%) of the adolescents were from the Northeast, 1,695 (33.7%) came from the Midwest, 1,544 (30.7%) were from the South, and 797 (15.9%) came from the West. In terms of
urbanicity, the majority of adolescents, 2,058 (41.0%), lived in metro/urban settings, while 1,204 (24.0%) resided in rural settings and 1,761 (35.0%) lived in other urban/suburban settings. Adolescent’s parental education levels included 508 (10.1%) adolescents whose parents who had not graduated from high school, 1,383 (27.5%) who were high school graduates, 1,105 (22.0%) who had completed some college, and 2,027 (40.4%) who were college graduates. Finally, 646 (12.9%) of the adolescents’ parents held an income to poverty line ratio ≤ 1.5, 926 (18.4%) had a ratio ≤ 3.0, 1,714 (34.1%) held a ratio ≤ 6.0, and 1,737 (34.6%) possessed an income to poverty line ratio > 6.0.
Demographics by ability group are shown in Table 1. Overall, sociodemographic
characteristics across groups matched quite well, with variability at 2-3%. However, the average-ability group had slightly more adolescents from the Midwest (34.6%) than the high-average-ability group (27.8%) with the South having slightly more adolescents in the high-ability group (36.1%) than the average-ability group (30.0%). Furthermore, the percentage of college graduates in the high-ability group (52.2%) far exceeded that of the average group (38.7%). In terms of poverty