Network-based models to improve credit scoring
accuracy
1
stBranka Hadji Misheva
Department of Economics and ManagementUniversity of Pavia
Pavia, Italy
branka.hadjimisheva01@universityofpavia.it
2
ndPaolo Giudici
Department of Economics and Management University of Pavia
Pavia, Italy paolo.giudici@unipv.it
3
rdValentino Pediroda
Department of Engineering and Architecture University of Trieste
Trieste, Italy pediroda@units.it
Abstract—Technological advancements have prompted the emergence of peer-to-peer credit services which improve user experience and offer significant reductions in costs. These advan-tages may be offset by a higher credit risk, due to disintermedi-ation and informdisintermedi-ation asymmetries. We postulate that network-based information can be employed as a tool for reducing risks through an improved credit scoring model that increases the accuracy of default predictions. Our research assumption is proven by means of empirical analysis that shows how including network parameters in classical scoring algorithms, such as logistic regression and CART, does indeed improve predictive accuracy.
Index Terms—network-based models, centrality, credit scoring
I. MOTIVATION
Big data analytics refers to the variety of technologies, models and procedures that involve the analysis of big data aimed at revealing insights, patterns of causality and of correlation, and to predict future events (similarly to data science and to its predecessor, data mining: see e.g. Giudici, 2003). Despite the fact that big data analytics is considered a novelty, this technology has been used increasingly by a great variety of financial institutions across the banking, insurance and investment industries. The reasons for such a wide use of this technology is associated with the type of activities which are facilitated by the use of big data analytics, such as the assessment of creditworthiness, the profiling of consumers and the detection of their fraudulent behaviours.
Many FinTech applications rely on big data analytics and, in particular, those based on peer-to-peer (peer-to-peer) finan-cial transactions, such as peer-to-peer lending, crowdfunding and invoice trading. The concept peer-to-peer captures the interaction between units, which eliminates the need for a central intermediary. In particular, peer-to-peer lending en-acts disintermediation by allowing borrowers and lenders to communicate directly, using the platform as an information provider which, among other things, assesses the credit risk of borrowers.
Many factors explain the increasing role of alternative fi-nancial institutions such peer-to-peer lending platforms, in the global world of finance. As these online marketplaces do not manage deposits, they can avoid intermediation costs typically associated with traditional financial services. For instance, most peer-to-peer lending platforms are not required to respect bank capital requirements nor to pay fees associated with state deposit insurance practices, and this allows them to operate with lower costs. Namely, loans approved through peer-to-peer platforms are not accounted in the books of the platform (Serrano-Cinca et al., 2015), thus no particular liability for the credit is required. In addition, the benefits associated with disintermediation are ultimately transferred to both borrowers and lenders (Serrano-Cincaet al., 2015). Explicitly, borrowers benefit because they are able to receive credits at lower interest rates and in some cases with no collateral whereas lenders are incentivized to participate in the market because they can receive higher rate of return on investment due to reduced transaction costs (Jeong et al., 2012 and Emekter et al., 2015). Advancements in information technology have also been a key
force driving the exponential growth of alternative financial service companies. Big data analytics has changed how data is collected, processed, and evaluated which in turn has led to significant reductions in search costs for credit information (Yan et al., 2015). From a regulatory perspective, a key point of interest is whether such credit risk measurements reflect the actual capacity of borrowers to repay their debt. Regulation must be technologically neutral and, therefore, credit risk compliance should be imposed on FinTechs as they are for banks. At the same time, it cannot be so burdensome to disincentivise the growth of alternative financial service provides.
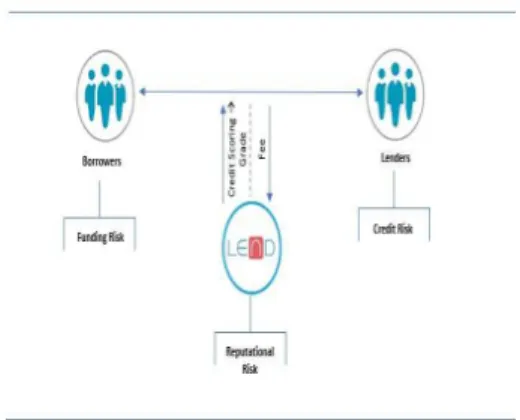
Although there are many existing legislations that are in-tended to serve in the interest of consumer and investor pro-tection, peer-to-peer FinTechs give rise to disintermediation, which requires the need for further protection of consumers and investors. In the case of peer-to-peer lending, there are two main causes of concern: one, these platforms have less information on their borrowers, compared to classical banks, hence are less able to deal with asymmetric information. Economic theory argues that banks represent an institutional solution to the problem of asymmetric information in the credit market between the borrower and the lender (Akerlof, 1970, Myers and Majluf, 1984 and Roure et al., 2016). Namely, banks are able to access detailed information on clients past financial and business transaction which in turn allows them to better discriminate between consumers of different credit risk rank. Second, in most peer-to-peer lending platforms the credit risk is not born by the platform but, rather, by the investors. The differences in risk ownership between the two models are descried in Figure 1 and 2. Both causes lead to a high likelihood that the scoring system of peer-to-peer lenders may not adequately reflect the ’correct’ probability of default of a loan. A further issue associated with the nature
Fig. 1. Bank risk model
of peer-to-peer platforms is that they give rise to globally interconnected networks of transactions. This suggests that they cannot avoid the measurement of systemic risks arising from contagion mechanisms between borrowers. Having these issues in mind, a key risk to measure in the context of novel peer-to-peer lending platforms, is the risk associated with the
Fig. 2. peer-to-peer risk model
default of borrowers, i.e credit risk. Statistical theory offers a great variety of supervised models for credit scoring and credit risk management. Among the most widely used methods are the logistic regression models and decision trees.
In credit scoring, the aim is to classify applicants for credit according to their status: [1=default; 0=not default], which is obtained thresholding the estimated probability of default. In the logistic regression method, the probability of default is estimated by means of a causal model that make the ’logit’ trasformation linearly dependent on a set of explanatory variables. Mathematically:
ln
(
1−pp) =
α
+
βx
i(1)
where p is the probability of a company defaulting andxi
is a vector of borrower-specific financial and non-financial variables. The logistic distribution constrains the estimated probabilities to belong to the range [0,1]. Mathematically, the probability of default will be obtained as:
P D
=
1+e=1a+βx(2)
In the decision trees method, the probability of default is estimated by means of a tree structure, which progressively subdivides observations in classes, according to the values of the explanatory variables. Tree algorithms differ in the way the subdivision if performed, and stopped. The proportion of defaults in each final class represents the estimated probability of default. One of the most widely used tree algorithm is the CART (Classification And Regression Tree), introduced by Braiman (1984).
The above models do not consider interrelationships be-tween borrowers which are typically interrelated, especially when they are all customers of a common peer-to-peer plat-form. In the next section we show how such multivariare nature of credit risk could be taken into account, with the aim of improving predictive accuracy.
In other words, we will investigate whether network infor-mation can improve loan default predictions and further protect lenders, in a financial stability context. This by comparing the predictive performance of two of the most widely used scoring
methodologies with and without the inclusion of network parameters into the econometric specification.
We remark that our work is related to two main other recent research streams. First, some authors have carried out investigations on the accuracy of credit scoring models of peer-to-peer platforms (Serrano-Cinca et al., 2015, Guo et al., 2016 and Serrano-Cinca et al., 2016). We improve these contributions with a more formal statistical testing procedure and, furthermore, with the extension to SME lending. Second, our network-based models work relate to a recent and fast expanding line of research which focuses on the application of social network analysis tools, for the purpose of understanding flows in financial markets, as in the papers of Ferraro and Iovanella (2017) and Giudici and Spelta (2016). We improve these contributions linking network-based models, that are often merely descriptive, with logistic regression and tree models, thus providing a predictive framework. In addition, we extend the application of financial network-based models to a novel field, that of alternative financial service providers.
II. PROPOSAL
As already discussed, peer-to-peer lending platforms are based on a universal, many-to-many business model and have the advantage of an improved data collection on the intercon-nections between different participants. Thus, incorporating network information into the scoring model could potentially improve default forecasting accuracy and thus reduce credit risk exposure.
In line with these developments, we propose to model credit risk of peer-to-peer lending taking advantage of their natural interconnectedness, by means of correlation network-based models, a subset of graphical models that has been introduced in finance to measure systemic risks risk (see e.g. Battiston et al., 2012; Billio et al., 2012; Diebold and Yilmaz, 2014; Arakelian and Dellaportas, 2012, Vrost et al., 2015). This allows to improve the accuracy of credit risk models and, furthermore, to measure a risk type that is particularly evident in peer-to-peer lending: systemic risk, recently applied to bank and sovereign default.
Mantegna (1999) and Mantegna and Stanley (1999) in-troduced graphs into the financial literature as a tool for dealing with the volume and nature of complex interactions and relationships that emerge between economic agents and industries as a whole. Suppose a graph G = (V, E) where vertices V correspond to economic agents, and each edge (i, j) from a set of edges E, corresponds to an interaction between two economic agents i and j. Such a graph would represent the structure of connections between the economic agents. The matrix containing all edges (weights) between the nodes is called adjacency matrix. In classical financial networks, each weight represents financial transactions be-tween the two corresponding nodes. As transactional data are often not available, the adjacency matrix can be substituted by a correlation matrix between the observations (Giudici and Spelta, 2016). Correlation models have been used as a viable alternative to classic network models as they seem to be able
to assess common exposures and complement direct linkages, as discussed in Giudici et al. (2017). In the context of our study, for some financial indicators we have a time series of values for each company included in the sample and, therefore, the correlation between any two of such series represents a correlation between two companies, to be included in the adjacency matrix.
Specifically, if we consider each company to be a node in the network and we associate different time series with different nodes of the network, each pair of nodes can be thought to be connected by an edge with a corresponding weight which will be equal to the estimated correlation coefficient. Put differently, a network of N companies or nodes, can be represented by its derived matrix of weights named an adjacency matrix W, with elementsWij equal to:
w
ij=
T(P txityjt)−(Ptxit)(Ptyjt)√
[TP tx2ij−( P txij)2][TPtyjt−(Ptxit)2)](3)
where n is the number of companies in the sample andxit
andyjtare the realization of a financial ratio for each pair of companies at timet.
Once the adjacency matrix is derived, network statistics can be calculated. Specifically, centrality measures can be obtained using an appropriate singular value decomposition of the adjacency matrix (Giudici and Spelta, 2016). We argue that some network indicators could contain useful information that can improve our understanding of loan default determinants. Taking the correlation coefficient as the weight of an edge linking two companies that operate as borrowers in a peer-to-peer platform, the degree centrality would indicate the total number of nodes with which a node is correlated, relative to the total it could possibly be connected to; whereas closeness highlights the nodes who are able to contact easily all other members of the network. Such information could provide important insights, as the existence of many significant corre-lations between companies could capture the presence of joint, otherwise unobservable factors. Specifically, the existence of a positive statistically significant correlation between two companies can indicate that they have the same buyers or operate in complementary industries or share other business relationships which for us are unobservable. However, the sole fact that an active company is linked with several defaulted or bad-performing companies is something that should be included in the credit scoring model, to improve its accuracy. Indeed we expect that a high connectedness between peer-to-peer borrowers, expressed by a high value of the corresponding correlation coefficients, impacts substantially the probability of loan default.
To introduce correlation networks into logistic regression scoring models, we suggest the following specification:
ln
(
1−pp) =
α
+
βx
it+ Θ
g
it(4)
where p is the probability of a loan defaulting,xitis a vector
of borrower-specific financial and non-financial controls and
In terms of network measurements used in (4), we opt for using only two indicators that have a clear and more intuitive interpretation, which are the degree and closeness centrality. Other summary measures can be considered, and we refer the reader to Giudici and Hadji-Misheva (2018) for a more detailed description.
To introduce correlation networks into decision trees, we take the same variables as further input explanatory variables. It is important to mention that a possible limitation of the above approach is that network measures are conditioned on a chosen balance sheet variable. Often, one variable may not be sufficient to represent interconnections. Ahelegbey et al. (2018) propose a solution to this limitation. Specifically, they apply a latent factor model for credit scoring which in turn allows for a network to be identified based on many financial indicators simultaneously. By representing SMEs which have a applied for a loan to a P2P lending platform as vectors in real space, expressed as linear combinations of orthogonal bases described by singular value decomposition (SVD), orthogonality becomes a metric for classifying the respective SMEs into communities. Ahelegbey et al. (2018), partition all SMEs into two groups (based on their latent positions) such that companies connected to each other belong to the same community. Once the adjacency matrix based on the SVD approach is inferred, the authors estimate and compare the predictive utility of traditional scoring models for connected and not-connected nodes independently. Applying this approach, the authors attempt to replicate the segmentation practices which are an imperative factor of bank’s service offering and main determinant of the accuracy of their scoring models.
The aim of the next Section is to experimentally test our research assumption, that correlation network-based models do improve credit scoring models accuracy.
III. DATA
To test our research assumption, data is collected from mod-efinance, a FinTech company registered by ESMA (European Securities and Markets Authority) as a Credit Rating Agency. Although the company does not operate as a peer-to-peer platform, it provides the global scoring service for investors which in turn is our subject of interest (Ciprian, 2016). The data used in this study is based on official financial information (balance sheets and income statements) which is available through the network of European Chamber of Commerce. To make data consistent between different European countries, financial data has been reclassified to minimize the differences based on different fiscal legislations. Specifically, the analysis relies on data on 727 European-based SMEs covering a period of nine years [2007-2015]. The majority of the companies included in the sample are Italian based enterprises with less than 20 employees and strong focus on manufacturing. The proportion of defaults in the sample is equal to 23%.
IV. APPLICATION
In this section we consider the application of the proposed methods to the available database. We first consider the con-struction of an unsupervised model (the correlation network) and than the build-up of a predictive model which takes into account network centrality measures.
A. Unsupervised Models
One of the most important features of network-based models is that they allows researchers to describe and visualize the relationships that emerge between economic agents which in turn may provide a deeper understanding of underlining dependencies that exist between them. In the context of this study, the networks obtained from correlation matrices allow us to observe key properties of the SME companies included in the sample. Specifically, they allow us to identify the existence of shared, unobserved characteristics between them which in turn can be included in the traditional scoring specification for the purpose of improving credit risk estimations. In order to build the correlation networks, we use three of the most relevant financial ratios observed over a period of 9 years (2007-2015). The ratios observed for the 727 companies are: (i) activity, (ii) solvency and (iii) profitability. Consequently, we derive three 727 x 727 adjacency matrices(W1, W2, W3), with elementswl
ij, are obtained, on the basis of the correlation
matrices for the three time-varying financial indicators (sales over total assets, after-tax income over debt obligations and return on equity), for the 727 SMEs included in the sample. Similar as in other studies (Giudici and Spelta, 2016), instead of using a fully connected network, with all edges present, we consider a more parsimonious network, in which an edge between two nodes (companies) is present on the basis of a pairwise t-test that informs whether the corresponding correlation is statistically significant at a given significance level,α.
Figures 3 shows the network obtained using the activity indicator to calculate correlations and taking a significance level ofα= 0.01. Figure 4 shows the same network, in which, differently from Figure 3, nodes sizes are not equal but, rather, have a size proportional to their degree centrality. In terms of
Fig. 4. Correlation network based on the activity indicator [node size = degree centrality]
the coloring, each node is colored based on their operational status - specifically, companies which have defaulted are colored red whereas active companies are colored green. Fur-thermore, the links between nodes are also colored depending on the sign of the correlation with green indicating a positive correlation coefficient and red indicating a negative correlation coefficient. Figures 3 and 4 clearly show that the network is sparse, indicating that a statistical network can greatly improve interpretation, with respect to a fully connected network. In particular, the Figures suggest that there exist both positive and negative statistically significant correlations, in terms of the activity ratio suggesting that some companies have moved similarly in the observed period (are complementary to each other) while others are diverging, indicating a competitive relationship. Looking at the significance, the existence of many strong statistically links between nodes provides evidence of the existence of joint unobservable factors connecting different SMEs. From a credit risk viewpoint, if an active company is strongly and positively correlated with a defaulted one, its credit scoring should be decreased (contagion effect). Overall, network contagion seem to positively affect default, as the proportion of defaulted companies that are central in Figures 3 and 4 is much larger than the observed proportion of defaults in the sample (23%). Next, we observe the network that emerges when instead of the activity indicator, we use the solvency ratio for the purpose of inferring the links that emerge between companies. The following figures present the corresponding networks. Both Figures 5 and 6 represent the network obtained on the basis of the solvency indicator with the difference that in Figure 6, the size of the nodes represents the degree centrality of each company. Note that a a key point of difference between this network and the one derived based on the activity indicator is that we observe a low presence of defaulted companies in the overall network. Furthermore the few that can be visualized have a very small degree centrality, suggesting that there are less linked with other companies. This can be an indication of unique factors influencing companies solvency, which is reflected in low correlations between de-faulted and active companies. Conversely, what we observed
Fig. 5. Correlation network based on the solvency indicator
Fig. 6. Correlation network based on the solvency indicator [node size = degree centrality]
previously for the activity ratio gives indication of a common, ’cyclic’ or ’market-based’ factor reflected in a high correlation between all companies. In addition, we see a predominant presence of negative, statistically significant correlations which is expected, as companies compete each other in terms of liquidity. Recall that the companies included in this analysis are those small and medium Italian enterprises for which the sources of finance are similar, and rather limited. Therefore, the increased liquidity of one company could mean reduced liquidity for another.
Finally, we consider the network-based models that emerge based on the correlations between companies in terms of return on equity over the considered period. Figure 8 and Figure 9 present the corresponding networks, maintaining the visualiza-tion rules as previously. Looking at Figures 8 and 9, it seems that the correlation network obtained using the return on equity indicator is similar to that obtained with the solvency ratio. There is a limited presence of defaulted companies, and a low correlations between defaulted and active companies, again suggesting the existence of idiosyncratic, rather than system-atic, factors influencing companies’ overall performance and profitability (for more details see Giudici et al., 2018). Finally, we also present the network that emerges if we apply latent factor models as the bases for network inference (for more details see Ahelegbey et al., 2018). Specifically, the following
Fig. 7. Correlation network based on ROE
Fig. 8. Correlation network based on ROE [node size = degree centrality]
figures depict the network structure and the interconnections that emerge between companies included in the sample if we apply the SVD approach. The network presented in Figure 10 and 11 confirms the high interconnection that exists between active and defaulted SMEs and the need for incorporating network information in the default estimations. To summarise,
Fig. 9. Latent Factor Graph of SME companies
the unsupervised modelling conducted indicates the ability of correlation networks to capture credit risk factors which could not be captured by merely including the financial indicators into a classic regression model. Furthermore, it can provide
Fig. 10. Latent Factor Graph of SME companies [node size = degree centrality]
additional insights into the variables that can be employed to monitor contagion between bad performing and good per-forming companies. This is the case for the activity indicator, a systematic factor, affected by stress in the economic cycle, whereas solvency and return on equity are less useful in a system monitoring perspective, being mainly idiosyncratic.
B. Supervised Models
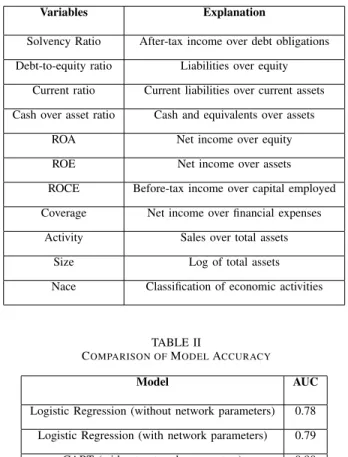
We now test whether correlation network-based models improve the predictive performance of credit scoring models, on the given data. Specifically, we investigate whether adding network centrality measurements in the scoring function can improve the ability of the model to distinguish between defaulted and active companies. To achieve this aim, we add the degree and the closeness centrality measures obtained from the correlation matrix, based on the activity indicator, as potential explanatory variables in the model. The choice of the activity ratio is based on its significance throughout the variable selection process conducted. Additional to the network centrality measurements, the given data includes information on the status of the companies classified as [1 = Defaulted] and [0 = Active], and information on the most important financial and non-financial characteristics of the borrowers. Considering that it is difficult to find a robust set of variables, small number of covariates have been selected based on previous research as well as by means of preliminary analysis. The variables selected are explained in Table 1.
A key point of interest in this study is the evaluation of the predictive accuracy of the traditional financial ratios, for which purpose we consider the estimated area under the ROC curve (AUC) as a measure of predictive performance.The following tables summarizes the results concerning the predictive accu-racy of the baseline methodologies employed in the literature, namely the logistic regression and the CART algorithm, with and without network parameters.
As it is clear from the result presented in Table 2, for both scoring approaches, the inclusion of network parameters increases their predictive accuracy. This in turn points to the existence of significant interdependencies between the compa-nies included in the sample. Hence, the inclusion of network
TABLE I
EXPLANATION OFVARIABLES
Variables Explanation
Solvency Ratio After-tax income over debt obligations Debt-to-equity ratio Liabilities over equity
Current ratio Current liabilities over current assets Cash over asset ratio Cash and equivalents over assets
ROA Net income over equity ROE Net income over assets ROCE Before-tax income over capital employed Coverage Net income over financial expenses
Activity Sales over total assets Size Log of total assets Nace Classification of economic activities
TABLE II
COMPARISON OFMODELACCURACY
Model AUC
Logistic Regression (without network parameters) 0.78 Logistic Regression (with network parameters) 0.79 CART (without network parameters) 0.90 CART (with network parameters) 0.91
parameters captures information common to all borrowers in a cluster of the network or underlying common features that cannot be otherwise observed. To investigate further the importance of the network parameters, we present the full result from the network-based scoring using the logistic estimator.
As it is evident from the presented results, the analysis suggests that the degree and closeness centrality measures are significant predictors of loan default. Interestingly, the degree centrality reports a positive sign suggesting that the higher the degree, the higher the probability of default. In other words, the estimated positive coefficient of the degree centrality indicates that the higher the degree of a particular company, the higher the probability that it would be connected with a defaulted company which in turn impacts its overall probability of default. This provides evidence in favour of our main premise that information on the network or how peer-to-peer participants are connected among each other provides useful insight into issues associated with credit risk management.
V. CONCLUSION
The main purpose of the study is to test the assumption that network-based models improve the predictive performance of
TABLE III
LOGISTIC REGRESSION MODELS WITH LOAN STATUS AS A DEPENDENT VARIABLE
Variable Est(P Value) (1) Est(P Value) (2)
Intercept 0.2603(0.831) 21.04(0.000) Solvency ratio -0.0219 (0.021) -0.031 (0.008)
Current ratio 0.2569 (0.048) 0.4788 (0.008) Cash over assets 0.5999(0.699) -1.846(0.343)
ROA 0.1188(0.000) -0.120(0.000) Coverage 0.0005(0.017) 0.0002 (0.000) Net Income -0.0007 (0.028) -0.001(0.004) Size -0.3983(0.033) -0.742(0.005) Nace 0.0001(0.669) 0.0002 (0.955) Degree centrality 0.0574(0.000) Closeness -3.E+4(0.000) AUC 0.78 0.79
classical credit scoring algorithms.
To this aim we suggest how to build network-based models based on the pairwise correlations between the observed time series of a financial variable that corresponds to different borrowing companies. From such models we extract centrality measures and use them to ’augment’ logistic regression and tree models.
We test our research assumption on data provided by mod-efinance, a credit rating agency that provides scoring services for investors. Our empirical findings indicate that network-based models do improve the predictive performance of credit scoring models, thus confirming our assumption.
Future research include testing whether other types of network, for example based on transactional data, or on social network data, also improve predictive performance of credit scoring models.
VI. ACKNOWLEDGMENT
We thank modefinance for having provided the data and for useful discussion about the interpretation of the results from the paper.
REFERENCES
[1] Akerlof, G. A. (1970). The Market for “Lemons”: Quality Uncertainty and the Market Mechanism. The Quarterly Journal of Economics, 488–500.
[2] Arakelian, V. and Dellaportas, P. (2012). Contagion determination via copula and volatility threshold models. Quantitative Finance, 12(2):295-310
[3] Barrios, L.J.S., Andreeva, G. and Ansell, J. (2013). Monetary and relative scorecards to assess profits in consumer revolving credit, Journal of the Operational Research Society, 65 (3), pp. 443–453.
[4] Battiston, S., Delli Gatti, D., Gallegati, M, Greenwald, B., Stiglitz, J. E. (2012). Liaisons dangereuses: Increasing connectivity, risk sharing, and systemic risk. Journal of Economic Dynamics and Control, 36(8), pp. 1121-1141.
[5] Billio, M. and Getmansky, M. and Lo, A.W. and Pelizzon, L. (2011) Econometric measures of connectedness and systemic risk in the finance and insurance sectors. Journal of Financial Economics, 104, 535-539. [6] Breiman, L., J. Friedman, R. Olshen, and C. Stone, 1984: Classification
and regression trees. Wadsworth Books, 358.
[7] Ciprian M, Pediroda, V. (2016) Rating and Credit Limit: Definition and Background, Finanzdienstleiner der nachsten Generation, Frankfurt School Verlag
[8] Giudici,P., Sarlin. P. and Spelta, A. (2017). The interconnected nature of financial systems: direct and common exposures. Journal of Banking and Finance
[9] Diebold, F.X. and Yilmaz, K. (2014), ’On the Network Topology of Variance Decompositions: Measuring the Connectedness of Financial Firms,’ Journal of Econometrics, 182, 119-134
[10] Emekter, R., Tu, Y., Jirasakuldeeh, B. and Lu, M. (2015). Evaluating Credit Risk and Loan Performance in Online Peer-to-Peer(peer-to-peer) Lending. Applied Economics, 47(1), pp.54-70;
[11] Ferraro, G. and Iovanella, A. (2017). Technology Transfer in Innovation Networks: An Empirical Study of the Enterprise Europe Network. International Journal of Engineering Business Management. 9:1-14; [12] Giudici, P. (2003). Applied data mining. Wiley, London.
[13] Giudici, P. and Hadji-Misheva, B. (2018). Network scoring models for peer-to-peer lending. Submitted paper.
[14] Giudici, P.S., Spelta, A. (2016). Graphical network models for interna-tional financial flows. Journal of Business and Economic Statistics 34 (1), pp. 126-138;
[15] Guo, Y., Zhou, W., Luo, C., Liu, C. and Xiong, H. (2016). Instance-Based Credit Risk Assessment for Investment Decisions in peer-to-peer Lending. European Journal of Operational Research, 246, pp.417-426 [16] Jeong, G., Lee, E. and Lee, B. (2012). Does Borrowers’ Information
Renewal Change Lenders’ Decision in peer-to-peer Lending? An Empir-ical Investigation. Proceeding ICEC ’12 Proceedings of the 14th Annual International Conference on Electronic Commerce.
[17] Myers SC, Majluf NS. (1984). Corporate Financing and Investment Decisions When Firms Have Information that Investors Do Not Have. Journal of Financial Economics, 13(2), pp. 187–221.
[18] Roure, C., Pelizzon, L. and Tasca, P. (2016). How Does peer-to-peer Lending Fit into the Consumer Credit Market. Deutsche Bundesbank. Discussion Paper, no. 30.2016.
[19] Serrano-Cinca, C. and Hutiernez-Nieto, B. (2016). The Use of Profit Scoring as an Alternative to Credit Scoring Systems in Peer-to-Peer Lending. Decision Support Systems, 89, pp.113-122;
[20] Serrano-Cinca, C., Hutiernez-Nieto, B. and Lopez-Palaclos, L. (2015). Determinants of Default in peer-to-peer Platforms.
[21] Vyrost, T., Lyocsa, S., and Baumohl, E. (2015). Granger causality stock market networks: Temporal proximity and preferential attachment. Physica A: Statistical Mechanics and its Applications, 427:262276 [22] Yan, J., Yu, W. and Zhao, L. (2015). How Signaling and Search Costs
Affect Information Asymmetry in peer-to-peer Lending: The Economics of Big Data. Financial Innovation, 1(19), pp. 1-11;

![Fig. 6. Correlation network based on the solvency indicator [node size = degree centrality]](https://thumb-us.123doks.com/thumbv2/123dok_us/9736299.2464634/5.918.540.776.366.537/fig-correlation-network-based-solvency-indicator-degree-centrality.webp)