Procedia Economics and Finance 35 ( 2016 ) 198 – 205
2212-5671 © 2016 Published by Elsevier B.V. This is an open access article under the CC BY-NC-ND license (http://creativecommons.org/licenses/by-nc-nd/4.0/).
Peer-reviewed under responsibility of Universiti Tenaga Nasional doi: 10.1016/S2212-5671(16)00025-3
ScienceDirect
7th International Economics & Business Management Conference, 5th & 6th October 2015
Goods and Services Tax (GST) Compliance among Malaysian
Consumers: The Influence of Price, Government Subsidies and
Income Inequality
Sim Choon Ling
a*, Abdullah Osman
a, Safizal Muhammad
a, Sin Kit Yeng
a, Lim Yi Jin
b aSchool of Business Innovation &Technopreneurship, Universiti Malaysia Perlis, 01000 Kangar, Perlis, MalaysiabOYA Graduate School Business, Universiti Utara Malaysia 06010 Sintok, Kedah, Malaysia.
Abstract
The purpose of this research is to explore the correlation between price, government subsidies and income inequality towards GST compliance. Tax noncompliance remains as global phenomenon that can threaten the integrity of every tax systems hence the understanding of what people want will help to explain public dissatisfaction, heading towards the direction of developing a tax system that stimulate tax compliance in the future. Research findings has revealed that all the selected variables have significant relationship with GST compliance. To conclude, this study has bridged the knowledge in tax compliance literature, providing empirical result on potential determinants of tax non-compliance in Malaysia.
© 2015 The Authors. Published by Elsevier B.V.
Peer-reviewed under responsibility of Universiti Tenaga Nasional.
Keywords: GST; compliance; government subsidies; price; income inequality
1.Introduction
Appropriate mixture of direct and indirect tax has led to long debate in political and academic circle, concerning the virtues and flaws in both forms of taxation structure. By and large, the distinction between direct and indirect taxes can be made easily as the former is levied directly either on personal or corporate income while the latter is levied on the price of goods or services and it is collected via intermediary parties. The adoption or degree of reliance on direct tax versus indirect tax is fundamental towards optimal design of tax structures as different versions
* Corresponding author.
E-mail address: clsim89@gmail.com
© 2016 Published by Elsevier B.V. This is an open access article under the CC BY-NC-ND license (http://creativecommons.org/licenses/by-nc-nd/4.0/).
of tax policies may amend the state economy differently. Neverthless, Atkinson (1977) suggested that taxpayers may grow fond for indirect taxation over direct taxation considering that it offers them choice and it is less evident. Ultimately, the diverse designs of fiscal policies adopted by government tend to demonstrate the goals of efficiency and equity a nation tries to achieve.
Many reasons were put forward in introducing GST among them are due to the dissatisfaction towards the current consumption tax structure, reduction of other taxation rate as well as the existing tax system that has not been able to keep pace with the development of the economy (RMCD, 2013). In early 1990’s, there was an equal contribution
proportionally in revenue between direct and indirect tax however trade liberalization policies which took place has result in the proportion of revenue to change substantially specifically in year 2012 with the contribution of direct tax and indirect tax recorded at 56.4% and 17.2% respectively. In respect of this, majorities of economic experts
claimed that heavily reliance on a on direct tax and petroleum revenue will bring about adverse effect on the nation’s
financial position due to there are only one-tenth of the working population pays income tax in consort with the fluctuation of international petroleum price (Business Council Of Australia, 2014; MIER, 2014). Henceforth, it would seem appropriate for the government to sort out the imbalances and raising its revenue via indirect tax reform which is much stable internally.
Into the bargain, an apparent rise in consumption tax for both developing and transitions countries are observable which has led to a rapid expansion in the trade of goods and services internationally in a globalized economy. European Commission employed QUEST model in replicating the macroeconomic effects of a revenue-neutral shift in taxation from direct to indirect taxes implied that a swing in taxes may indeed strengthen economic growth and increase employment (European Commission, 2006). Similarly, Baunsgaard and Keen (2005) stated that the degree of revenue recovery via domestic consumption taxes are generally effective for middle and high-income countries however it is substantially less efficient for low-income countries. In the same vein, previous findings revealed that the degree of revenue recovery via consumption taxation is generally effective for middle and high-income countries, bringing about dynamic efficiency gains and significant growth effects (Kim, 1998; Dahlby, 2003; Li & Sarte, 2004). Giving the fact that taxes on consumption are paid by final consumer thus it is not intended to let the businesses to bear the burden of the tax itself or add cost to businesses operation (RMCD, 2013; Ikpe & Nteegah, 2013). Concisely, it is pivotal for the Malaysia government to replace foreign aid flows with domestic tax revenues as the former are not a reliable long term source of development financing.
2.Literature Review
Mclure (1989) claimed that policy makers should consider and concern on the macroeconomic impact of VAT/GST particularly in prices, income and consumption along with its output before considering its adoption. In the same vein, GST was renowned for its smooth take-off in New Zealand at the time of its introduction back in year 1986, the Minister of Finance at that time Roger Douglas has pointed out, “Traders who would be collecting GST had to be assured they could ‘cope’ with the new tax (James & Alley, 2008).” In respect of this, Tajudin (2014)
revealed that the capability of minimum household income or the less well-off families in their purchasing power to absorb shocks as a result from GST implementation in Malaysia has not reached. The author also stressed on the rise in the cost of living is not on an equal footing with salary increment. Additionally, the household debt by end-December year 2013 was recorded at the amount of RM 854.3 billion which is equivalent to 86.8 percent of GDP, making Malaysia the most heavily indebted nation in Asia (Tajudin, 2004). Subsequently, this will bring about the impact of macroeconomic shocks on household debt-servicing capacity and vulnerability for municipal to encounter monetary tightening prior to GST. Nevertheless, Nichita and Batrancea (2012) suggested that assessing the determinants is the prerequisite for increasing tax compliance.
2.1.Tax compliance
James and Alley (2004) defined that tax compliance as the willingness of individual and other taxable entities to act accordingly along with the letter of tax law and administration without the application of enforcement activity. In
the same vein, Nkwe (2013) claimed that tax compliance is the degree in which a taxpayer obliges to tax rules and regulation. Likewise, Wearne (2013) claimed that the drivers of GST compliance is to perceive GST to be legitimate, fair and it is morally ‘the right thing to do’. Olivia (2011) claimed that attitudes and perceptions are
influenced by the fairness of the tax system, if the tax systems are found to be unfair tax compliance will be lower. Above and beyond, Kirchler (2007) revealed that the determinants of tax compliance can be divided into three categories as socio psychological, economic and political determinants and those factors vary from one country to another as well as from one individual to another specifically taxpayers’ perception, motivations such as rewards, punishment such as penalties, cost of compliance, enforcement, demographic factors, size of income and so on.
2.2.Price
The rising cost of living is the key concern of the members of public since they are concerned over the after-tax prices of goods and services. As estimated there are 90 percent of Malaysian that are currently not within the taxed category will have to pay GST for their daily consumption (Institute Rakyat, 2014). Into the bargain, the prices for categories of goods and services that fall in the CPI basket such as education, health, recreation and culture, food and non-alcoholic beverages and food away from home are expected to increase owing to the current treatment of these goods and services are not subjected to sales tax or service tax (RMCD, 2013). Varquez,Vulovic and Liu (2009) revealed that a shift from direct to indirect taxation in the short run will results in an increase of prices. Previous studies implied that GST has a significant and positive impact on price, however, it is momentary (Valadkhani, & Layton, 2004; Ikpe, & Nteegah, 2013; Gautier, & Lalliard, 2014). On top, Ikpe et al. (2013) claimed that there are businesses who are taking advantage over the existence of VAT/GST to increase the price of goods and services. Alabede and Ariffin (2011) mentioned that the financial condition of individual might positively or negatively affect his willingness to comply in tax as poorer consumers are more attentive to taxes on necessities such as food or energy due to it makes up larger proportion of their budget (Leicester, Levell, & Rasul, 2012). On top, people on fixed income including majority elders and less well-off publics are vulnerable to high inflation as inflation tends to erode their value income, savings or even social benefits such as pensions money. Bloomquist (2003) indicated taxpayers with limited financial resources have higher tendency to be non-compliant as compared to those taxpayers in sound financial condition. Similarly, Torgler (2003) claimed that individual financial situation may lead to a sense of distress especially when payment is to be made including taxes, perceiving the payment of tax as a strong restriction. Oberholzer (2007) claimed taxpayers financial hardships tend to contribute to non-tax compliance behavior. Besides, taxpayers with financial strain may be tempted to evade if their household expenses exceed income hence bring about the growing dissatisfaction in the tax system (Elffers, 1991). Kaplan (2002) mentioned that a regressive tax places a greater burden on consumers as their income declines thus may lead to confer a sense of unfairness towards the tax. On top, Murphy (2003) suggested the perception of unfair tax burdens can influence
taxpayers’ point of view in paying tax to such an extent their compliance behavior. Furthermore, taxpayer dissatisfaction may arise from the burden of the tax system and the perception of the public in the value of goods and services received is less than taxes paid (Bloomquist, 2003). Based on the previous findings, it is hypothesized that;
H1: There is a negative relationship between price and GST compliance. 2.3.Government Subsidies
Government subsidies, a benefit given to the people which may be in the form of financial transfer or various
form of compensation packages such as direct spending on the poor which could immediately increase the poor’s
disposable income, public good, welfare alike system and so forth. The provision of government subsidies prior to GST implementation has raised the concern over the after impact of unconditional cash transfers which has the tendency in creating a culture of government dependency. In the same vein, Atkinson (1999) implied that great reliance on such programs have the tendency to generate poverty traps and welfare dependency. In spite of that,
Smith (1992) in his study claimed that positive incentives tend to increase citizen’s commitment to tax compliance.
Similarly, previous studies revealed that positive inducements as reward or public good have a significant and positive impact on compliance (Alm, Jackson & McKee, 1992; Bordignon 1993). Likewise, Alm, McClelland and
Schulze (1992) denoted that compliance occurs when individuals appreciate the government provision of public goods financed by their tax payments. Into the bargain, McKerchar (2003) suggested that welfare alike systems should be designed to convince the taxpayers that their hard-earned money are being wisely spend by the government and that they should feel positive about their contribution thus leading to increase in tax compliance. Likewise, Torgler (2003) claimed that taxpayers are more inclined to comply with the law if the exchange between the paid tax and performed government services are found to be equitable. In the same vein, Blackwell (2007) stated that the benefits attain from public goods have a positive effect on tax compliance. Similarly, Alm et al. (1999)
suggested that government can increase compliance by offering ‘goods’ that is preferred by members of public. Ultimately, Leicester, Levell and Rasul (2012) indicated social preferences may influence to which people support the redistribution policies. Based on the previous findings, it is hypothesized that;
H2: There is a positive relationship between government subsidies and GST compliance. 2.4.Income Inequality
Unequal distribution of household or individual’s income across the various participants within an economy is
referred as income inequality. Wilkinson (2005) claimed that regressive effect of GST has a considerable impact on the real income of different income group, leading to the scenario of people struggle to make ends meet will only to add on to the perceptions that inequality will get worst. Economist Joseph Stiglitz, a Nobel Prize winner in his book
“The Price of Inequality” said that too much inequality may lead to a perception that the system is unfair subsequently a widespread of mistrust towards the government. Back in year 1974, Spicer revealed that there is positive relationship between perceived inequality and tax evasion in tax systems. In the same vein, Torgler (2003) stated tax evasion can be driven by perceived injustices or inequalities in the tax law. Likewise, Amiel and Cowell (1992) claimed taxpayers will reduce tax evasion when perceiving equity. As suggested by Bloomquist (2003) if the tax system negatively impact taxpayer’s financial status thus it may lead to tax evasion or lowering the tax compliance. Besides a similar finding by De Juan, Lasheras and Mayo (1994) stated if a specific group perceives its tax burden as heavier than another group, tax non-compliance is likely to increase. Above and beyond, Lister (2007) illustrated that high levels of inequality may bring about the sense of fatalism and disengagement from political processes. In the same vein, Bloomquist (2003) in his study via estimated regression coefficients revealed that the widening of income inequality will contribute to the tendency to tax evasion by both opportunity and motive to evade. Furthermore, the author also suggested that the growing inequality may bring about greater number of taxpayers to regard evasion as an acceptable response to the government, imposing it as taking away the tax burden on its citizen. Into the bargain, European Union economists claimed that there is positive correlation between evasion activity and inequality as the widening of inequality will lead to more evasion thus less compliance on tax (Bloomquist, 2003). To boot, Falkinger (1995) pointed out individuals tend to reduce evasion if the socio-economic system is considered to be relatively equal and fair. Based on the previous findings, it is hypothesized that;
H3: There is a negative relationship between income inequality and and GST compliance.
3.Methodology
Explanatory research design allows the researcher to examine the extent in which two or more variables co-vary as in the changes in one variable are reflected in the changes of another (Creswell, 2008). Explanatory correlation study is employed for the purpose of this study to explore the relationship between price, government subsidies and income inequality towards GST compliance. Moreover, quantitative research is well accepted in the social science to gather data that reduced the data into number, putting a test on pre-determined hypothesis via numerical analysis.
3.1.Measurement
For this study 4-point Likert scale was employed (1 = strongly disagree; 4 = strongly agree) to examine how strongly the respondents agree or disagree with the items, eliminating possible misinterpretation of mid-point. This
is mainly due to even-numbered Likert scale tends to force respondent to choose sides since the neutral option is not available whereas the odd-numbered Likert scale provides an option for neutrality. A recent study denoted that the overall difference between 4-point and 5-point Likert scale is negligible (Losby, & Wetmore, 2012).
3.2.Sampling and Data Collection
The primary data was collected in Penang state since people who lives in cities have distinctive consumption behavior as they tend to consume more, exposing themselves more on taxable goods and services. Respondents chosen for this study are comprised from various backgrounds since consumption tax ultimately affects everyone hence all parties are eligible to voice out their opinion. Nevertheless, experts may be prejudice and parochial thus instead of seeking out views from the niche society, an equal opportunity given to all parties may come out with more fairer and accurate findings. For this study, there were 400 sets of questionnaires distributed via convenience sampling however only 357 sets of usable questionnaires were received, giving a respond rate of 89 percent.
4. Analysis and Findings
4.1. Reliability Analysis
Reliability analysis was performed to make certain all the dedicated items in each of the variable are capable of providing consistent results cross time. Table 1 illustrated that the price has the highest Cronbach’s alpha coefficient
(0.927) and this is closely followed by GST compliance which is 0.916. Subsequently, the Cronbach’s Alpha for
government subsidies and income inequality is 0.877 and 0.864 respectively. As suggested by Sekaran (2003),
Cronbach’s alpha coefficient for variables ranged above 0.8 indicated a good and excellent instruments.
Table 1. Summary of Reliability Analysis.
Variables Cronbach's Alpha
GST Compliance .916
Price .927
Government Subsidies .877
Income Inequality .864
4.2. Correlation Analysis
Correlation coefficient is employed to describe and measure the degree and strength of linear association between
variables. Pearson’s correlation (r) coefficients ranging between -1.00 and +1.00 with positive numbers used to
identify a positive relationship and vice versa. The closer a Pearson’s r value to 1 the stronger the relationship
between the two variables. For this study one-tailed test is employed to test the statistical significance in one direction of interest since there is a prior hypothesis as to the sign of correlation (UCLA, 2014). Table 2 illustrated that all the variables are significant at 0.01 level.
Table 2. Summary of Correlation Analysis.
GST compliance Price Government Subsidies Income Inequality GST Compliance 1 -.476** .286** -.544**
Price -.476** 1 -.182** .688**
Government Subsidies .286** -.182** 1 -.136** Income Inequality -.544** .688** -.136** 1 **. Correlation is significant at the 0.01 level (1-tailed).
Pearson’s correlation (r) between price and GST compliance has suggested that there is significant moderate negative relationship (r = -0.476) which implied that an increase (decrease) in price will lead to decrease (increase) in GST compliance. Subsequently, correlation analysis indicated that there is significant but weak positive relationship between government subsidies and GST compliance (r = 0.286). Ultimately, this study revealed that there is a relatively significant moderate negative relationship (r = -0.544) between income inequality and GST compliance which denoted that the widening of income inequality will lower compliance on GST.
4.3. Multiple Regression Analysis
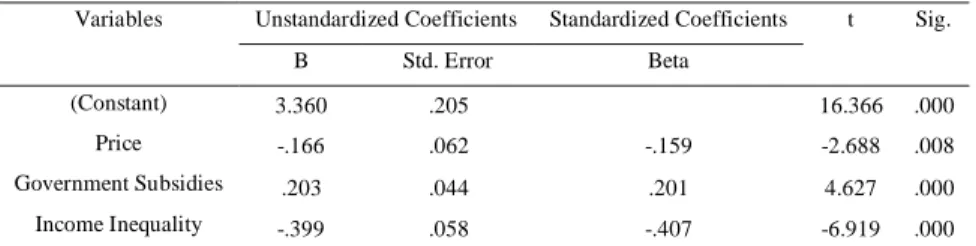
Regression analysis is a statistical tool for investigating both the degree and characteristic of relationship between a dependent variable and one or more independent variables. For this study, the hypothesized relationships were tested using computed regression analysis. Table 3 illustrated that the R2 value for three independent variables
embedded in the regression model is 0.355, suggesting that approximately 35 percent of the variation in GST compliance was explained by the selected independent variables. As computed the F value is 64.813 and significant at 0.000, thus it can be concluded that the regression model is fit and statistically significant. At α = 0.05 level of
significance, there exist enough evidence to conclude the slope of the regression line is not zero hence all the independent variables are useful as a predictor for GST compliance. Based on the findings,it can be concluded that all three proposed hypotheses H1, H2 and H3 were supported. Moreover, standardized coefficients (β) enable the
disclosed of outcome for each independent variable on the dependent variable in standard deviations, comparing the degree of magnitude among the independent variables. Based upon the β values income inequality is the most
noteworthy factor to have influence for compliance on GST (-0.407). Next, the second determinant for GST compliance is government subsidies (0.201) and this is followed by price with β value of -0.159.
Table 3. Coefficient.
Variables Unstandardized Coefficients Standardized Coefficients t Sig. B Std. Error Beta (Constant) 3.360 .205 16.366 .000 Price -.166 .062 -.159 -2.688 .008 Government Subsidies .203 .044 .201 4.627 .000 Income Inequality -.399 .058 -.407 -6.919 .000 R2 = 0.355; Adjusted R2 = 0.350; F Change = 64.813
5. Discussion and Conclusion
The research findings indicated that price has significance correlation (Sig t = 0.008) and a moderate negative
linear relationship (Pearson’s r = -0.476) with GST compliance. Based upon the regression analysis computed, price
(β = -0.159, t = -2.688, p<0.05) was found significance and negatively correlated with GST compliance. Ultimately, research findings suggested that the public is responsive towards the after-tax price of goods and services and it has significant and negative impact on GST compliance hence the hypothesis H1 is accepted and it is consistent with the
previous studies. Above and beyond, research findings revealed that government subsidies have significant value of 0.000 and a Pearson’s r of 0.286 thus this can be concluded that there is statistically significance weak positive relationship between government subsidies and GST compliance. Likewise based on the regression analysis computed, government subsidies (β = 0.201, t = 4.627, p<0.05) was found significant and positively associated with GST compliance. In short, research findings indicated that people support the allocation of government subsidies and it has significant and positive impact on GST compliance. To conclude, the hypothesis H2 is accepted and it is
consistent with the previous findings. Last of all, regression analysis revealed that income inequality is statistically significance (Sig t= 0.000) towards GST compliance and with Pearson’s r value of -0.544 hence it can be concluded that there is a moderate negative relationship existed between income inequality and GST compliance. Additionally, computed regression analysis implied that income inequality was found substantial and negatively related to GST compliance (β= -0.407, t= -6.919, p<0.05) which suggested that income inequality has significant and negative
impact on GST compliance. Hereby, it is to conclude that the proposed hypothesis H3 is accepted and it is consistent
with the previous studies.
The present paper was conducted to examine the factors that have influence on GST compliance. This study revealed that all the selected variables have significant correlation with GST compliance, indicating the effort of government could adopt to raise public’s compliance over the new indirect tax. To boot, this research will allow the policy makers in making a step closer to understand the voice of people, heading towards developing a tax system that stimulate tax compliance in the future. Nevertheless, government needs to take necessary approaches such as greater openness and transparency in order to gain support from the members of public. Future recommendation in this field of study is that researchers may employ hierarchical regression analysis to examine respondents’ demographic as a moderating effect towards public’s acceptance and compliance towards tax. As computed R2
showed that there was only 35.5 percent of variation in dependent variable which is explained by the sets of independent variables selected hence this would suggest that there are other factors which may influence GST compliance such as social norm, taxpayer’s moral value, knowledge on taxation, trust in political and legal system, complexity of tax system and so forth. Overall, a revised of the model may come out with a better overall model fit. To boot, the authors recommended that this study should be replicated in a different and diverse population as instead of collecting the data primarily restrictive to Penang state this survey should be expanded throughout Malaysia to obtain a more generalized findings. Ultimately, no one enjoys paying taxes; however one must realized that taxes are essential in funding the public goods and services. To conclude, policy makers should not neglect the significance of tax compliance literature since tax non-compliance remains as global phenomenon that affect the integrity of any tax system.
Acknowledgements
The authors would like to thank Penang state community for their participation in this study.
References
Alm, J., McClelland, G. H. & Schulze, W. D., 1992. Why Do People Pay Taxes? Journal of Public Economics 48, 21-48.
Alm, J., McClelland, G. H. & Schulze, W. D., 1999. Changing the Social Norm of Tax Compliance by Voting, KYKLOS, 48, 141-171. Amiel, Y., & Cowell, F. A., 1992. Measurement of income inequality, Experimental test by questionnaire. Journal of Public Economics, 47, 3-26. Atkinson, A.B., 1977. Optimal Taxation and the Direct versus Indirect Tax Contorversy. The Canadian Journal of Economics/Revue, 10(4),
590-606.
Baunsgaard,T.,& Keen, M., 2005. Tax revenue and (or?) Trade Liberalizatiom. IMF Working Paper 05/112.
Blackwell, C., 2007. A Meta-Analysis of Tax Compliance Experiments, International Center for Public Policy, Working Paper Series at Andrew Young School of Policy Studies, Georgia State University.
Bloomquist, K. M., 2003. U.S. Income Inequality and Tax Evasion: A Synthesis. Tax Notes International 31(4), 347-367. Bordignon, M., 1993. A Fairness Approach to Income Tax Evasion. Journal of Public Economic, 52, 345-362.
Business Council of Australia, 2014. The future of tax: Australia’s current tax system. http://www.bca.com.au/docs/7e95f393-b2e1-416a-8af7-977205c4b93e/Future_of_Tax_Australias_Current_Tax_System_FINAL_11.9.2014.pdf
Creswell, J. W., 2008. Educational research: Planning, conducting, and evaluating quantitative and qualitative research. Upper Saddle River, NJ: Pearson/Merrill Education.
Dahlby, B., 2003. Restructuring the Canadian tax system by changing the mix of direct tax and indirect tax. In H. Grubel, Tax Reform in Canada: Our path to Greater Prosperity, Vancouver British Columbia Canada: The Fraser Institute, 77-108.
De Juan, A., Lasheras, M. A., & Mayo, R., 1994. Voluntary Tax Compliant Behavior of Spanish Income Tax Payers. Public Finance, 49, 90-105. Elffers, H., 1991. Income Tax Evasion: Theory and Measurement. Erasmus University Rotterdam, Kluwer.
European Commission, 2006. Macroeconomic effects of a shift from direct to indirect taxation: A simulation for 15 EU Members States, note presented by the European Commission services (DG TAXUD) at the 72nd meeting of the OECD Working Party No.2 on Tax policy Analysis and Tax Statistic, Paris, 14-16.
Falkinger, J., 1995. Tax Evasion, Consumption of Public Goods and Fairness. Journal of Economic Psychology, 16, 63-72. Gautier, E., & Lalliard, A., 2014. How do VAT changes affect inflation in France? Quarterly Selection of Articles, 32.
Ikpe, M., & Nteegah, A., 2013. Value Added Tax and price stability in Nigeria: A partial equilibrium analysis. European Journal of Government and Economics, 2(2), ISSN: 2254-7088.
James, S., & Alley, C., 2008. Successful tax reform: The experience of value added tax in the United Kingdom and goods and services tax in New Zealand. MPRA Paper No. 19858.
Kaplan, J., 2002. Elasticity. http://spot.colorado.edu/~kaplan/econ2010/section4/section4-main.html.
Kim, S. J., 1998. Growth effect of taxes in an endogenous growth model: To what extent do taxes affect economic growth? Journal of Economic Dynamics and Control, 23, 125-158.
Kirchler, E., 2007. The economic psychology of tax behavior. Cambridge: Cambridge University Press.
Leicester, A., Levell, P. & Rasul, I., 2012. Tax and benefit policy: Insights from behavioural economics. The Institute for Fiscal Studies, ISBN: 978-1-903274-91-0.
Li & Sarte, P. D., 2004. Progressive taxation and long-run growth. American Economic Review, 94(5), 1705-1716.
Lister, R., 2007. The real egalitarianism? Social justice “After Blair” in G. Hassan (ed.). After Blair London: Lawrence Wishart.
Losby, J., & Wetmore, A., 2012. CDC Coffee Break: using Likert Scales in Evaluation Survey Work. National Centre for Chronic Disease Prevention and Health Promotion.
Malaysian Institute of Economic Research, 2014. Malaysian Economic Outlook, MEO4Q13. http://www.mier.org.my/outlook/archives/000119.html.
Mclure & Charles E. J., 1989. Income distribution and tax incidence under VAT, Gillis, Makolm, Carl S. Shoup and G. P. Sicat (eds) Value and Taxation in Developing Countries. Washington D.C.: The World Bank.
Murphy, K., 2003. An Examination of Taxpayers’ Attitudes towards the Australian Tax System: Findings from a Survey of Tax Scheme Investors. Australian Tax Forum, 18, 209-242.
Nichita, R. A. and Batrancea, L. M., 2012. The Implications Of Tax Morale On Tax Compliance Behavior. Annals of Faculty of Economics, 1(1) , 739-744.
Nkwe, N., 2013. Tax Payers’ Attitude and Compliance Behavior among Small Medium Enterprises (SMEs) in Botswana. Business and Management Horizons, ISSN 2326-0297, 1(1).
Olivia, N., 2011, The Factors Influencing Attitudes of Namibian Taxpayers Towards Taxation. Thesis Dissertation, Faculty of Economic and Management Sciences. University of Pretoria.
Scholz, J. T., & Lubell, M.,1998. Adaptive political attitudes: Duty, Trust, and Fear as Monitors of Tax Policy. American Journal of Political Science, 42(3), 903-920.
Sekaran, U., 2003. Research methods for business: A skill-building approach (4th ed.). Hoboken, NJ: John Wiley & Son.
Smith, K. W., 1992. Reciprocity and Fairness: Positive Incentives for Tax Compliance, in: J. Slemrod (ed.), Why People Pay Taxes, Tax Compliance and Enforcement. University of Michigan Press: Ann Arbor.
Spicer, M. W., 1974. A Behavioral Model of Income Tax Evasion. Dissertation, Ohio State University.
Tajudin, A., 2014. Institute Rakyat Policy Brief 1: GST. http://www.institutrakyat.org/wp-content/uploads/2014/04/IR-Policy-Brief-GST-lo.pdf. Torgler, B., 2003. Tax morale: Theory and analysis of tax compliance. Unpublished doctoral dissertation, University of Zurich, Switzerland. UCLA, 2014. “What are the difference between one-tailed and two-tailed tests?” Institute For Digital Research and Education.
http://www.ats.ucla.edu/stat/mult_pkg/faq/general/tail_tests.htm.
Valadkhani, A. & Layto, A. P., 2004. Quantifying the Effect of GST on Inflation in Australia’s Capital Cities: An Intervention Analysis, Australian Economic Review, 37(2), 125-38.
Varquez, M. J., Vulovic, V., & Liu, Y. Z., 2009. Direct versus Indirect Taxation: Trends, Theory and Economic Significance. International Studies Program Working Paper, 09-11.