Conference papers
School of Computing
2019-09-22
Eavesdropping Hackers: Detecting Software Vulnerability
Eavesdropping Hackers: Detecting Software Vulnerability
Communication on Social Media Using Text Mining
Communication on Social Media Using Text Mining
Susan McKeever
Technological University Dublin, [email protected]
brian keegan
Technological University Dublin, [email protected]
Andrei Quieroz
Technological University Dublin, [email protected]
Follow this and additional works at: https://arrow.tudublin.ie/scschcomcon
Part of the Data Science Commons
Recommended Citation
Recommended Citation
Queiroz, A., Mckeever, S. & Keegan, B. (2019) "Eavesdropping Hackers: Detecting Software Vulnerability Communication on Social Media Using Text Mining", The Fourth International Conference on Cyber-Technologies and Cyber-Systems (Cyber 2019), Porto, Portugal.
This Conference Paper is brought to you for free and open access by the School of Computing at ARROW@TU Dublin. It has been accepted for inclusion in Conference papers by an authorized administrator of ARROW@TU Dublin. For more information, please contact
[email protected], [email protected], [email protected].
This work is licensed under a Creative Commons Attribution-Noncommercial-Share Alike 3.0 License
Eavesdropping Hackers: Detecting Software Vulnerability Communication on Social
Media Using Text Mining
Andrei Lima Queiroz
Applied Intelligence Research Centre Technological University Dublin
Susan Mckeever
Applied Intelligence Research Centre Technological University Dublin
Brian Keegan
Applied Intelligence Research Centre Technological University Dublin
Abstract—Cyber security is striving to find new forms of pro-tection against hacker attacks. An emerging approach nowadays is the investigation of security-related messages exchanged on Deep/Dark Web and even Surface Web channels. This approach can be supported by the use of supervised machine learning models and text mining techniques. In our work, we compare a variety of machine learning algorithms, text representations and dimension reduction approaches for the detection accu-racies of software-vulnerability-related communications. Given the imbalanced nature of the three public datasets used, we investigate appropriate sampling approaches to boost detection accuracies of our models. In addition, we examine how feature reduction techniques, such as Document Frequency Reduction, Chi-square and Singular Value Decomposition (SVD) can be used to reduce the number of features of the model without impacting the detection performance. We conclude that: (1) a Support Vector Machine (SVM) algorithm used with traditional Bag of Words achieved highest accuracies (2) The increase of the minority class with Random Oversampling technique improves the detection performance of the model by 5% on average, and (3) The number of features of the model can be reduced by up to 10% without affecting the detection performance. Also, we have provided the labelled dataset used in this work for further research. These findings can be used to support Cyber Security Threat Intelligence (CTI) with respect to the use of text mining techniques for detecting security-related communication.
Keywords–cyber security threat intelligence; software vulnera-bility; machine learning; text mining; social media, hacker com-munication.
I. INTRODUCTION
There is no guarantee that we are using software products free of vulnerabilities. Some vulnerabilities are built in to software products and can remain unknown or dormant for long periods. In recent years, significantly large data breaches have been associated with vulnerabilities on companies soft-ware assets. For instance, a data breach on the Equifax credit company, which is believed to have originated from an exploitation of a vulnerability on Equifax defence applications after being shared (or sold) on Dark Web underground forums [1]. This issue affected the private information of more than 140 million people. Another example of such a problem was found in the Facebook web application, which affected the data of 50 million users. This time, the flaw was found in a feature called”View As”, which allowed a hacker to exfiltrate users access token. The bug responsible for this vulnerability was introduced within the application around July 2017 and
was discovered by the companys software engineers almost one year later [2].
Although considerable work has been carried out during the software engineering lifecycle in order to address vulnerability issues, we still remain exposed to vulnerable products without knowing. As a result, many of these vulnerabilities can go undetected, unpatched or exploited for long periods of time. We, the software users, have no knowledge if hackers have found these issues before they were made public.
In the age of information, criminals are taking advantage of the communication channels on social media to either sell hacker tools or promote cyber-attacks against enterprise assets [3][4]. Hackers can buy and sell products that might be used to take advantage of these vulnerabilities or use these channels to exchange and learn how to take advantage of such vulnerabilities. However, it is not just black hat hackers who are part of this system. There are white hat hackers using social media, particularly Twitter, to inform the users and software vendors about the problems found [5].
In order to use this information to act proactively against such threats, researchers are focusing on supervised machine learning classification models for detecting malicious conver-sations on social media and specialised on-line hacker com-munities. This type of research is experiencing considerable growth within the cyber security domain as machine learning approaches for text are changing and improving rapidly with the availability of rich distributed representation models for words and sentences such as word2vec, sentence2vec. How-ever, some studies fail to follow appropriate structured methods to build, evaluate and improve these models. Another issue identified is that there is a lack of labelled data (gold standard) for this type of research, which makes it difficult to compare the classification performance of models applied to the same problem.
With this in mind, this research proposes to: (1) Identify the features, classifiers and practices that gives best detection accurancies for software-vulnerability-related communication in on-line social media channels; (2) Using appropriate tech-niques to address the inherent imbalance of datasets, which has a higher proportion of negative instances (non-malicious communication) than positive instances (malicious communi-cation); (3) Using appropriate strategies to address the high feature dimensionality inherent from the textual nature of the social media user content, which includes document frequency reduction, feature selection and features extraction; and (4)
Apply robust labelling strategies so that the datasets used here can be used for further research in this field.
The core contribution of this paper is to conduct an empirical comparison of text mining techniques for improving Cyber Security Intelligence (CTI) so as to act proactively against exploitation of software. Other research work on this subject has used a smaller number of datasets to compare their findings. In our approach, we use three different datasets from different sources (Surface Web, Deep Web and Dark Web). Also, the term software in the context of this work, is used in a broad context, which refers to all type of computer programs ranging across the software layers and found in any computer-like devices, such as web servers, embedded system, mobile phone, cars, ATM, network protocols.
The structure of this paper is as follows: Section 2 discusses related work in the area of text mining and cyber security. Section 3 explains our approach for this work, the techniques to be applied and the datasets used. Our experimental work and results are presented in Section 4, with conclusions and future work in Section 5.
II. RELATED WORK
Some works have been using similar techniques to inves-tigate hacker forums and other social media. Nunes et al. [6] proposed one of the first works that address the use of classification models to detect malicious hacker communica-tion in on-line communities. Their model has reached good performance in terms of recall, 92% for forums and 80% for products in marketplaces by using semi-supervised co-training technique and SVM. In more recent work, Deliu et al. [4] used the same SVM algorithm to determine which messages are
relevant andirrelevant for cyber security and, on top of that, they used the Latent Dirichlet Allocation (LDA) unsupervised method to cluster the posted messages in topics, such as leaked credentials, malicious server, virus and malware.
In a similar way Cherqi et al. [7] have used supervised learning approach to detect hacker related and non-hacker related content in marketplaces on Dark Web forums. The authors have used some domain-specific features such as price, origin, destination and rating of products to increase the performance of the model. These type of features are specific to Dark Web marketplaces and it is not easily found on other social media platforms metadata or post content. For this reason, we have decided to use only word features as they can be applied to all datasets used in this work.
A problem we have identified in the area of text min-ing/classification for cyber security is the lack of consistent labelled datasets. Existing work relies on labelling annotation done by key-word matching where the ambiguity of the messages and subjectivity is not addressed [4][8]. In our work, we have decided to address this issues by labelling all instances three times with different people. In the end, the final label has been assigned by the majority of votes.
Another issue with these works is that they generally lack on presenting more information about the distribution of instances in each class, whether it is imbalanced or not. This issue has a direct effect on the classification performance of the model [9]. As a result, it makes harder to reproduce the experiment and to perform a comparison among other models.
Finally, we want to highlight that these works have a broad goal in terms of detecting malicious hacking, including carding, data breach, DDoS, whilst our proposed work has a more specific focus on software-vulnerability related commu-nication.
III. APPROACH
In this section, we explain the methodology and techniques used to perform the creation of the classification models. Also, we describe the data and the methodology to provide the labels (categories) for each instance of the dataset.
A. Datasets
The three datasets used in this work are referred to as D1, D2 and D3 for the remainder of the paper. The original data for D1 and D3 is publicly available in [10][11], while D2 was first used in [12]. These datasets represent social media message boards from surface, Deep Web and Dark Web, including forum, micro blogs, and market place. All content is related to communication regarding technical and personal references to computing, security, internet services, and technology. Among these messages, we identify that few are related to malicious activities in software products or have mentioned security problems (flaws, vulnerabilities).
A summary description of each original dataset is described below:
D1 - CrackingArena Forum - This is one of the largest hacker forums existing in 2018 with 44,927 posts and 11,977 active users. It contains communication related to security issues in computing, which makes the data suitable to cyber security research on the interaction patterns among cyber criminals. The variety of covered topics in the forum ranges from social engineering, cracking/exploit tools to tutorials, which makes this forum a viable source for pinpointing the characteristics of newly emerged hacker assets. The posts in this forum date from 8/4/2013 to 24/2/2018 and is available on [10].
D2 - Security Experts - The data contains posts from 12 security-expert users on Twitter. Six of them are part of the well-known-security experts with average number of followers of 18,800, and the other six are part of the lesser-known security experts, with an average number of followers of 1,100. Their tweets are mostly related to security aspects of technology, including software vulnerabilities and hacking. The collected tweets have a one year range from early March 2016 to early March 2017. The total number of Tweets gathered is 11,833.
D3 - Dream Market- With 91,463 posted products from 2,092 sellers in 2016, this is a well-known market place for selling illegal products, such as illicit drugs, fake IDs, stolen credit card numbers and copyrighted software. It also advertises hacker products used in malicious hacker activities. This market place can be accessed only via the ToR network. The posts range from 12/4/2013 to 10/4/2017 and is available on [11].
To prepare the original datasets for analysis, we performed a series of processing steps: (1) keywords-filtering; (2) label annotation; and (3) final label assignment. The steps are described as follows:
1)Key-words filtering: Providing the label for all instances of the raw datasets would be expensive and time-consuming. In addition, based on initial observation, the number of relevant messages (software-vulnerability-related communication) is far less represented within the datasets compared to the non-relevant. To address these issues, we have decided to filter the dataset using security-specific keywords. The list of keywords used are related to the most common security problems that hackers use to exploit software and applications. They can be found in the Open Web Application Security Project (OWASP) top 10 Application Security risks [13] and the SANS top 25 software errors [14].
The volume of posts is high in each dataset, with a small proportion of instances related to software vulnerabilities. The aim of filtering the instances with this list of keywords is to: (1) reduce of the number of messages, thus, reducing the time and human resource needed for the label annotation task, and (2) increase the proportion of the instances of the less represented class (relevant messages).
2)Label annotation task: Our three datasets had to be re-labelled in order to be usable for the task of software vul-nerability detection. Accurate labels are critical to the success of supervised learning. Existing work has relied on labelling annotation done by the authors, where some discussion is provided to form a consensus in doubtful messages [6], or by assigning a specific label to instances in a keywords-matching approach [4], where messages that match specific words, e.g., Hacker, are marked as being from positive class.
In this work, we are following a systematic approach, where each instance (post) in the datasets has been labelled by three different human labellers (computing researchers). Those three different opinions are considered in further step for defining the final label.
Due the ambiguity of some messages, it is not always straightforward to assign a binary label as Yesfor (malicious software-vulnerability-related communication) or No (non-malicious software-vulnerability-related communication). For this reason, we have created a third label called Undecided. In order to complete the task they should decide whether the message is related to software-vulnerability-related communi-cation. The following rules should be applied:
• Yes, for messages that appears as malicious messages of vulnerabilities in software assets.
• No, for messages not related to hacker activity or are out of the scope of our research (Data breach, copyrighted software cracked, stolen accounts and credit card accounts).
• Undecided, for messages that the labeller does not have enough information or confidence to mark as Yes or No.
In Table I we have examples of messages and their respec-tive labels. The message M1, marked as Yes, is related to a type of vulnerability (Stack Buffer Overflow) affecting a software product. Message M2, also marked as Yes, is related to a release of a Proof Of concept (PoC) of a vulnerability called
dirtycow. The messages M3 and M4 are related to personal opinion and have no direct relation to real vulnerabilities in software. It is fair to note that despite of M3 and M4 have
hack andhacker keywords, they are not considered malicious
communication, thus marked as No. In M5, there is not enough information to decide whether either the ssh scan tool is vulnerable or can be used against a vulnerable software, as well as M6, where we cannot confirm that the error mentioned leads to a vulnerability into the sneaker software product, thus they are marked as Undecided. We acknowledge that the model will only be as good at detecting hacker messages as the knowledge of the labellers, for this reason, people who understand the ambiguity and subtlety of the messages is a critical step.
Following this labelling approach, we have reduced the subjectivity (using multiples labellers) and uncertainty (having Undecided as third label).
3)Final label assignment: The assignment of the final label was given by the partial agreement voting scheme which consists of:
• At least 2 of 3 labels being equal for assigning the final label, e.g.: (NO, NO, Undecided), the final label is NO.
• Total disagreement labels, e.g., (NO, YES, Unde-cided), excludes the instance from the final dataset. • When the final label is Undecided, we changed to
YES. From a security perspective, we rationalise that it is better to capture these uncertain messages as ma-licious problem. Using this model in real-situation, the undecided messages would be captured as malicious and then examined by a human expert. Also, it helps to adjust the balance between the classes as the number positive instances (YES) is lower than the negative (NO) in our binary classification model.
In the end, after completing all processing steps on the original data, the description of the new datasets D1 to D3 can be seen in Table II.
B. Methodology
1)Training and Test split: Our approach is to produce classification models that will assess user posts as potential software vulnerability threats or not. We have used a super-vised learning approach, using our three labelled datasets for training and evaluation. Also, the 10-fold cross validation on each dataset. For the random partitioning of the datasets into the 10 groups or folds, we ensured stratification, such that the ratios of positive instances to negative instances are the same in each fold and as per the entire dataset.
2)Metrics: The main objective of the classification models presented in this research is to detect malicious communica-tion regarding the exploitacommunica-tion of software on social media (hacker forums, market places, micro blogs). In this context, the impact of a false negative (FN), or non-detection of malicious communication, is higher than the impact of a false positive (FP), or malicious communication being detected as normal communication. Under these circumstances, our model is prioritising the classification of the positive classes (malicious communication) rather than negative class (regular communication).
However, a model with high rate of FP (also known as false alarm), is not desirable either, as it implies that a model is wrongly detecting a threat where there is not. If this situation occurs often, either a time-consuming expert investigation will be needed or unnecessary security actions will be taken.
TABLE I. LABELLING TASK EXAMPLES
ID Message Label
M1 Multiple remote memory corruption vulns in all Symantec/Norton antivirus products, including stack buffer overflows Yes
M2 PoC for dirtycow vuln [URL] Yes
M3 Reading about lawyers argue about our Jeep hack is endless fun No
M4 it is amazing a hacker can put up with a sociologist ;) No
M5 Just released ssh scan v0.0.10. Release notes can be found here Undecided
M6 I like sneaker’s error 0xC0000156 Undecided
TABLE II. DATASET DESCRIPTION (AFTER PROCESSING)
ID Type Source No instances Distrib. (pos/neg) Avg. No. words
D1 Technical communication Hacker Forum 1,682 10/90% 50
D2 Expert communication Twitter 1,921 15/85% 13
D3 Market Place Dark Web 1,927 16/84% 169
∗Available in http://tiny.cc/8ws67y
For this reason we useaverage class accuracy, also known as balanced accuracy, average recall, and macro-average recall. This metric is the sum of the recall of the positive and negative classes divided by the number of classes as seen in (2) and recall being (1). This metric is suitable for imbalanced datasets as it prevents the majority class from dominating the results.
Recall= T rueP ositive
T rueP ositive+F alseN egative (1)
Avg.ClassAcc= Recall(pos.Class) +Recall(neg.Class)
N o.Classes
(2)
3)Traditional Text Representation: Bag-of-words (BoW), Words n-grams (W ngram) and Char n-grams (C ngram) are commonly used as text representation for text mining and classification tasks. In all cases, the text is split into a set of tokens, with normalised occurrence counts per token in a single vector produced to represent each post.
In BoW approach, the text is tokenised into an unordered set of words, where each separate word represents a single feature. In Words n-grams approach, which is an improvement upon BoW, it uses tokens which are split into a set of features consisting of N continuous sequential words occurrences. Finally, in Char grams, the process is the same as Words n-gram, however, it acts on the character level within the words. The next step represents each post (document) as a vector with the frequency of its containing word (or characters, depending on the features representation). We are using the range of 1 to 4, N=(1,4), with W ngram and C ngram repre-sentations.
In our work, we are using these traditional approaches and Word Level Distributed models for text representation (Section III-B4) for performing the experiment of our baseline classification models.
4)Word Level Distributed Text Representation: Unlike traditional text representations, Word Level Distributed Rep-resentation models, or Word Embedding (WEMB) models, capture syntactical and semantic information of words.
One of the first WEMB models is the Word2vec [15]. It has been widely used as feature representation in classification models. This model is based on a three-layer neural network
and has two types: One that leverages the surrounding infor-mation to predict the central word (CBOW) and other that uses the central word to predict the surrounding information (Skip-gram). Another popular WEMB model for text represen-tation is Glove [16], which is a co-occurrence matrix model that provides a word representation by using global matrix factorisation.
In this work, we are using public available pre-trained WEMB models, one being the Word2vec (skip-gram) and the other the Glove (co-occurrence). The goal is to verify whether the WEMB characteristics enhance classification performance of our applied model in comparison to traditional text repre-sentations.
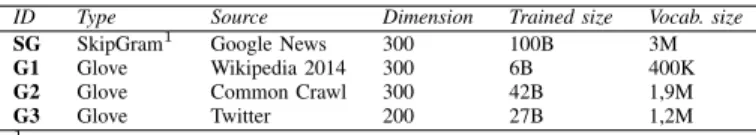
Table III has the description of the pre-trained WEMB models used in this experiment as type, source, dimension and size. These models are identified by the names on ID column for the remainder of this work.
In addition, in order to create a vector that adequately represents the entire document (post message on social media), we are using the averagingtechnique, which has shown good performance in [17]. This technique consists in averaging vectors of the pre-trained WEMB model for each word of the document. Table IV indicates the percentage of the words in each dataset that was found within the pre-trained WEMB models.
TABLE III. WEMB PRE-TRAINED MODELS DESCRIPTION ID Type Source Dimension Trained size Vocab. size
SG SkipGram1 Google News 300 100B 3M
G1 Glove Wikipedia 2014 300 6B 400K
G2 Glove Common Crawl 300 42B 1,9M
G3 Glove Twitter 200 27B 1,2M
1Word2vec
TABLE IV. PROPORTION OF WORDS FOR EACH DATASET WITHIN PRE-TRAINED WEMB MODELS
ID D1 D2 D3
SG 57% 81% 74%
G1 62% 85% 80%
G2 75% 92% 89%
G3 61% 83% 76%
5)Classification Algorithm: This work is using two clas-sical learning-based algorithms from the supervised learning
domain which are known for good performance in text classi-fication [18].
The first, the Support Vector Machine (SVM), is based on a maximal margin classifier algorithm. Also, SVMs are very effective for using in high dimensional space, which is the case of text classification [19]. The second, the Naive Bayes (NB) classifier, is based on the Bayes theorem, which is considered one of the simplest and efficient algorithms and is commonly used for text classification task [20].
6)Baseline Results: For the baseline results, two classifi-cation algorithms were used, SVM and NB. For text represen-tation, we used three traditional techniques, BoW, Words-N-gram and Char-N-Words-N-gram; and four pre-trained WEMB models. In addition, the values of n-grams (char and word) ranges from 1 to 4 and the datasets D1 to D3 are used to compare the models.
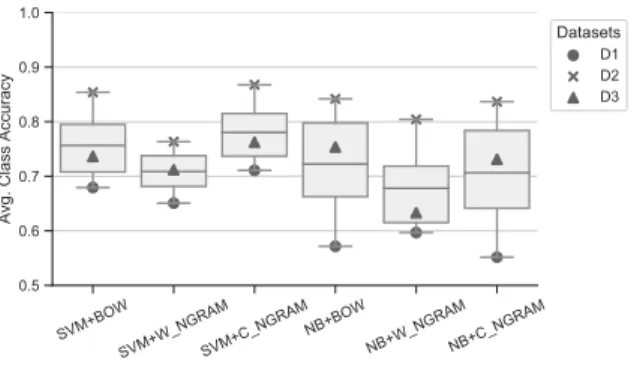
The results shown in Figure 1 are for the models combining different traditional features representation and algorithms. They are presented in modified boxplot format, where the mid-dle line of the box represents the mean (instead of median) of theavg. class accuracyfor all datasets (each one is represented with a different mark). The best result is given by the model SVM+C NGRAM, 0.78, which is not a largely improvement compared to SVM+BOW, 0.76, and NB+BOW, 0.72. In order to compare them, we have performed the Friedman Statistical test to determine whether there is any difference on the results achieved. With p-value=.097 (forα= .05), the null hypothesis is not rejected, meaning that there is no statistical certainty that any model is outperforming any another. Considering this, the baseline for the remainder of this work is the SVM+BOW. This model is computationally less expensive compared to the others (due the reduced number of features), and also allowed us to perform the next set of experiments without the need of extra/special hardware to accelerate the process.
SVM+BO W SVM+W _NGRAM SVM+C _NGRAMNB+BO W NB+W_NG RAM NB+C_NG RAM 0.5 0.6 0.7 0.8 0.9 1.0 Avg . C la ss Accu ra cy Datasets D1 D2 D3
Figure 1. Baseline results.
Additionaly, in Figure 2, we compared the baseline with other models using WEMB for feature representation as shown in Table III. It is seen that the model using WEMB did not outperform SVM+BOW, which uses Bag of Words rep-resentation. The best model among those using WEMB is SVM+G2, recording the mean avg. Class Accuracy of 0.64, whilst SVM+SG, SVM+G1 and SVM+G3 recorded 0.59, 0.62 and 0.61 respectively.
C. Imbalanced Datasets
The datasets used in this research have imbalanced classes, with the majority class being from the negative class (see
SVM+BOW SVM+SG SVM+G1 SVM+G2 SVM+G3 0.3 0.4 0.5 0.6 0.7 0.8 0.9 1.0 Avg . C la ss Accu ra cy Datasets D1 D2 D3
Figure 2. SVM using Bag of words (BOW) and Word Embedding (SG, G1, G2, G3) as features representation
Distribution in Table II), or in other words, they are general conversation and offer no significant value to the purpose of this research.
As a result of this imbalance, the classification performance is affected. Without sufficient knowledge to learn from the mi-nority classes (positive), classifiers may over-assign instances to the majority classes (negative). As seen in Figure 3, Neg. Recall is higher than Pos. Recall in all datasets, with negative instances being at least 5 times higher in number than positive instances in all datasets. One of our aims is to apply techniques that can address the imbalanced nature of dataset in order to increase Pos. Recall without damaging overall average recall. We use random over-sampling to increase the number of positive instances in datasets in D1, D2, D3. This technique has been proven to enhance positive recall of models trained on imbalanced datasets [21]. In our experimental set, we randomly resampled each fold three times, recording the average of the results for each run in order to minimise any random selection influence. Also, we have not performed this technique into the test fold data.
D1 D2 D3 Datasets 0.0 0.2 0.4 0.6 0.8 1.0 R eca ll Pos. Recall Neg. Recall Avg. Recall
Figure 3. Pos., Neg., and Avg. Recall for SVM+BOW
D. Dimensionality Reduction
The feature space of our model in all datasets are high dimensional and sparse. The average number of features for each model by feature representation can be seen in the Table V.
For many learning algorithms, training and classification time increases directly with the number of features and con-sequently a high numbers of features may even negatively impact on classifier accuracy. A simple technique to reduce
TABLE V. AVG. NO. FEATURES PER TEXT REPRESENTATION
Text Representation D1 D2 D3
BoW 9,422 4,880 18,119
Word n-grams n=(1,4) 168,082 49,610 542,259
Char n-grams n=(1,4) 96,063 36,372 104,981
the number of features is the use of document frequency (DF) reduction. DF reduction uses the number of features that occur within the documents (posts messages on social media) and removes the features that occur most often and least often.
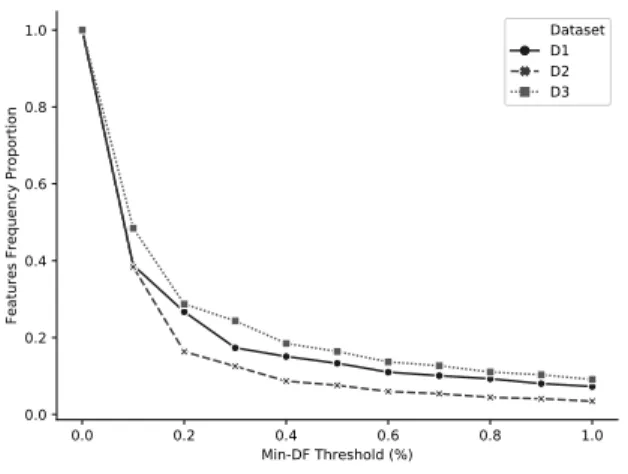
Figure 4 shows the average for DF reduction in the number of features across all datasets, as we adjust the threshold for the least often features from 0.1% up to 1%.
0.0 0.2 0.4 0.6 0.8 1.0 Min-DF Threshold (%) 0.0 0.2 0.4 0.6 0.8 1.0 Fe at ur es Fr eq ue nc y Pr op or ti on Dataset D1 D2 D3
Figure 4. Feature reduction
At the 0.1% threshold, where the 0.1% frequent words are excluded, we see a reduction of at least 50% (0.5) of features in all datasets. In our experimental section, we have evaluated the impact of this reduction in relation to the classification performance of the model.
There are two other approaches that can be used to further reduce the number of features of our classification model, namely, feature selection and features reduction.
Feature selection involves techniques that choose the best subset of the existing features. Typically, they rank the features using algorithms that correlate the features to the target class label and choose the top ranked features. Also, it helps elim-inate noisy of less predictive features to significantly reduce the dimensionality without losing classification performance. In this work, we have used the chi-square technique.
In contrast to feature selection, feature extraction is a dimension reduction approach that transforms the existing features to a set of alternative, more compact features, while retaining as much information as possible. Common methods include the unsupervised Principal Component Analysis (PCA) and Singular Value Decomposition (SVD) approaches, which perfom a transformation of the data into a reduced feature space that captures most of the variance in the data. In this work, we have used SVD technique.
IV. EXPERIMENT ANDRESULTS
The experiments are using the datasets D1 to D3 and follows the methodology described in Section III-B.
A. Dataset resampling
Chen et al. [21] have demonstrated that oversampling techniques can increase the positive recall. However, an excess of oversampling can lead to an overfit of the model. In order to find the optimal oversampling size, we have explored different resampling proportions for the positive class. Figure 5 shows the result.
0 100 200 300 400 500
Oversampling positive instances (%)
0.40 0.45 0.50 0.55 0.60 0.65 0.70 0.75 0.80 Po sit ive R eca ll First Optimal First Optimal Dataset D1 D2 D3
Figure 5. Optimal point
In order to find the best oversampling size, we defined the
first optimal rule . This rule consists of setting the optimal point as being the one that most improves the positive recall and has less resampled instances. Following this rule, D1 and D2 and D3 have their first optimal point set as 450%, 350% and 300% respectively.
With this technique, we have achieved an increase of the positive recall of 6% for D1 and D2, and 3% for D3, representing an average increase of 5%. Finally, the new proportion of the classes is shown in Table VI.
TABLE VI. RE-SAMPLED DATASET D1(+/-) % D2(+/-) % D3(+/-) %
Before (10/90) (15/85) % (16/84) %
After (44/56) (32/62) % (37/63) %
B. Dimensionality Reduction
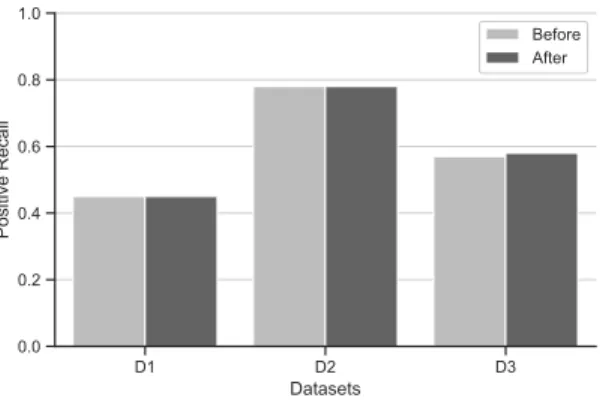
In order to make the model more efficient in terms of computational performance, all unnecessary features need to be removed. To achieve this, the detection accuracy after Document Frequency (DF) reduction needs to be verified in order to maintain the previous detection accuracy. In Figure 6, we have compared the positive recall for each of our datasets before and after the DF reduction. We removed all least frequent words, appearing in < (less than) 0.1% of the documents and the most frequent words appearing in > (more than) 20% of the documents. As seen in Figure 6, after reduction, the positive recall has been maintained in D1 and D2, and for D2 it has increased by 1%.
In the following, we have applied two other techniques on top of the reduced dataset post Document Frequency. First, the chi-square feature selection and second, the SVD feature extraction. For chi-square, we have used 50% of the number of actual features and for SVD, we reduced the dimensionality to 10% of the actual features space. These results are consistent with [17], which has found the same values for the same techniques. In Figure 7, the results indicate that we can use this
D1 D2 D3 Datasets 0.0 0.2 0.4 0.6 0.8 1.0 Po si tive R eca ll Before After
Figure 6. Document Frequency Reduction
technique to further reduce the dimensionality of the model. The trade-off for this is a minor reduction in the classification performance (less than 1%) using DF + SVD.
The summary of the results for all steps taken in this work can be seen in Table VII. It is seen that, for all datasets, the use of re-sampling technique improves over the baseline model in both metrics, positive recall and avg. class accuracy. In addition, the use of one of the three dimensionality reduction (DF, DF+Chi2 or DF+SVD) after re-sampling do not heavily change the performance already recorded.
D1 D2 D3 Datasets 0.0 0.2 0.4 0.6 0.8 1.0 Va lu es
Metric = Pos. Recall
D1 D2 D3
Datasets Metric = Avg. Acc
DF baseline DF + Chi^2 DF + SVD
Figure 7. DF, Chi-square and SVD dimensionality reduction
TABLE VII. SUMMARY - RANGE [0,1]
Metric Baseline Re-sampled DF DF+Chi2 DF+SVD
D1 Avg. acc 0.68 0.70 0.70 0.70 0.70 Pos. recall 0.39 0.45 0.45 0.45 0.44 D2 Avg. acc 0.85 0.88 0.88 0.88 0.87 Pos. recall 0.72 0.78 0.78 0.78 0.77 D3 Avg. acc 0.73 0.75 0.75 0.75 0.75 Pos. recall 0.54 0.57 0.58 0.57 0.56
V. CONCLUSION ANDFUTUREWORK
The main goal of this work is the investigation of how machine leaning and text mining techniques can be applied to detection of software-security-related communication in on-line channels. With this respect, it has been concluded:
(1) SVM and traditional BOW text representation per-formed better than a more robust SVM + WEMB model, such as Word2vec and Glove. We believe this happened due to the use of pre-trained models, trained in a generic and non-security related source (such as Wikipedia, Google news) Table III), thus, it does not capture the entire meaning of security-related words and jargon. With respect to the result of the
four classification models using pre-trained WEMB features representation, the SVM + G2 achieved the best results among them. This is due to the higher percentage of words the G2 model has in common with the datasets (D1 to D3) compared to the other WEMB models (SD, G1 and G3), as seen in Table IV.
(2) The random sampling technique has proven to be useful for training models with imbalanced quantity of instances within the classes. In this experiment, we have an increase of the positive recall by 5% in average by oversampling the minority class. Models trained in D2 and D3 achieve best positive recall (with less oversampling) by increasing 350% and 300% the number of the minority class, respectively, whilst D1 reach its best in 450%.
(3) The detection performance of the models can be achieved with a small quantity of features. By DF reduction, where the least (appearing in less than 0.1% documents) and the most often (appearing more than 20% in documents) features were removed, we have at least a drop of 50% of the total features, while maintaining the same classification performance. To further reduce the dimensionality of the model, chi-square and SVD techniques can be used at the levels of 50% and 10% of the number of features respectively. We believe that these findings can bring further directions to CTI initiatives with respect to the creation of accurate and efficient classification models. In addition, in this paper, we took a systematic approach to apply a variety of core text mining techniques (feature representation, reduction and resampling) in order to determine a reference for other re-searchers. Also, we have published our three labelled dataset to be used by others to compare their approaches and results. The next steps would be comparing the performance of these models against deep learning classification models, such as convolutional neural networks (CNNs) and recurrent neural networks (RNNs), and use other form of text representation not used in this work, such as Sent2vec. We also want to perform a multiclass classification using the three classes of our dataset (Yes, No and Undecided) to see how well the model can perform the detection of uncertain messages (those marked as Undecided).
ACKNOWLEDGMENT
Andrei Lima Queiroz would like to thank the scholarship granted by the Brazilian Federal Programme Science without Borders supported by CNPq (Conselho Nacional de Desen-volvimento Cient´ıfico e Tecnol´ogico), No 201898/2015-2.
REFERENCES
[1] CNBC. The great Equifax mystery: 17 months later, the stolen data has never been found, and experts are starting to suspect a spy scheme. URL: https://www.cnbc.com/2019/02/13/equifax-mystery-where-is-the-data.html [Accessed: Jul, 2019].
[2] Facebook Newsroom. Security Update. URL: https://newsroom.fb.com/ news/2018/09/security-update/ [Accessed: Jul, 2019].
[3] A. Algarni and Y. Malaiya, “Software vulnerability markets: Discover-ers and buyDiscover-ers,” International Journal of Computer, Information Science and Engineering, vol. 8, no. 3, 2014, pp. 71–81.
[4] I. Deliu, C. Leichter, and K. Franke, “Collecting cyber threat intel-ligence from hacker forums via a two-stage, hybrid process using support vector machines and latent dirichlet allocation,” in 2018 IEEE International Conference on Big Data (Big Data). IEEE, 12 2018, pp. 5008–5013.
[5] C. Sabottke, O. Suciu, and T. Dumitras, “Vulnerability disclosure in the age of social media: Exploiting twitter for predicting real-world exploits,” in 24th USENIX Security Symposium (USENIX Security 15). Washington, D.C.: USENIX Association, Aug. 2015, pp. 1041–1056. [6] E. Nunes, A. Diab, A. Gunn, E. Marin, V. Mishra, V. Paliath,
J. Robertson, J. Shakarian, A. Thart, and P. Shakarian, “Darknet and deepnet mining for proactive cybersecurity threat intelligence,” CoRR, vol. abs/1607.08583, 2016, [accessed: Jul, 2019]. [Online]. Available: http://arxiv.org/abs/1607.08583
[7] O. Cherqi, G. Mezzour, M. Ghogho, and M. El Koutbi, “Analysis of hacking related trade in the darkweb,” in 2018 IEEE International Conference on Intelligence and Security Informatics (ISI), Nov 2018, pp. 79–84.
[8] R. P. Lippmann, W. M. Campbell, D. J. Weller-Fahy, A. C. Mensch, G. M. Zeno, and J. P. Campbell, “Finding malicious cyber discussions in social media,” Lincoln Laboratory Journal, vol. 22, no. 1, 2016, pp. 46–59.
[9] A. Okutan, G. Werner, S. J. Yang, and K. McConky, “Forecasting cyberattacks with incomplete, imbalanced, and insignificant data,” Cy-bersecurity Journal, vol. 1, no. 1, Dec 2018, p. 15.
[10] AZSecure-data.org. Cracking Arena [Hacker forum]. URL: https:// www.azsecure-data.org/other-forums.html [Accessed: Jul, 2019]. [11] ——. Dream Market [Market Place]. URL: https://www.azsecure-data.
org/other-data.html [Accessed: Jul, 2019].
[12] A. Queiroz, B. Keegan, and F. Mtenzi, “Predicting software vulner-ability using security discussion in social media,” in 16th European Conference on Information Warfare and Security, ECCWS, Dublin, Ireland, Jun. 2017, pp. 628–634.
[13] OWASP. Top 10 Application Security Risks - 2017. URL: https://www. owasp.org/index.php/Top 10-2017 Top 10 [Accessed: Jul, 2019]. [14] SANS. Top 25 Most Dangerous Software Errors. URL: https://www.
sans.org/top25-software-errors [Accessed: Jul, 2019].
[15] T. Mikolov, K. Chen, G. Corrado, and J. Dean, “Efficient estimation of word representations in vector space,” in 1st International Conference on Learning Representations, ICLR 2013, Scottsdale, Arizona, USA, May 2-4, 2013, Workshop Track Proceedings, 2013. [Online]. Available: http://arxiv.org/abs/1301.3781
[16] J. Pennington, R. Socher, and C. D. Manning, “Glove: Global vectors for word representation,” in In EMNLP. Association for Computational Linguistics, 2014, pp. 1532–1543.
[17] H. Chen, S. Mckeever, and S. J. Delany, “The use of deep learning distributed representations in the identication of abusive text,” in 13th International AAAI Conference on Web and Social Media ICWSM-2019, vol. 13, no. 1, Munich, Germany, Jun. ICWSM-2019, pp. 125–133. [18] T. Joachims, “Text categorization with support vector machines:
Learn-ing with many relevant features,” in Machine LearnLearn-ing: ECML-98, C. N´edellec and C. Rouveirol, Eds. Berlin, Heidelberg: Springer Berlin Heidelberg, 1998, pp. 137–142.
[19] C. Cortes and V. Vapnik, “Support-vector networks,” Machine Learning Journal, vol. 20, no. 3, Sep 1995, pp. 273–297.
[20] D. D. Lewis, “Naive (bayes) at forty: The independence assumption in information retrieval,” in Machine Learning: ECML-98, C. N´edellec and C. Rouveirol, Eds. Berlin, Heidelberg: Springer Berlin Heidelberg, 1998, pp. 4–15.
[21] H. Chen, S. Mckeever, and S. J. Delany, “Harnessing the power of text mining for the detection of abusive content in social media,” in Advances in Computational Intelligence Systems. Cham: Springer International Publishing, 2017, pp. 187–205.