Optimization of data resampling through GA for
the classification of imbalanced datasets
Filippo Galli a,1,*, Marco Vannucci a,2, Valentina Colla a,3 a TeCIP Institute, Scuola Superiore Sant’Anna, via Moruzzi 1, Pisa, Italy
1 [email protected]; 2 [email protected]; 3 [email protected]
* corresponding author
1.
Introduction
The automatic identification of infrequent patterns is a problem common to some different contexts. Many applications can be found in the industrial framework in tasks related to machine faults or defects detection [1][2]. In medicine, it was used to the diagnosis of rare diseases or for the classification of medical analysis [3]. In finance, where the identification of fraudulent transactions [4] is a key-issue that belongs to this class of problems, while in social science for the identification of income classes within populations [5]. In all these applications, the correct identification of the rare samples (belonging to the rare class CR) is fundamental due to the characteristics of the problem. For example, defects should be detected in order to avoid the commercialization of unreliable products; machine faults raise product quality and reduce machine crashes. In addition, the correct diagnosis of diseases important in order to allow suitable countermeasures, and fraudulent transactions should be stopped. On the other hand, in these practical applications, the generation of the so-called false alarms. The misclassification of samples belonging to the frequent class CF does not represent a big issue and, in any case, is strongly preferable than the misclassification of rare patterns.
Unfortunately, when these classification tasks are performed by means of data-driven methods, many problems may arise due to the natural imbalance of the dataset that is used for the training of standard classifiers [2]. It results in a poor classification performance marked by the low rate of rare samples that are correctly spotted. Several interacting factors contribute to this undesired effect. The main one relies on the basic assumption of even distribution among classes, which is implicitly done by standard A R T I C L E I N F O A B S T R A C T
Article history
Received July 19, 2019 Revised August 10, 2019 Accepted October 29, 2019 Available online October 29, 2019
Classification of imbalanced datasets is a critical problem in numerous contexts. In these applications, standard methods are not able to satisfactorily detect rare patterns due to multiple factors that bias the classifiers toward the frequent class. This paper overview a novel family of methods for the resampling of an imbalanced dataset in order to maximize the performance of arbitrary data-driven classifiers. The presented approaches exploit genetic algorithms (GA) for the optimization of the data selection process according to a set of criteria that assess each candidate sample suitability. A comparison among the presented techniques on a set of industrial and literature datasets put into evidence the validity of this family of approaches, which is able not only to improve the performance of a standard classifier but also to determine the optimal resampling rate automatically. Future activities for the improvement of the proposed approach will include the development of new criteria for the assessment of sample suitability.
This is an open access article under the CC–BY-SA license.
Keywords Imbalanced datasets Classification Data resampling Genetic algorithm
classifiers such as Artificial Neural Networks (ANNs) or Decision Trees (DTs). These classifiers, in facts, aim at maximizing the overall performance that is achieved when coping with balanced datasets but it is not when the training datasets is imbalanced: in this latter case the resulting classifiers are biased toward the majority class (reaching, nevertheless, satisfactory performance) and neglects the minority class [6]. The complexity of the classification task reduces the classification performance as well in the presence of imbalance. Estabrooks et al. [7] shown how complex decision boundaries and overlapping classes complicate the mission of the classifiers that tend to solve the conflicts in favor of the majority class. In this framework, the detrimental effect is proportional to the imbalance rate and the presence of noise and outliers in the training dataset [8].
In this paper, an overview of an emerging category of approaches for the imbalanced datasets classification is provided. These approaches aim to the efficient preprocessing of the data to be fed to the classifier in order to improve its performance and operate by optimizing the preprocessing step by using Genetic Algorithms (GA). The paper is organized as follows: in section 2, an overview of the most widely used techniques for improving the performance of imbalanced datasets classifiers is provided. Then, the family of methods object of this work is shown focusing both on the general idea and the peculiarities of the presented techniques. In section 3, the performance of these latter approaches is compared to those of other standard methods. In section 4, some conclusion is drawn together with the future perspective of this work.
2.
Method
In this work, a novel family of resampling approaches optimized through the use of GAs is presented. More in detail, GA is used to determine the single data patterns under or oversampling are convenient for the improvement of the classifier's performance. The basic idea of the proposed methods is to be able to merge different criteria fruitfully – often contrasting - for the selection of samples to exploit the positive aspects of each of them, trying in the meanwhile to avoid their drawbacks. Each of the employed criteria is applied to all associated samples (i.e., CF samples for under-sampling related criteria) and, according to the obtained evaluations, a ranking for each criterion is determined. Subsequently, GA is used in order to select from the first positions of the rankings the most convenient subset of data to be actually considered within the resampling. The GA engine is used for the evolution of a solution based on a fitness function that assesses the performance of an arbitrary classifier when trained with the dataset obtained from the resampling identified by the selected solution. As will be discussed later, the main advantage of the use of a cross-criteria optimization is twofold. On the one hand, the interaction between different dataset transformations, and on the other one, the automatic achievement of an optimal resampling rate which is one of the main issues of resampling. In this section, an overview of the introduced methods for data resampling by means of GA in the context of imbalanced datasets classification is provided. Pure undersampling approach and advanced sampling (a combination of under and oversampling) aim to put evidence of these approaches evolution. It highlights common points and differences among the methods that will be evaluated on a series of test problems in section 3.
2.1.Classification of imbalanced datasets
Due to the relevance and the cross-sectoral nature of the problem, in literature, it is possible to find a number of methods that aim to overcome the problem of class imbalance with respect to classification tasks devoted to the detection of rare samples [9]. All these methods can be grouped into two main classes that are distinguished on the basis of what is done in order to counterbalance the class imbalance, internal and external ones.
Internal methods include all the approaches in which new algorithms have been developed on purpose to face class imbalance and improve the detection rate of rare patterns. Modifications of the existing algorithm are included in this class, as well. The main advantage of a class of the approaches is their efficiency since they are completely optimized to handle class imbalance and other specific applications. On the other hand, such specialization also represents the main drawback of these techniques since it drastically limits their portability. Since class imbalance conditions the classifiers by increasing its CF
output rate, a common way to contrast this behavior is to favor the other class explicitly. Cost-Sensitive Learning (CSL) is widely used for the family of approaches. It belongs to the class and operated by penalizing the misclassification of rare patterns. This strategy can work together – as a data preprocessing step - with most standard classifiers. A CSL approach was used for the design of a Thresholded Artificial Neural Network (TANN) in [10], where a standard feed-forward ANN is coupled to a threshold operator to favor the detection of CR patterns. A similar approach is at the basis of the LASCUS method [11] that labels data clusters of the problem domain obtained through a Self-Organizing-Map to improve the correct classification of CR samples. Apart from the numerous CSL-based approaches, many methods operate by modifying existing techniques to handle class imbalance suitably. A method based on the use of a Radial Basis Function Network with a rectangular activation function was successfully proposed by Soler and Prim [12]. The performance of standard Support Vector Machine (SVM) classifiers is analyzed by Tang et al. [13], while Batuwita and Palade [14] are used an SVM classifier as employed fuzzy membership functions to determine the importance of different samples. According to the belonging, the class is proposed. In this case, the higher priority is assigned to rare samples in order to increase their detection rate.
Ensemble Methods (EM) are also suitable to face class imbalance. A boosting approach was used to control the growth of the ensemble by adding weak learners mainly devoted to the identification of rare patterns [15], while Yuan et al. [16] proposed an approach based on the use of a special aggregation strategy that biased toward infrequent patterns.
External methods, on the contrary, are based on the exploitation of standard classifiers but they instead operate on the training dataset by reducing its imbalance rate (and hopefully its detrimental effect) using the so-called resampling. This class of approaches is being independent on the problems and employed algorithms and it has the main advantage of portability. In most cases, resampling operations do not fully rebalance the training dataset but increase the relative frequency of the minority up to a predetermined ratio. One of the main open questions for these approaches is indeed the determination of the optimal unbalance ratio, which is affected by the nature of the problems and by the class distributions without a general rule for its calculation. Class rebalances can be applied in two ways: either removing CF samples (the so-called under-sampling) or increasing through replication the number of CR ones (over-sampling). In general, none of these opposite techniques is better than the other and no optimal resampling strategy can be outlined [17][18], not even by mixing them. In both cases, the simplest approach consists of the random selection of the observations to be removed or duplicated in under and oversampling respectively. It may be effective, but it can lead to significant drawbacks for the classification performance [19]. Random oversampling can form compact clusters of CF clusters within the problem domain and thus reduce instead of expanding the regions of the domain associated with CR samples [20][7]. Furthermore, Random under-sampling can cut off the training set samples with high informative content; for instance, those lying close to the class borders.
These unwanted effects can be avoided by the application of advanced resampling techniques with the scope of selecting the data whose removal or replication is most convenient for the classifier. In literature, many works are based on this idea. Laurikkala [21] employed undersampled observations based on their distance from class boundaries to shrink the dimension of the areas associated with CF patterns. Another application of this rationale is found in Japkowicz [22] and Yen and Lee [23], where majority samples belonging to compact homogeneous clusters of CF samples are cut to limit the presence of similar samples while minimizing the information loss. SMOTE (Synthetic Minority Oversampling TEchnique) is a noticeable oversampling approach that does not perform the pure replication of the existing sample [17]. This method creates new synthetic CR samples locating them in plausible and probable positions according to existing rare observations. This technique has the advantage of generating (although synthetically) instead of replicating information to avoid the overfitting that could derive from the pure samples replication. Unfortunately, it emerged that SMOTE is prone to the introduction of conflicts and due to the placement of the generated observation since there is no rationale to avoid their proximity to samples belonging to the other class [24]. In Cateni et al. [25], a technique for avoiding this kind of conflict is proposed: the SUNDO algorithm determines the location of
synthetically created samples by taking into account the distribution of patterns belonging to all the classes within the domain. A further approach that exploits these techniques couples it with an SVM classifier, which is fed by using rare samples created by using a weighted version of SMOTE [26]. 2.2.GA optimized under-sampling
The first attempt to manage different resampling criteria through a GA-based optimization was proposed by Vannucci and Colla [27], under the name Smart Under-sampling (SU). The method operates on the training dataset (all the variables are normalized in the range [0;1]), an under-sampling procedure that takes into account three distinct criteria. These criteria that assess all CF samples were designed to give a high rating to samples whose removal reduces classification conflicts (that would be solved in favor of the predominant class) and/or broadens the regions of the domain assigned by the classifier to the rare class. More in detail for each sample 𝑥 ∈ 𝐶𝐹 t the following values are calculated: 1) Undersampling Distance to Closest CR sample (DCR) is the distance between x and the closest rare
pattern in the dataset and is computed as:
𝑈𝐷𝐶𝑅(𝑥) = 1 − min
𝑝∈𝐶𝑅
‖𝑥 − 𝑝‖
where the || || operator calculates the Euclidean distance between couples of samples. This value is closer to 1 for frequent patterns located in proximity to one rare observation; thus, their elimination favors the dilatation of the input space associated with the rare pattern.
2) Undersampling Distance to Closest Frequent sample (DFR) computes the minimum distance of a frequent samples to the closest sample of the same class. Its value is close to 1 for CF samples that lie close to samples of the same class. The pruning samples for which this indicator value is high rebalances the dataset and reduces the redundancy of CF patterns with a minimum loss of informative content. It is calculated as follows:
𝑈𝐷𝐹𝑅(𝑥) = 1 − min
𝑝∈𝐶𝐹
‖𝑥 − 𝑝‖
3) Undersampling Average Distance to Rare samples (ADR) calculates the average distance of x from the rare samples within the dataset, and its value is higher for CF samples that lie in regions relatively dense of rare patterns. The effect of their elimination is the direct reduction of conflicts in areas that the classifier would associate with CR. It is expressed as:
𝑈𝐴𝐷𝑅(𝑥) = 1 − average(
𝑝∈𝐶𝑅
‖𝑥 − 𝑝‖)
The three criteria are calculated for all the frequent samples and determine three rankings for UDCR, UDFR, and UAFR respectively. Equations (1), (2), (3) were designed to put the CF samples whose removal is most convenient on the top of the corresponding rankings. The idea of the SU method is to determine three optimal removal percentage RUDCR, RUDFR, and RUADR associated with these rankings to identify the observations to be undersampled by picking them off the top of the respective rankings. Optimal removal percentages are determined using GA (the details on the GA optimization can be found in Vannucci and Colla [27]) that evolve a generic solution [RUDCR, RUDFR, RUADR] through generations. Each candidate solution is evaluated within the GA fitness function by
a) creating the corresponding training dataset (which is under-sampled according to the solution removal rates)
b) using the so-formed dataset to train a decision tree (DT) classifier
c) evaluate the performance of the classifier on a non-resampled validation dataset according to equation (4), an expression is designed by Vannucci et al. [10] for imbalanced classifiers assessment:
𝐸 = 1 −
𝛾𝑇𝑃𝑅−𝐹𝑃𝑅𝐴𝐶𝐶+𝜇𝐹𝑃𝑅
where TPR represents the True Positive Rate, FPR the False Positive Rate, ACC the overall accuracy while the metric parameters µ and
are experimentally set.At the end of the process, the optimal removal percentages are achieved. These rates identify not only the actual samples to remove from the original training dataset but also an overall rebalance rate. 2.3.Optimized GA Resampling
The Optimized GA Resampling (OGAR) [28] extends the SU approach by adding the oversampling capability that operates together with the under-sampling implemented in SU. In terms of oversampling, the idea of OGAR is to select through a strategy part of the CR samples that are generated by SMOTE. In the context of the simultaneous and interacting process of under and oversampling, GA is used for the selection of the CF samples to be removed, and of the synthetically generated samples to be preserved. The OGAR initially exploit SMOTE to create a set CSM of samples belonging to CR. The cardinality of CSM is determined to rebalance the classes fully. Once CSM is created, several indicators assess both CSM and CF samples similar to the SU method. The criteria used for CF samples evaluation and that are related to the undersampling operation are the same as in SU already reported in equations (1), (2), (3) while all 𝑥 ∈ 𝐶𝑆𝑀 samples are evaluated according to the following formulae:
1) Oversampling Distance to Closest Frequent sample (ODFR). ODFR
is close to 1 for the CSM
samples which are not located in the proximity of frequent observations, thus these data do
not generate conflicts in the classifier perspective, overcoming one of the main limitations
of SMOTE.
𝑂𝐷𝐹𝑅(𝑥) = min
𝑝∈𝐶𝐹
‖𝑥 − 𝑝‖
2) Oversampling Average Distance to Frequent samples (OADF). OADF is close to 1 for CSM samples that do include in their neighborhood a small number of CR observations. This criterion also identifies the synthetic samples that will likely generate a low number of conflicts for the classifier. OADF is calculated as in (6).
𝑂𝐴𝐷𝐹(𝑥) = average (
𝑝∈𝐶𝐹
‖𝑥 − 𝑝‖)
As in the SU approach, the 5 criteria (3 for under-sampling and 2 for over-sampling) are used to form 5 rankings among CF and CSM samples, respectively. At the top of the under-sampling related rankings, there are the CF samples whose removal is convenient while at the top of the over-sampling related ones, there are the synthetic samples whose permanence in the training dataset is beneficial. The GA optimization based on the fitness function leads to the optimal resampling percentages [RUDCR, RUDFR, RUADR; RODFR; ROADF] that determine, together with the rankings, the optimal resampled training dataset.
2.4.SOM based GA resampling
The SOM based GA resampling method (SBR) [29] is another approach that simultaneously optimizes under- and oversampling through a set of criteria whose interaction is managed to utilize GA. The employed criteria aim to minimize conflicts and the expansion of the region associated with CR by an arbitrary classifier based on a SOM clusterization. It determines the regions where samples belonging to different classes are denser. As for the other approaches, density information on CR and CF samples provided by two distinct SOMs is used to calculate a set of rankings that estimate the impact of each single sample inclusion within the training dataset. The oversampling part, as in the case of the OGAR
method, exploits a set CSM of synthetic CR samples created using SMOTE. The cardinality of this set fully rebalances the original training dataset.
SBR exploits two different SOMs for the mapping of the two classes density in the problem domain: the first one (SF) is trained by using only the frequent samples while the other one (SR) only the rare ones. All the details on the dimensioning and characteristics of the employed SOMs can be found in [29]. The trained SOMs determine two sets of centroid CenF and CenR for the frequent and rare samples respectively. Four criteria based on the position of these centroids were designed for the evaluation of the retention of CSM and CF samples within the training dataset. These criteria, as usual, operate on a normalized dataset and are the following:
1) Average Distance from Frequent Class Centroids (ADFC). ADFC is calculated for all CF samples in the original dataset. The higher this metric, the more isolated a frequent sample with respect to the others is, thus its elimination would allow CR class boundary to expand in a region where samples belonging to CF is not preponderant
𝐴𝐷𝐹𝐶(𝑑) = average (
𝑐∈𝐶𝑒𝑛𝐹
‖𝑑 − 𝑐‖)
2) Minimum Distance from Rare Centroid (MDRC) applies equation (8) to all CF samples as well. The value of this metric is closer to 1 for the CF samples that lie in the proximity of a rare one thus its selection for removal aims to limit the conflicts among the classes.
𝑀𝐷𝑅𝐶(𝑑) = − min(
𝑐∈𝐶𝑒𝑛𝑅
‖𝑑 − 𝑐‖)
3) Minimum Distance from Frequent Centroid (MDFC), depicted in equation (3), is calculated for all the synthetically generated samples and is higher for the ones that are located far from regions where frequent samples are denser. This criterion is analogous – using SOM clusters - of the one employed by OGAR and depicted in equation (5).
𝑀𝐷𝐹𝐶(𝑑) = min (
𝑐∈𝐶𝑒𝑛𝐹
‖𝑑 − 𝑐‖)
4) Location in Contended Region (LCR), calculated through equation (10) for all CSM samples, is an index of membership to zones of the domain in the middle between regions where the two different classes are predominant. Populating these boundaries parts of the domain with rare synthetic samples will probably lead to their assignment to CR samples by the classifier.
𝐿𝐶𝑅(𝑑) = − | min (
𝑎∈𝐶𝑒𝑛𝐹
‖𝑑 − 𝑎‖) − min (
𝑏∈𝐶𝑒𝑛𝑅
‖𝑑 − 𝑏‖)|
As for the other methods, these criteria are used to form 4 rankings: two for CF samples employing equations (7), (8) and two for the CSM samples employing equations (9), (10). Equation (4) is used within the GA DT-based fitness function to evaluate the candidate solutions. In this case, It constituted by four elements arrays ([RADCF, RMDCR, RMDCF, RLCR]) each one associated with a ranking and representing the percentage of elements to remove (first two) or keep (last two) from CF and CSM respectively. The result of the GA optimization is the optimal solution that determines the optimal training dataset.
3.
Results and Discussion
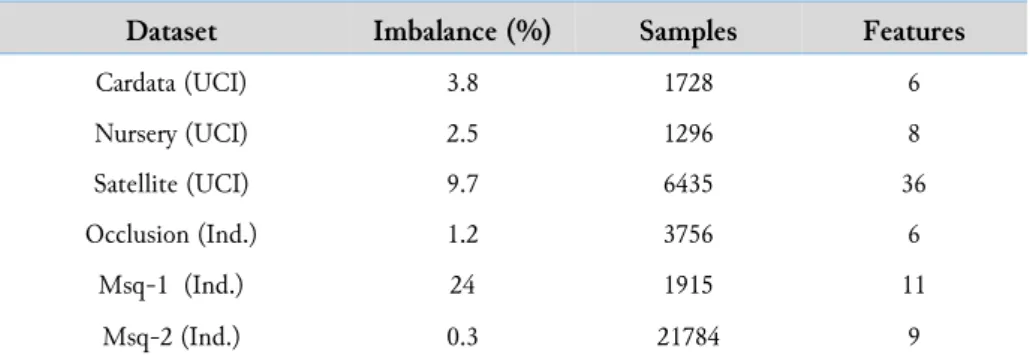
The performance of the GA optimized resampling methods described in this paper has been assessed on a set of binary classification problems coming both from industrial tasks and the UCI database repository [30]. All these problems are characterized by the presence of an imbalanced dataset where the cardinality of the class of interest - the one to be identified (CR) – is markedly lower with respect to the other. A description of the employed datasets is provided in Table 1. As it emerges from the table, the characteristics of the selected datasets include a broad range of conditions (original imbalance, number of variables and observations) in order to highlight the achievement of the different methods in a wide set of situations.
Table 1. Description of datasets employed for the tests of the described methods.
Dataset Imbalance (%) Samples Features
Cardata (UCI) 3.8 1728 6 Nursery (UCI) 2.5 1296 8 Satellite (UCI) 9.7 6435 36 Occlusion (Ind.) 1.2 3756 6 Msq-1 (Ind.) 24 1915 11 Msq-2 (Ind.) 0.3 21784 9
Information on the employed dataset taken from the UCI repository can be found at Vannucci and Colla [29]. The Occlusion dataset was formed for the tuning of classifiers able to detect the phenomenon of nozzles clogging during the continuous casting process in the steel-making industry. The prompt detection of occlusions drastically reduces quality problems in the products as well as process faults, and for these reasons is the main issue during production. On the other hand, raising false alarms in this context is tolerable.
The two Metal Sheet Quality (MSQ1, MSQ2) datasets refer to the automatic grading of metal sheets quality based on a vision system that provides images of sheets surface and several features extracted from them. The main classification problem involves the decision on whether a product fulfills quality standards or not. The reliable identification of defective sheets is fundamental as it avoids the release of low-quality products into the market that would likely generate problems with customers.
Within the test campaign, the datasets listed in Table 1 have been firstly divided into a training (70% of observations) and test datasets (30% observations), both of them preserving the original imbalance ratio. Specific preprocessing algorithms [31]–[33][34] for the selection of main input variables were used for the dataset characterized by a high number of potential inputs (Satellite, MSQ-1). The results obtained by the GA optimized resampling approaches are compared to the other resampling techniques, i.e., random oversampling and undersampling, SMOTE oversampling, and no-resampling (using the original dataset) to assess the impact of every single approach. In all the tests, a decision tree trained using the C4.5 algorithm was used as the classifier. The proposed approach shares the same setting as far as the GA engine concerns. The cardinality of the evolved population is 100 and the stop condition interrupts the algorithm once 50 generations have been completed. In the case of the methods that do not automatically reach an optimal imbalance rate (i.e., random resampling), the algorithms have been tested according to different rates in the range [5%; 50%], and the most performing results were reported within the results.
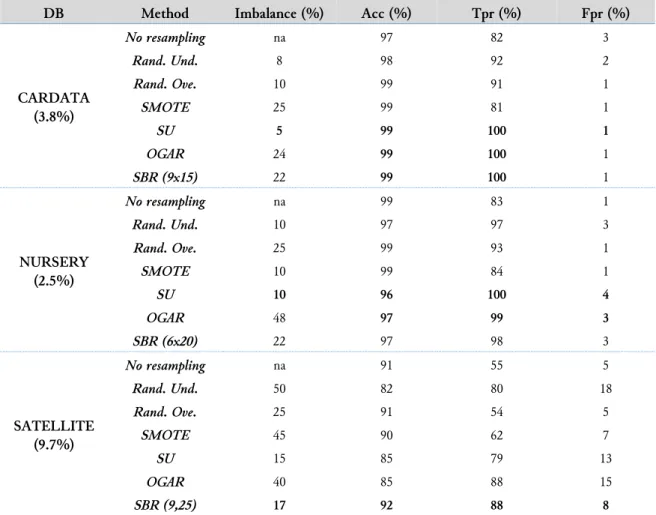
The performance of the methods involved in the test campaign is summarized into two tables: Table 2 for the UCI datasets and Table 3 for the industrial ones. Results are expressed in terms of the standard indicators used when coping with class imbalance: ACC, TPR, FPR, together with the optimal imbalance rate achieved by SU, OGAR and SBR.
Table 2. Results achieved by the tested methods on UCI datasets.
DB Method Imbalance (%) Acc (%) Tpr (%) Fpr (%)
CARDATA (3.8%) No resampling na 97 82 3 Rand. Und. 8 98 92 2 Rand. Ove. 10 99 91 1 SMOTE 25 99 81 1 SU 5 99 100 1 OGAR 24 99 100 1 SBR (9x15) 22 99 100 1 NURSERY (2.5%) No resampling na 99 83 1 Rand. Und. 10 97 97 3 Rand. Ove. 25 99 93 1 SMOTE 10 99 84 1 SU 10 96 100 4 OGAR 48 97 99 3 SBR (6x20) 22 97 98 3 SATELLITE (9.7%) No resampling na 91 55 5 Rand. Und. 50 82 80 18 Rand. Ove. 25 91 54 5 SMOTE 45 90 62 7 SU 15 85 79 13 OGAR 40 85 88 15 SBR (9,25) 17 92 88 8
From the analysis of the results reported in Table 2 and that concern the UCI datasets the advantage that derives from the exploitation of the proposed techniques emerge. Within the tree applications, the combination of under and oversampling in an optimization process that leads to a training dataset that, one fed to a standard classifier, strongly improves its classification performance, especially considering the main aim of the problems that is the detection of the infrequent samples. The results obtained by advanced methods concerning standard ones are more marked in the CARDATA problem, where the 100% TPR is achieved by SU, OGAR and SBR, keeping the false alarm rate at 1%. A noticeable improvement is also obtained on the other two datasets even though in the SATELLITE dataset, it corresponds to a – tolerable - increase of the FPR. In terms of optimal resampling rate, the ones reached by the GA optimized methods are in general, not very different from those that maximize the performance of standard resampling techniques. It is worth to note that OGAR tends to modify more the original dataset than SU and SBR.
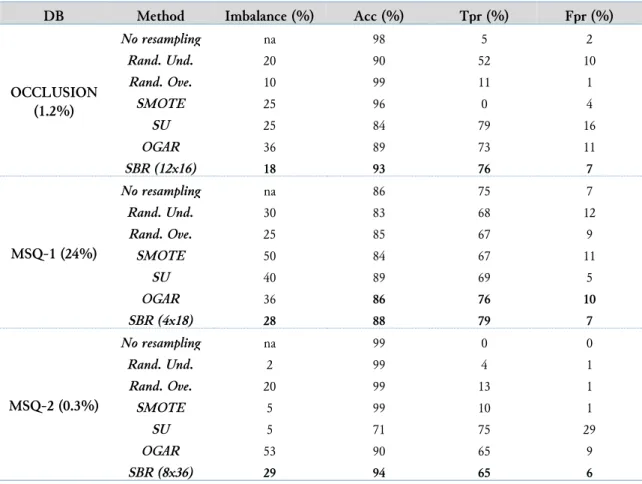
According to Table 3, GA based optimization methods overcome the standard resampling methods on the industrial datasets test-bed as well. Also, in this case, the improvement of the TPR is relevant. In the OCCLUSION detection application, the proposed approaches raise the rate of correctly detected cloggings from 52% (random undersampling) to 79% with 16% of false alarms achieved by SU and a 76% obtained by SBR with an even lower rate of FPR (7%). On the MSQ-1 dataset, whose original imbalance rate is not very high, there is a minor improvement. On the contrary, on the MSQ-2 dataset, which is extremely imbalanced, the performance of GA optimized methods is dramatically superior with respect to other methods: the best TPR rate of standard techniques of 13%, achieved by random oversampling is brought up to 75% by SU and 65% by SBR and OGAR. Limited to these latter approaches, the results of OGAR and SBR are strongly preferred as they can keep acceptable FPR. This
discrepancy is likely due to the capability of OGAR and SBR of oversampling the data with synthetic samples whose impact is probably relevant in the case of extreme imbalance.
Table 3. Results achieved by the tested methods on the industrial datasets
DB Method Imbalance (%) Acc (%) Tpr (%) Fpr (%)
OCCLUSION (1.2%) No resampling na 98 5 2 Rand. Und. 20 90 52 10 Rand. Ove. 10 99 11 1 SMOTE 25 96 0 4 SU 25 84 79 16 OGAR 36 89 73 11 SBR (12x16) 18 93 76 7 MSQ-1 (24%) No resampling na 86 75 7 Rand. Und. 30 83 68 12 Rand. Ove. 25 85 67 9 SMOTE 50 84 67 11 SU 40 89 69 5 OGAR 36 86 76 10 SBR (4x18) 28 88 79 7 MSQ-2 (0.3%) No resampling na 99 0 0 Rand. Und. 2 99 4 1 Rand. Ove. 20 99 13 1 SMOTE 5 99 10 1 SU 5 71 75 29 OGAR 53 90 65 9 SBR (8x36) 29 94 65 6
The optimal imbalance rate determined by SU, OGAR, and SBR for the OCCLUSION and MSQ-1 datasets is comparable to the one for which the standard methods achieve their best performance. For the MSQ-2 dataset, the resampling is more marked, probably due to the strong imbalance of the original dataset. Finally, also on the industrial datasets, OGAR performs a stronger oversampling concerning SU and SBR.
4.
Conclusion
In this paper, an overview of new approaches to data resampling for the classification of imbalanced is presented. The three methods discussed in the paper are based on several criteria that are used to assess the benefits of the inclusion of single samples, either belonging to the frequent class or new synthetic rare samples, to a dataset for the training of an arbitrary classifier. GA is exploited to determine, according to the deriving rankings, which ones are the samples to include to the dataset, based on a fitness function that measures the performance of the classifier given the candidate solutions. Among the proposed methods, two of them autonomously combine over and undersampling, while one of them performs only undersampling. The performance achieved by the methods on a representative set of problems put into evidence the goodness of the new approaches for which the improvement, in terms of performance and mainly of TPR, are marked for standard yet widely used methods. Moreover, the methods can determine the optimal resampling rate for the handles dataset automatically as a result of the GA process. Among the presented techniques, OGAR and SBR, which combine over and undersampling, seem to achieve better results. It is worth to note that SBR reaches very satisfactory performance operating minor changes in the original datasets. In light of the achieved results, the family of techniques discussed in this paper will be an object of further research in order to advance the base
methodology. In particular, the introduction of new criteria for samples assessment will be evaluated as well as different techniques for synthetic samples production and data clusterization.
References
[1] A. Borselli, V. Colla, M. Vannucci, and M. Veroli, “A fuzzy inference system applied to defect detection in flat steel production,” in International Conference on Fuzzy Systems, 2010, pp. 1–6, doi:
10.1109/FUZZY.2010.5584036.
[2] M. Vannucci and V. Colla, “Classification of Unbalanced Datasets and Detection of Rare Events in Industry: Issues and Solutions,” 2016, pp. 337–351, doi: 10.1007/978-3-319-44188-7_26.
[3] M. A. Mazurowski, P. A. Habas, J. M. Zurada, J. Y. Lo, J. A. Baker, and G. D. Tourassi, “Training neural network classifiers for medical decision making: The effects of imbalanced datasets on classification performance,” Neural Networks, vol. 21, no. 2–3, pp. 427–436, Mar. 2008, doi:
10.1016/j.neunet.2007.12.031.
[4] J.-J. Liao, C.-H. Shih, T.-F. Chen, and M.-F. Hsu, “An ensemble-based model for two-class imbalanced financial problem,” Econ. Model., vol. 37, pp. 175–183, Feb. 2014, doi: 10.1016/j.econmod.2013.11.013. [5] N. S. Sani, M. Abdul Rahman, A. Abu Bakar, S. Sahran, and H. Mohd Sarim, “Machine Learning Approach
for Bottom 40 Percent Households (B40) Poverty Classification,” Int. J. Adv. Sci. Eng. Inf. Technol., vol. 8, no. 4–2, p. 1698, Sep. 2018, doi: 10.18517/ijaseit.8.4-2.6829.
[6] Haibo He and E. A. Garcia, “Learning from Imbalanced Data,” IEEE Trans. Knowl. Data Eng., vol. 21, no. 9, pp. 1263–1284, Sep. 2009, doi: 10.1109/TKDE.2008.239.
[7] A. Estabrooks, T. Jo, and N. Japkowicz, “A Multiple Resampling Method for Learning from Imbalanced Data Sets,” Comput. Intell., vol. 20, no. 1, pp. 18–36, Feb. 2004, doi: 10.1111/j.0824-7935.2004.t01-1-00228.x.
[8] N. Japkowicz and S. Stephen, “The class imbalance problem: A systematic study1,” Intell. Data Anal., vol. 6, no. 5, pp. 429–449, Nov. 2002, doi: 10.3233/IDA-2002-6504.
[9] Y. Sun, A. K. C. Wong, and M. S. Kamel, “Classification of Imbalanced Data: a Review,” Int. J. Pattern
Recognit. Artif. Intell., vol. 23, no. 04, pp. 687–719, Jun. 2009, doi: 10.1142/S0218001409007326.
[10] M. Vannucci, V. Colla, M. Sgarbi, and O. Toscanelli, “Thresholded Neural Networks for Sensitive Industrial Classification Tasks,” 2009, pp. 1320–1327, doi: 10.1007/978-3-642-02478-8_165.
[11] M. Vannucci and V. Colla, “Novel classification method for sensitive problems and uneven datasets based on neural networks and fuzzy logic,” Appl. Soft Comput., vol. 11, no. 2, pp. 2383–2390, Mar. 2011, doi:
10.1016/j.asoc.2010.09.001.
[12] V. Soler and M. Prim, “Rectangular Basis Functions Applied to Imbalanced Datasets,” 2007, pp. 511–519, doi: 10.1007/978-3-540-74690-4_52.
[13] Yuchun Tang, Yan-Qing Zhang, N. V. Chawla, and S. Krasser, “SVMs Modeling for Highly Imbalanced Classification,” IEEE Trans. Syst. Man, Cybern. Part B, vol. 39, no. 1, pp. 281–288, Feb. 2009, doi:
10.1109/TSMCB.2008.2002909.
[14] R. Batuwita and V. Palade, “FSVM-CIL: Fuzzy Support Vector Machines for Class Imbalance Learning,”
IEEE Trans. Fuzzy Syst., vol. 18, no. 3, pp. 558–571, Jun. 2010, doi: 10.1109/TFUZZ.2010.2042721.
[15] Y. Sun, M. S. Kamel, A. K. C. Wong, and Y. Wang, “Cost-sensitive boosting for classification of imbalanced data,” Pattern Recognit., vol. 40, no. 12, pp. 3358–3378, Dec. 2007, doi: 10.1016/j.patcog.2007.04.009. [16] Z. Yuan, D. Bao, Z. Chen, and M. Liu, “Integrated Transfer Learning Algorithm Using Multi-source
TrAdaBoost for Unbalanced Samples Classification,” in 2017 International Conference on Computing
Intelligence and Information System (CIIS), 2017, pp. 188–195, doi: 10.1109/CIIS.2017.37.
[17] N. V. Chawla, K. W. Bowyer, L. O. Hall, and W. P. Kegelmeyer, “SMOTE: Synthetic Minority Over-sampling Technique,” J. Artif. Intell. Res., vol. 16, pp. 321–357, Jun. 2002, doi: 10.1613/jair.953.
[18] V. García, J. S. Sánchez, and R. A. Mollineda, “On the effectiveness of preprocessing methods when dealing with different levels of class imbalance,” Knowledge-Based Syst., vol. 25, no. 1, pp. 13–21, Feb. 2012, doi:
10.1016/j.knosys.2011.06.013.
[19] F. Charte, A. J. Rivera, M. J. del Jesus, and F. Herrera, “Addressing imbalance in multilabel classification: Measures and random resampling algorithms,” Neurocomputing, vol. 163, pp. 3–16, Sep. 2015, doi:
10.1016/j.neucom.2014.08.091.
[20] G. E. A. P. A. Batista, R. C. Prati, and M. C. Monard, “A study of the behavior of several methods for balancing machine learning training data,” ACM SIGKDD Explor. Newsl., vol. 6, no. 1, p. 20, Jun. 2004, doi: 10.1145/1007730.1007735.
[21] J. Laurikkala, “Improving Identification of Difficult Small Classes by Balancing Class Distribution,” 2001, pp. 63–66, doi: 10.1007/3-540-48229-6_9.
[22] N. Japkowicz, “The Class Imbalance Problem: Significance and Strategies,” Proc. 2000 Int. Conf. Artif. Intell., 2000, doi: 10.1.1.35.1693.
[23] S.-J. Yen and Y.-S. Lee, “Cluster-based under-sampling approaches for imbalanced data distributions,”
Expert Syst. Appl., vol. 36, no. 3, pp. 5718–5727, Apr. 2009, doi: 10.1016/j.eswa.2008.06.108.
[24] E. Ramentol, Y. Caballero, R. Bello, and F. Herrera, “SMOTE-RSB *: a hybrid preprocessing approach based on oversampling and undersampling for high imbalanced data-sets using SMOTE and rough sets theory,” Knowl. Inf. Syst., vol. 33, no. 2, pp. 245–265, Nov. 2012, doi: 10.1007/s10115-011-0465-6. [25] S. Cateni, V. Colla, and M. Vannucci, “A method for resampling imbalanced datasets in binary classification
tasks for real-world problems,” Neurocomputing, vol. 135, pp. 32–41, Jul. 2014, doi:
10.1016/j.neucom.2013.05.059.
[26] H. Hartono, O. S. Sitompul, T. Tulus, and E. B. Nababan, “Biased support vector machine and weighted-smote in handling class imbalance problem,” Int. J. Adv. Intell. Informatics, vol. 4, no. 1, p. 21, Mar. 2018, doi: 10.26555/ijain.v4i1.146.
[27] M. Vannucci and V. Colla, “Smart Under-Sampling for the Detection of Rare Patterns in Unbalanced Datasets,” 2016, pp. 395–404, doi: 10.1007/978-3-319-39630-9_33.
[28] M. Vannucci and V. Colla, “Genetic Algorithms Based Resampling for the Classification of Unbalanced Datasets,” 2018, pp. 23–32, doi: 10.1007/978-3-319-59424-8_3.
[29] M. Vannucci and V. Colla, “Imbalanced Datasets Resampling Through Self Organizing Maps and Genetic Algorithms,” 2019, pp. 399–411, doi: 10.1007/978-3-030-20257-6_34.
[30] K. Bache and M. Lichman, “UCI Machine Learning Repository, University of California, School of Information and Computer Science,” Irvine, CA, 2013, available at : http://archive.ics.uci.edu/ml.
[31] S. Cateni, V. Colla, and M. Vannucci, “A Hybrid Feature Selection Method for Classification Purposes,” in
2014 European Modelling Symposium, 2014, pp. 39–44, doi: 10.1109/EMS.2014.44.
[32] S. Cateni, V. Colla, and M. Vannucci, “A genetic algorithm-based approach for selecting input variables and setting relevant network parameters of a SOM-based classifier,” Int. J. Simul. Syst. Sci. Technol., 2011, available at: Google Scholar .
[33] S. Cateni, V. Colla, and M. Vannucci, “General Purpose Input Variables Extraction: A Genetic Algorithm Based Procedure GIVE A GAP,” in 2009 Ninth International Conference on Intelligent Systems Design and
Applications, 2009, pp. 1278–1283, doi: 10.1109/ISDA.2009.190.
[34] M. Sgarbi, V. Colla, S. Cateni, and S. Higson, “Pre-processing of data coming from a laser-EMAT system for non-destructive testing of steel slabs,” ISA Trans., vol. 51, no. 1, pp. 181–188, Jan. 2012, doi: