Corporate Bond Issuers
What are the mechanisms behind corporate bond finance? Whereas a lot of corporate finance research is focused on stocks, corporate bond finance is relatively unknown territory. In this thesis, we present four articles in which we study the costs and effects of financing with bonds. We follow corporate bond issuers from market entry, through subsequent issues to the stage where they repurchase their bonds. In addition to the firms themselves, important players are bondholders, shareholders, management and intermediaries (banks). In the first paper, bond market entry is studied and related to agency costs of equity. Central is the question whether shareholders benefit from the presence of bonds in the firm’s capital structure. The second paper investigates the costs of issuing bonds (in terms of yields to maturity and fees paid to underwriters) in a bank-oriented system faced with deregulation. Are bond issues by firms with strong bank ties affected differently by regulation than those by independent firms? Whether frequent bond issuers enjoy lower yields is the subject of the third paper. Do firms benefit from enhanced reputations and better market literacy when doing repeat issues? Finally, the fourth article studies firms that repurchase their bonds, with a special focus on possible wealth transfers between bondholders and shareholders.
ERIM
The Erasmus Research Institute of Management (ERIM) is the Research School (Onderzoekschool) in the field of management of the Erasmus University Rotterdam. The founding participants of ERIM are RSM Erasmus University and the Erasmus School of Economics. ERIM was founded in 1999 and is officially accredited by the Royal Netherlands Academy of Arts and Sciences (KNAW). The research undertaken by ERIM is focussed on the management of the firm in its environment, its intra- and inter-firm relations, and its business processes in their interdependent connections.
The objective of ERIM is to carry out first rate research in manage-ment, and to offer an advanced graduate program in Research in Management. Within ERIM, over two hundred senior researchers and Ph.D. candidates are active in the different research programs. From a variety of academic backgrounds and expertises, the ERIM community is united in striving for excellence and working at the forefront of creating new business knowledge.
www.erim.eur.nl ISBN 90-5892-125-5
W I L L E M S C H R A M A D E
Corporate Bond Issuers
Design: B&T Ontwerp en advies www
.b-en-t.nl Print: Haveka www .haveka.nl 92 WILLEM SCHRAMADE
Corporate Bond Issuers
Corporate bond issuers
Corporate Bond Issuers
Emittenten van bedrijfsobligaties
Proefschrift
ter verkrijging van de graad van doctor aan de Erasmus Universiteit Rotterdam
op gezag van de rector magnificus Prof.dr. S.W.J. Lamberts
en volgens besluit van het College voor Promoties. De openbare verdediging zal plaatsvinden op
donderdag 23 november 2006 om 11.00 uur.
door
Wilhelmus Leonardus Johannes Schramade
Promotiecommissie Promotor: Prof.dr. A. de Jong Overige leden: Prof.dr. C.G. Koedijk Prof.dr. M.J.C.M. Verbeek Prof.dr. S. Ongena Copromotor: Dr. P.G.J. Roosenboom
Erasmus Research Institute of Management (ERIM) RSM Erasmus University / Erasmus School of Economics Erasmus University Rotterdam
Internet: http://www.erim.eur.nl
ERIM Electronic Series Portal: http://hdl.handle.net/1765/1 ERIM Ph.D. Series Research in Management 92
ISBN-10: 90 – 5892 – 125 – 5 ISBN-13: 978- 90 – 5892 – 125 -3 © 2006, Willem Schramade
All rights reserved. No part of this publication may be reproduced or transmitted in any form or by any means electronic or mechanical, including photocopying, recording, or by any information storage and retrieval system, without permission in writing from the author.
Acknowledgments
Chapters 2-5 of this study are based on working papers or forthcoming articles. Chapter 2 is based on Schramade (2006). Chapters 3-5 are based on joint work with Abe de Jong and Peter Roosenboom; see Roosenboom, de Jong and Schramade (2006a, b) and Schramade, de Jong and Roosenboom (2006).
Foreword
Four years ago I decided to quit my prestigious but ill-fitting job at GE and venture into something genuinely interesting: a PhD trajectory in Rotterdam with ERIM. This turned out to be a good choice and I never regretted it for a single second. The past four years have been very rewarding and it was great to have such nice and interesting colleagues. My greatest thank goes to Peter and Abe for their excellent supervision. If more PhD students had such supervision, drop-out rates would be much lower. I also appreciated having good roommates (Petra, Maarten and Patrick) and being surrounded by unique characters such as Erik (never wary of a controversial opinion) and Emiel (the sheep expert). Definite highlights were the acceptation of our article in The Journal of
Corporate Finance, and the trip to Japan.
Still, all good things come to an end (to be replaced by even better experiences, of course). Moreover, I felt it was time to start something new and develop a different set of skills. This is where PwC came in, offering me a promising opportunity to go into consulting, while staying involved in research and teaching. The best of both worlds, I feel.
Of course these four years have not been limited to professional life. I have come to appreciate Rotterdam as a great place to live. It’s a pity this still seems beyond comprehension for many. In my limited spare time, I very much enjoyed the eating and drinking sessions with friends at places like Westerpaviljoen and Kralingse Plas. I hope we continue to do this. My special thanks goes to Mark and Maarten who introduced me to the city even before joining ERIM. Eliane, I probably learned even more from you than from the PhD-trajectory. Hopefully, more good things are ahead. Finally, I thank my family and notably my mom for their persistent support and interest in my well-being. In spite of some medical setbacks, I think our bonds have only grown stronger.
Willem Schramade Rotterdam September 2006
Table of contents
ACKNOWLEDGMENTS...V FOREWORD ...VII TABLE OF CONTENTS ... IX
CHAPTER 1 INTRODUCTION...1
1.1 BACKGROUND ON CORPORATE BONDS...1
1.2 LITERATURE REVIEW...2
1.3 OUTLINE OF THE THESIS...6
CHAPTER 2 BOND MARKET ENTRY AROUND THE WORLD: DOES PUBLIC DEBT DISCIPLINE MANAGERS?...9
2.1. INTRODUCTION...9
2.2 LITERATURE REVIEW AND HYPOTHESES...10
2.3 SAMPLE AND DATA DESCRIPTION...13
2.3.1 Sample formation ...13
2.3.2 Firm characteristics...18
2.3.3 Issue characteristics...20
2.4 RESULTS...22
2.4.1 Event study results and univariate analysis ...22
2.4.2 Regression results ...24
2.4.3 Robustness checks ...28
2.5 SUMMARY AND CONCLUSIONS...31
CHAPTER 3 BOND UNDERWRITING FEES AND KEIRETSU AFFILIATION IN JAPAN...35
3.1 INTRODUCTION...35
3.2 LITERATURE AND HYPOTHESES...36
3.2.1 Keiretsu...36
3.2.2 Weaker banks ...37
3.2.3 Bond market development ...38
3.2.4 Fees...39
3.3 DATA AND DESCRIPTIVE STATISTICS...40
3.3.1 Data ...40
3.3.2 Descriptive statistics ...41
3.4 METHODOLOGY...48
3.5 RESULTS...50
3.6 SUMMARY AND CONCLUSIONS...61
CHAPTER 4 ISSUE FREQUENCY AND CORPORATE BOND YIELDS...63
4.1 INTRODUCTION...63
4.2DATA AND METHODOLOGY...66
4.2.2 Methodology ...66
4.3 RESULTS...69
4.3.1 Descriptive statistics ...69
4.3.2 Does issue frequency affect yield spreads?...77
4.3.3 Robustness discussion ...84
4.4 CONCLUSIONS...86
CHAPTER 5 WHO BENEFITS FROM BOND TENDER OFFERS IN EUROPE? ...89
5.1 INTRODUCTION...89
5.2 LITERATURE REVIEW AND HYPOTHESES...91
5.2.1 Literature review on tender offers...91
5.2.2 Tender premium hypotheses...92
5.2.3 Stock price reaction hypotheses ...93
5.3 DATA...94
5.4 EMPIRICAL RESULTS...97
5.4.1 Descriptive statistics ...97
5.4.2 Determinants of tender premiums...102
5.4.3 Determinants of abnormal announcement returns...103
5.5 CONCLUSIONS...105
CHAPTER 6 CONCLUSIONS ...107
SAMENVATTING (SUMMARY IN DUTCH) ...113
REFERENCES ...117
Chapter 1 Introduction
1.1 Background on corporate bonds
Corporate bond markets have experienced a spectacular growth over the past decade. In the Eurozone, the amount of straight corporate bonds outstanding has grown from just over € 300 billion in 1995 to 1050 billion in 20051. US bond markets are even larger. And even though stocks receive much more media attention, bond issues by far exceed equity issues2. Thus, the importance of bond finance to corporations can hardly be overestimated.
In a financial sense, bonds are certificates of debt issued by a government or corporation that guarantee payment of the borrowed amount plus interest by a specified future date. In normal speech however, bonds can also refer to connections, restraints, ropes, chains, or legal agreements. As a verb, ‘to bond’ means to bring together, create ties, develop a relationship, or join firmly. Hence, bonds are associated with relationships, in both positive and negative senses. As we will see in Chapter 2, this dual connotation also holds for corporate bonds.
Bonds are an important source of finance for corporations, but they are certainly not the only one. Firms usually finance their operations with a combination of securities. This mix is referred to as the firm’s capital structure. Debt versus equity is generally seen as the most important distinction here, but there are also various categories within and between these two archetypes. For example, convertible bonds and preferred equity have features of both debt and equity. Within debt, one can distinguish between private (or inside) debt (e.g., bank debt) and public (or outside) debt, of which corporate bonds are the most common version. Still, even bonds come in many guises, as they may or may not have covenants attached, have floating, fixed or zero rates, and all kinds of option features. See Fabozzi (2001) for an extensive overview.
Surprisingly, bonds have received little research attention in comparison to stocks. This is slowly changing though, probably because some recent developments have put bonds in the spotlight. As mentioned above, bond markets have grown enormously, especially
1 Eurostat, Bond market statistics, March 2006.
2 In 2005, global equity issuing amounted to US$ 513 billion, while total non-government bond issuance
(including asset-backed, mortgage-backed and municipals) reached US$ 5733 billion. Source: Thomson ONE Banker Volume Analysis.
over the past decade. Back in the 1980s, bonds were used in a wave of leverage buy-outs (LBOs) instigated by Michael Milken and Drexel Burnham Lambert (see Bruck [1989] for a vivid account) and bond market traders temporarily reached star status, considering themselves ‘masters of the universe’ (Lewis, 1999; Wolfe, 1989). In the 1990s, speculation in bonds with option features resulted in multi-billion dollar losses for Orange County and other local government investors in the US (see for example Partnoy, 1998). In recent years, the scandals at Enron and Parmalat and the downgradings of large firms such as GM and Ford have received quite some attention and raised questions about the functioning of the agencies that rate bonds and bond-issuing firms.
In this thesis, we investigate the use of bond finance by corporations. Following the lifecycle of bond issuers, we study how the presence of bonds affects firm value and which factors influence the cost of bond finance. In four separate research projects, we investigate (i) the disciplinary power of bonds when the firm enters the bond market, (ii) the relation between issuing costs and bank ties, (iii) the way bond yields are affected when the firm issues more frequently, and (iv) the conflict of interest between stockholder and bondholders when firms buy back their own bonds. In the next subsection, we start with a literature review of research related to corporate bond finance.
1.2 Literature review
In this subsection we will first discuss capital structure in general and then focus on debt structure, i.e. the distinction between bonds and private debt (notably bank debt). Subsequently, we will review the various costs of bond finance: yields paid to bondholders, fees paid to underwriters, and, potentially, stock price reactions.
Capital structure
Modigliani and Miller (1958) show that the firm’s capital structure is irrelevant for firm value in a perfect market because shareholders can mimic any capital structure. This is an important result, since it provides guidance to finding out when capital structure does matter, i.e. in the presence of market imperfections. These imperfections include taxes, costs of distress, information asymmetries, and agency costs. Due to the tax deduction of interest payments, debt provides a valuable tax shield (Modigliani and Miller, 1963). However, as Miller (1977) notes, this advantage also depends on the taxes that investors pay on the dividends, capital gains and interest they receive. As a result, investors may have varying preferences and firms can cater to different clienteles. More debt may save taxes, but it also increases the costs of financial distress. Kraus and Litzenberger (1973) build a model where the cost of financial distress is traded off against the tax benefits of debt. Another imperfection stems from information asymmetry: managers are likely to have better information regarding the true value of the firm than investors have and this might affect the firm’s capital structure choices. Ross (1977) shows that managers of high quality firms may increase debt to make a credible signal about the value of the firm. The signal is credible because costs of distress make such a signal too expensive for low quality firms. Furthermore, Myers and Majluf (1984) identify a lemons problem (Akerlof, 1970) in the equity issuance market: undervalued firms have incentives not to issue
equity, while it is very tempting for overvalued firms to do an equity issue. Investors anticipate this and will interpret an equity issue as bad news. In this pecking order, firms will prefer to finance their investments with internal cash or with debt issues and regard an equity issue as a last resort. Product market imperfections might also affect capital structure: Brander and Lewis (1986) show that in oligopolistic markets, firms with much debt have strong incentives to pursue an aggressive (high output) strategy, since shareholders are only interested in the states of the world in which debt is paid back in full. The fifth and final imperfection we discuss is the presence of agency costs, i.e. conflicts of interest between the stakeholders of the firm. Agency costs of debt concern the diverging interests between shareholders and debtholders. Two forms are identified. First, there is the risk of asset substitution or risk shifting: since debt is paid first, the presence of debt effectively turns equity into a call option and thus creates an incentive for risk seeking (Jensen and Meckling, 1976). Second, there is the underinvestment or debt overhang problem (Myers, 1977): projects might have a positive NPV from a firm’s perspective, but might not be beneficial to (and might thus be rejected by) shareholders if the cash inflows from the investment are used mainly to pay off debtholders. In Stulz (1990), both types of agency costs of debt are combined in one model to obtain an optimal capital structure. We note that the stockholder-bondholder conflict is often mitigated by including covenants in bonds, which impose restrictions on the actions that management can take to the detriment of bondholders (see for example Smith and Warner, 1979). Agency costs of equity refer to the conflict of interest between shareholders and the managers they hired to run the firm. Here, debtholders are not a direct party, but can affect the relation because the firm has the obligation to service the debt. Jensen (1986) argues that debt helps to discipline managers because the obligatory interest payments reduce the free cash flows that managers have at their discretion. Zwiebel (1996) formalizes this and shows that the disciplinary power of debt is largest when managers are not entrenched. However, Stulz (1988) argues that debt can also be used by insiders to keep a control lock, since it allows them to attract finance without diluting their ownership. However, this effect is mitigated since investors will value the firm accordingly. In the next chapter of this thesis, we will show that both these conflicting forces are at work in firms that enter the bond market.
Public versus private debt
Bonds are classified as public or arm’s-length debt since they are tradable and do not involve a close relationship between lender and borrower. In contrast, relations are much closer in case of private debt and especially bank debt, which is often accompanied by an array of services. As a result, there is more information exchange between the parties. The distinction between public and private debt (or outside and inside debt) has attracted quite some research attention. The advantages of inside/private debt, especially if provided by banks, are emphasized by Campbell and Kracaw (1980) and Fama (1985). According to Campbell and Kracaw (1980), banks have a comparative cost advantage due to their information production (access to information that is not publicly available) and are hence superior monitors. Fama (1985) stresses that for small firms, the contracting costs of bank (inside) debt are lower than for outside (public) debt. Bank loans are short-term and the renewal process triggers periodic evaluation of the firm's payment abilities. However, Sharpe (1990) and Rajan (1992) argue that banks misuse
private information to extract rents from their customers. Morck and Nakamura (1999) indeed find evidence of rent-seeking behavior by Japanese banks. In the model of Berlin and Loeys (1988), the choice between public and private debt reflects a tradeoff between the inefficiencies of rigid bond covenants and the agency costs of hiring a delegated monitor. And in Bolton and Freixas (2000) there is a tradeoff between the financial flexibility (reorganizational skills) of banks and the lower intermediation cost of bonds. Datta et al. (2000) investigate the situation where firms go to the bond market for the first time (do a bond IPO) and partly shed their bank ties They find negative stock price reactions to bond IPOs, which are mitigated when bank monitoring is continued. Thus, it seems that bank loans result in better monitoring and disciplining than bonds. Still it is not clear whether there is disciplinary power in public debt. We will investigate this further in the next chapter by relating the stock reactions to bond IPO announcements to the bond’s potential for reducing agency costs.
Bond yields
In comparison to equity, the pricing of bonds seems straightforward. In principle, bond prices result from discounting a clear pattern of promised cash flows. However, the rates (yields) at which these cash flows need to be discounted vary, as interest rates fluctuate over time. In addition, interest rates also differ across maturities, which is referred to as the term structure of interest rates: the array of prices or yields on bonds with different terms to maturity. There is a large strand of literature concerned with modeling bond prices and price changes of bonds after issuing (see for example Marsh [1995] for an overview). However, in this thesis we will focus on pricing at issue, since this is most relevant for the firm. Cash flows may be promised, but they are not certain. Much more than most sovereign bonds, corporate bonds carry default risk. Fisher (1959) finds that default risk is the prime determinant of the risk premium on a firm's bonds. The marketability or liquidity or a bond is the second most important determinant. Cohan (1962) is probably the first to empirically examine the determinants of yield spreads on corporate bonds. He finds that for yields to be comparable across bonds, one at least has to control for rating, type of bond and maturity. Larger firms with more stable cash flows have lower yields. In subsequent research, additional factors were identified that affect the yield spread. The reputation of the bond’s underwriters is one such factor, as Livingston and Miller (2000) and Fang (2002) document that reputable banks obtain lower yields. Moreover, competition is important. Gande et al. (1999) and Takaoka and McKenzie (2005) find that yields have declined significantly with commercial bank entry to the underwriting market, in the US and Japan respectively. Corporate governance also seems to matter as Klock et al. (2005) find that antitakeover governance provisions lower the cost of debt financing. In addition, Miller (2002) reports that investors demand economically significant premiums on bonds issued by firms that do not have a prior history of on-going disclosure or are located in countries that do not protect investors' rights. Datta et al. (1999) document that the existence of bank debt lowers at-issue yield spreads for bond IPOs by about 68 basis points on average, thanks to valuable bank monitoring. Bae et al., (1997) and Crabbe (1991) find that event-risk covenants, which are aimed at preventing extreme risk shifting, significantly lower yields. Recent papers (Henderson et al., 2006; Miller, 2002; McBrady and Schill, 2005) show that firms also purposely issue bonds abroad or in different currencies to benefit from lower yields.
Moreover, firms issue more when interest rates are lower (Barry et al., 2004; Henderson
et al., 2006) and use debt market conditions in an effort to determine the lowest-cost
maturity at which to borrow (Baker et al., 2003). However, not all firms are equally likely to be able to exploit favorable market conditions. We expect that frequent bond issuers should have better market knowledge than infrequent issuers, which should allow them to obtain lower yields. We will investigate this relation between issue frequency and yields in Chapter 4 of this thesis.
Underwriting fees
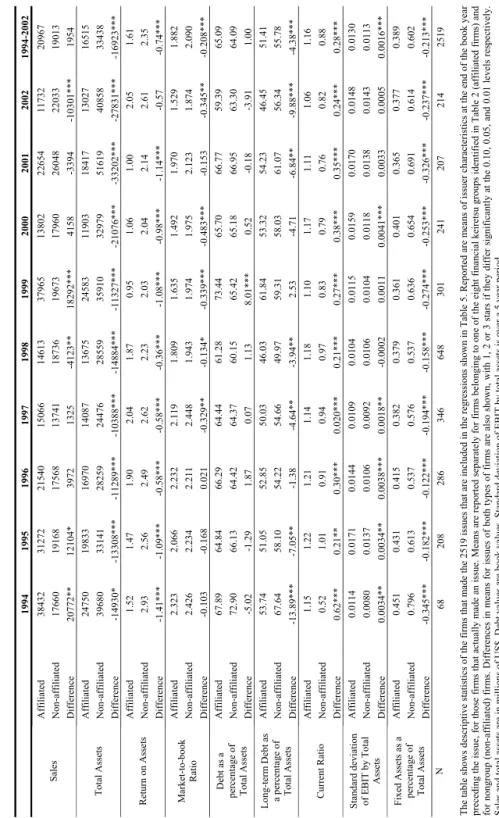
When issuing their bonds, firms are usually assisted by underwriters to bring their bonds to the market. The underwriter buys the bonds from the firm and subsequently sells them to investors at the risk of being stuck with bonds that are hard to sell. As a result, the underwriter is effectively short in a put option (Smith, 1977). In compensation for running this risk and for other services, the underwriter charges fees. Not surprisingly, these fees are found to increase in the risk of the issue. For example, Esho et al. (2004) find that fees on Eurobonds are higher for issues denominated in less liquid and higher risk currencies, with longer maturity, and with greater credit risk. Foster (1989) finds higher fees for issues with low ratings. Counter to the positive relation with risk, he finds lower fees for larger issues. However, Altinkilic and Hansen (2000) show that this effect is misleading because larger issues are generally done by larger firms, which tend to be safer. As in yields, underwriter reputation and competition also matter for fees. Chemmanur and Fulghieri (1994) formally show that high reputation underwriters can charge higher fees because they are more effective in reducing info asymmetries. Empirically, Fang (2002) and Roten and Mullineaux (2002) find that high reputation underwriters indeed charge higher fees. Furthermore, fees are found to fall as competition among underwriters increases (e.g., Gande et al., 1999; Santos and Tsatsaronis, 2003; Takaoka and McKenzie, 2005). In addition, fees can be affected by bank ties. Yasuda (2005) finds a significant fee discount when there are relationships between firms and commercial banks. However, we suspect that bank ties might have a flip side: firms that are dependent on banks may see their risk increase as these banks become weaker, which should be visible in fees. In Chapter 3 we will explore this further.
Stock price reactions
In addition to the interest and fees that firms pay on their bonds, they might incur costs in the form of adverse stock price reactions. However, Eckbo (1986) and Mikkelson and Partch (1986) find no significant stock price reaction to straight debt issues. Still, there seem to exceptions for specific types of bonds or firms. For example, Pilotte (1992) finds that mature firms have negative announcements effects to straight bond offerings, while growth firms experience no significant price changes. And Datta et al. (2000) find negative stock price reactions to bond IPOs, which they explain by reduced bank monitoring and increased maturity. In some cases, stock price reactions are actually positive, such as in Miller (2002) for Yankee bond offerings (bonds sold by foreign firms in the US) and in Johnson (1995) for bond issues by low-growth low-dividend firms, which supports arguments that debt and dividends are substitutes. The reverse of bond issues, i.e. bond tender offers, are found to result in positive stock price reactions for distressed firms (Chatterjee et al., 1995) but are non-significant for broader samples
(Kruse et al., 2005). In Chapter 5 we will also examine stock price reactions for bond tender offers. In contrast to the previous research, we will do so for a European sample of more mature firms where distress is less of a motive and tenders are likely to have different drivers. Moreover, we will relate stock returns to bond returns to see if there is stockholder-bondholder conflict in bond tenders.
Stockholder-bondholder conflict
As discussed above, stockholder-bondholder conflict refers to the possibility of wealth transfers between stockholders and bondholders. These may occur through dividends. However, Long et al. (1994) find no evidence of wealth transfers from bondholders to stockholders by manipulation of dividend policy following bond issues. Their evidence is consistent with firms being restrained by reputation, less so by covenants. Maxwell and Stephens (2003) do find bondholder losses in stock repurchases, which increase in the size of the repurchase and in the risk of the firm's debt. Levy and Sarnat (1970) argue that bondholders win in M&A since the cash flows of the combined firm become safer (coinsurance effect). However, bondholders might also loose when new debt is issued simultaneously (e.g., Chowdry and Nanda, 1993). Empirical evidence is mixed, though target firm bondholders seem to fare better than acquirer bondholders (e.g., Billett et al., 2004). Constistent with the coinsurance argument, Maxwell and Rao (2003) find bondholder losses of 0.6-0.9% at spin-off announcements. Parrino and Weisbach (1999) measure the magnitude of the stockholder-bondholder conflict in specific projects, using Monte Carlo simulation. They find distortions both toward turning down positive NPV projects (underinvestment) and toward taking negative NPV projects (overinvestment). Underinvestment increases in leverage and the firm’s cash flow volatility, whereas overinvestment increases in project cash flow volatility and the correlation between project and firm cash flows. Mann and Powers (2005) find that bondholders receive significant premiums in bond tender offers but do not investigate returns to shareholders. We will fill this gap in Chapter 5.
1.3 Outline of the thesis
This thesis is composed of four research projects, in which we follow the lifecycle of bonds and bond issuers. Firms that start to issue bonds are typically mature firms with limited need for bank support and financing needs that are large enough to warrant the higher fixed costs of borrowing at arm’s length. As firms start issuing more often, their reputation strengthens and their dependence on banks further diminishes, unless banks are also shareholders in the firm. Moreover, when firms issue even more frequently, they learn to spot opportunities in the market and obtain better pricing in the form of lower yields. At some stage however, the market may consider the firm to be over-issuing and will adapt pricing to reflect increased risk. Finally, the firm’s management might think for some reason that its mix of outstanding bonds is suboptimal and may therefore engage in buying back the firm’s bonds.
In the first project (Chapter 2) we examine a sample of 225 firms from 37 countries that access the bond market for the first time during 1995-2003. By relating stock price
reactions to agency cost proxies, we test whether bonds discipline management. We find that bond market entry is received unfavorably when the debt issue is motivated by keeping a lock on control. In contrast, when free cash flow is high and dividends are low, discipline is expected to increase due to bond market entry, and stock price reactions are more positive. The strength of these relations is found to be affected by differences in shareholder protection across countries. The impact of free cash flow is larger when investor protection is stronger, whereas dividends and control locks play a more important role in countries with weaker shareholder protection.
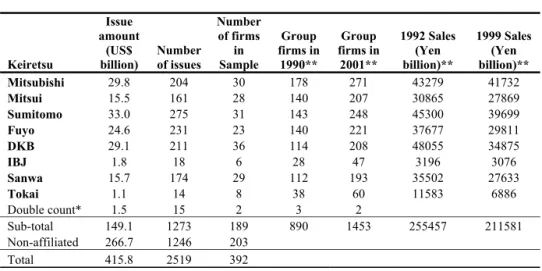
In Chapter 3, we focus on bond issuers that have to adapt to a changing environment in terms of bond market access and bank ties. We relate bank ties and fees on corporate bond issues. The sample consists of bonds issued by Japanese corporations in the years 1994-2002, a period of deregulation beneficial to bond markets and detrimental to banks. Over time, we find that fees have increased for those firms that are related to bank-led (financial) keiretsu, even after controlling for risk factors. This is in sharp contrast to the simultaneous trend of falling fees for firms that do not belong to keiretsu. These firms benefited from increased underwriter competition due to deregulation. Moreover, we find that the higher fees for keiretsu firms were not offset by lower yields. It seems that, against the background of bond market deregulation and weaker banks, keiretsu membership had become a burden rather than an advantage.
Chapter 4 investigates how the cost of bond finance changes when firms start issuing more often. We therefore document bond issue frequency for windows from one week to six years for the 592 US firms that issued at least once in US$ during 2001-2003. We find that frequent bond issuers obtain economically significant yield spread discounts vis à vis less frequent issuers. For large firms, issue frequency in windows up to one year matters most, which is consistent with benefits through increasing market literacy. That is, as they issue more often, they benefit from being better informed about market participants and market opportunities. For smaller firms, gaining a reputation seems more relevant than market literacy. For them, it is beneficial to be a recent issuer so as to avoid paying significant premiums.
Chapter 5 considers the situation where firms want to reduce or even terminate the amount of bonds they have outstanding. We document the € 73 billion in bond tender offers by European firms over the period 1996 to 2005. In contrast to the US, European tenders seem aimed at active balance sheet management rather than distress relief. Bondholders receive on average a 3.9% premium over the bond’s market price. Still, we find no evidence of wealth transfers from stockholders, since the average shareholder wealth effect does not differ significantly from zero and is not affected by tender premiums. Moreover, wealth effects for both bondholders and shareholders increase in the remaining time to maturity. Tendering the bonds, rather than waiting for them to mature, appears to be a valuable option for both types of financiers of the firm.
Chapter 2 Bond market entry around the
world: does public debt discipline
managers?
∗
2.1. Introduction
Entering the public bond market marks an important change for a firm. By introducing a large amount of widely held debt, the firm effectively changes the nature of its agency problems. On the one hand, the nature of debt offers the potential of increased discipline. On the other hand, debt may be used to keep a lock on control. Strikingly few studies have examined bond IPOs, which is in sharp contrast to the large body of literature on equity IPOs (e.g., Ritter and Welch, 2002). The impact of bond IPOs on agency costs of equity has received even less attention. This is surprising, since the theoretical literature has given ample reason to expect that bond IPOs mark an important change in a firm’s capital and ownership structure. For example, bonds may increase the agency costs of equity when they raise capital with the motivation of keeping a lock on control (Stulz, 1988, Bebchuk, 1999). Conversely, debt can mitigate agency costs of equity by reducing the free cash flow available for spending at the discretion of managers (Jensen, 1986). We find that the size of bond IPOs equals on average 22% of total assets prior to the offering. Hence, bond IPOs entail the introduction of a large amount of public debt where there was previously no public debt at all, while seasoned bond offers are usually plain refinancings. Bond IPOs therefore provide an excellent setting for studying the relation between public debt and agency problems of equity. So far, research on bond IPOs has almost exclusively focused on underpricing (e.g., Cai et al., 2005, Datta et al., 1997, Helwege and Kleiman, 1998). A notable exception is Datta et al. (2000) who examine stock price reactions for a sample of 143 US bond IPOs for the 1970-1994 period. They compare the monitoring role of bonds vis-à-vis bank debt. Datta et al. (2000) find negative stock price reactions to bond IPO announcements, which are in sharp contrast to
∗This chapter is based on Schramade (2006). I thank Abe de Jong, Linda van de Gucht, Peter Roosenboom and Bing Yu for their comments; as well as seminar participants at the Eastern Finance Association 2006 Annual Meetings in Philadelphia, Erasmus School of Economics, Free University of Amsterdam, Maastricht University, Nijmegen School of Management, RSM Erasmus University, University of Exeter, University of Groningen, and University of Leuven; Gerard Mertens, Harriët van Veldhoven and NIB Capital for data access; and Gerard de Kool, Menzo Reinders and Margot Snieders for research assistance. Of course, all errors remain mine.
the zero announcement effects generally found for seasoned debt offers (e.g., Eckbo, 1986). This finding confirms that bond IPOs are fundamentally different from seasoned bond offers.
The contribution of this paper is that we investigate the impact of international bond market entry on the agency costs of equity. We relate the wealth effects of 225 bond IPO announcements to free cash flow, dividends, and control locks. Since high free cash flow and low dividends indicate a need for increased disciplining, a bond IPO should in those cases be good news for shareholders. Conversely, bond IPOs motivated by the desire to keep a lock on control should negatively affect shareholder wealth. The control lock motivation seems most appropriate at threshold levels of ownership, i.e. where insiders have just enough voting power to remain entrenched. The second contribution of this paper lies in its international sample of firms from 37 countries. This allows us to examine the role of shareholder protection, which is likely to affect the nature of the agency problem and the impact of the bond IPO. For example, Bebchuk (1999) and LaPorta et al. (1999) show that control locks are more important when private benefits are high and shareholder protection is weak.
We find that there is indeed a disciplining role of new public debt and that it varies with international differences in shareholder protection. In contrast to Datta et al.’s (2000) findings, we fail to find a significantly negative stock price reaction to the announcement of the bond IPO. However, the variance in stock price reactions is very high, indicating that bond IPOs can have a major equity value impact for many firms. Free cash flow, dividends and control locks are found to be important drivers of announcement returns. That is, stock price reactions are more favorable for firms that appear to be in need of additional disciplining, as evidenced by high free cash flow or low dividends. Announcement returns are more negative for firms that seem to be motivated by keeping a lock on control. Moreover, the size of these effects is not uniform around the globe, but varies with shareholder rights. Free cash flows are more important in countries where investor protection is strong, such as in the Anglo-Saxon countries. Where shareholder rights are weaker, dividends and keeping a lock on control tend to be more relevant. The remainder of this paper is organized as follows. Section 2 gives an overview of previous research and our hypothesis building. Sample selection and descriptive statistics are given in Section 3. Section 4 describes the results of the event study, as well as univariate and multivariate analyses. Section 5 summarizes and concludes.
2.2 Literature review and hypotheses
Bond IPOs have received limited research attention so far. Cai et al. (2005), Datta et al. (1997), and Helwege and Kleinman (1998) study bond IPO underpricing. Datta et al. (1999) find that the presence of bank debt lowers at-issue yield spread of bond IPOs. Closest in set-up to our paper are Datta et al. (2000), since they also study wealth effects and they consider agency costs by comparing the disciplining role of bank debt versus bonds. For a sample of 143 US bond IPOs in the 1970-1994 period, Datta et al. (2000)
find a negative announcement effect. Negative wealth effects are consistent both with debt maturity theories (e.g., Flannery, 1986) and with some debt ownership theories. According to some debt ownership theories, banks are superior monitors (e.g., Campbell and Kracaw, 1980, Fama, 1985), in which case a reduction in bank debt should be bad news for shareholders. Others argue that banks may misuse their private information (bank hold-up or bank monopoly power) to expropriate clients (e.g., Rajan, 1992, Sharpe, 1990). A reduction in bank debt should then be bad news for shareholders. Datta et al.‘s (2000) findings are consistent with the view that banks are better monitors than bondholders. However, they do not test what determines the disciplining power in public bonds. To fill this gap in the literature, we will relate the wealth effects of bond IPO announcements to proxies for the need of additional discipline: free cash flow, dividends and control locks.
The free cash flow hypothesis (Jensen, 1986) posits that debt reduces the agency costs of free cash flow or overinvestment by reducing the cash flow available for spending at the discretion of managers. Debt forces managers to disgorge cash rather than spend it on investments with negative net present values. This effect might be stronger for public debt than for private debt. First, defaults of public debt are more visible than those of private debt. Second, private debt holders such as banks may have dual roles as creditors and shareholders, which constrains their incentives to advance shareholders’ interests (Morck and Nakamura, 1999). Although dispersed public debt might yield coordination problems when renegotiating, Bolton and Scharfstein’s (1996) model suggests that these coordination problems might actually improve the disciplinary role of debt as it increases management’s incentives to deter default. Zwiebel (1996) shows that managers have an incentive to discipline themselves as they trade off empire building with ensuring sufficient efficiency to prevent control changes. The overinvestment problem particularly applies to firms with high free cash flow, as these are more likely to undertake value-destroying mergers. Thus, the higher a firm’s free cash flow, the more in need it is of additional disciplining, and the more shareholders will appreciate a bond issue. We therefore expect a positive relation between free cash flow and abnormal stock reactions. Hypothesis 1: free cash flow has a positive effect on abnormal returns to bond IPO announcements.
The trade-off in Zwiebel’s (1996) model predicts that managers’ incentives to discipline themselves increase as control changes become more likely. Empirical evidence indicates that this incentive is indeed absent when managers are entrenched. For example, De Jong and Veld (2001) find that entrenched Dutch managers avoid debt when it is most disciplining. Berger et al. (1997) document leverage increases in the aftermath of entrenchment reducing shocks. Therefore, we expect the role of free cash flow to be most effective at low levels of management entrenchment, i.e. when shareholder protection is high and concentrated is low. At high levels of shareholder protection, minority shareholders have better chances of effectively challenging management and large shareholders in court, for example over expropriation issues. As a result, the effectiveness of bond discipline should be higher (and the relation with stock price reaction more positive) when shareholder protection is strong.
Hypothesis 2A: the positive relation between free cash flow and abnormal announcement returns is stronger when shareholder protection is high.
At low levels of ownership concentration, management is less likely to be entrenched. As the chance of losing control thus becomes more real, management will have more incentives to discipline itself and will be more likely to initiate the bond IPO for that reason.
Hypothesis 2B: the positive relation between free cash flow and abnormal announcement returns is stronger when concentrated ownership is low.
Dividends are another way to increase discipline. Jensen (1986) claims that debt is a better way for managers to bond themselves than dividends are, since dividends can be reduced in the future. However, there are good reasons to suspect that dividends can substitute for debt. First, dividend reductions are costly since they usually result in significant stock price declines (e.g., Aharony and Swary, 1980). Second, higher dividends will, ceteris paribus3, result in a higher dependence of the firm on capital markets. Dividends thus keep firms in the capital market, where monitoring of managers is available at low cost (Easterbrook, 1984). So, the more dividends a firm pays, the less likely it seems to need additional disciplining in the form of debt.
Hypothesis 3: dividends and abnormal returns to bond IPO announcements are negatively related.
Indeed, Johnson (1995) finds this negative relation between dividends and stock price reactions to seasoned debt offers, which supports the argument that debt and dividends are substitutes. The lower the level of dividends, the higher the need for additional discipline with bonds, ceteris paribus. We expect this substitution effect to be even stronger in countries where shareholder protection is weak. As LaPorta et al. (2000) argue, a reputation for good treatment of shareholders is worth most in countries with weak protection of minority shareholders, since those shareholders have little else to rely on. They lack the legal power to extract dividends, which also explains why LaPorta et al. (2000) find that dividends are lower in countries with weaker investor protection. Moreover, the dividend signal may be stronger there, since the cost of attracting new capital is higher (and the loss of private benefits is larger) when investor protection is weak.
Hypothesis 4A: the negative relation between dividends and abnormal announcement returns is stronger when shareholder protection is poor.
In a similar vein, the need for increased discipline with bonds is higher when concentrated ownership is high. A controlling position typically results in a discount of firm value because more expropriation is expected. Increased discipline (by either bonds
3 Of course, at very high levels of firm cash holdings, this relation will not hold. We therefore control for
or dividends) will then be of even more avail to minority shareholders. The substitution effect between bonds and dividends is thus likely to be stronger.
Hypothesis 4B: the negative relation between dividends and abnormal announcement returns is stronger when concentrated ownership is high.
A bond IPO might also be motivated by insiders’ desire to attract capital without losing control. Stulz (1988) argues that insiders may increase leverage only in order to have more voting power for a given investment in their firm. At higher levels of voting rights insiders may become entrenched, and their incentives to maximize shareholder value might give way to incentives to expropriate minority shareholders. Accordingly, Stulz (1988) predicts a curvilinear relationship between concentrated ownership and firm value, which has been confirmed by, among others, Morck et al. (1988) and McConnell and Servaes (1990). Bond IPOs motivated by keeping a lock on control are likely to result in negative wealth effects. Moreover, the control lock motive seems most relevant at threshold levels of concentrated ownership, at which insiders have just enough shares to remain entrenched, rather than at very high or very low levels. We therefore expect a curvilinear relationship between abnormal returns and concentrated ownership, which is initially negative and later becomes positive.
Hypothesis 5A: For low levels of concentrated ownership, the relation between concentrated ownership and abnormal returns to bond IPO announcements is negative. Hypothesis 5B: For high levels of concentrated ownership, the relation between concentrated ownership and abnormal returns to bond IPO announcements is positive. Before testing these hypotheses, we will first outline our sample in Section 3.
2.3 Sample and data description
2.3.1 Sample formation
As far as we know, there is no official database of initial public bond offers around the world. We therefore have to construct the database, going through a rigorous process of deleting issues that are not bona fide bond IPOs. Including issues that are not initial public bond offers would bias our data towards finding weaker results, since seasoned bond issues are less likely to be major events to the firm. To exclude seasoned bond issues, we check that no bonds have been issued by the firm or by companies directly related to the issuer, such as its parent, subsidiaries or merger partners. We start out by taking all corporate debt issues from the SDC new issues database, amounting to 145,940 issues for the 1995-2003 period. We then list the first issue for each firm in that period, which results in 15,623 issues. Subsequently, we delete the 4,208 firms that have issues in SDC before 19954 under exactly the same name. The remaining set of 11,415 issuers
4 For domestic European issues, SDC has coverage back to 1991, but coverage goes back further for
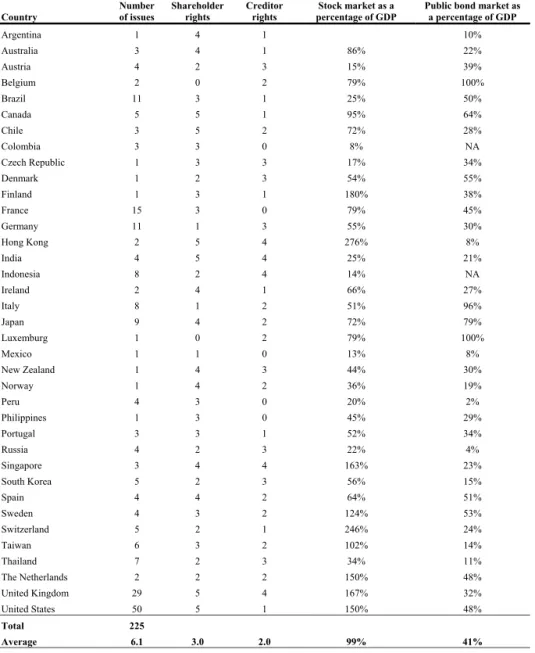
still includes double counts, due to the same firm issuing under slightly differing names (for example, Abbey National Funding PLC, Abbey National Funding Jersey, Abbey National PLC, etc.). We first delete the double counts within our list of issuers, which reduces the number of potential bond IPOs by 45%. Then we check manually whether the remaining firms issued in earlier years under slightly different names. 29% of these issues now drops out. Our next step is to check DataStream for stock listing at the time of the issue (essential for the event study). Many state-owned firms and subsidiaries now drop out. We also exclude private bonds5. At both these stages about half of the then remaining sample drops out. We proceed by checking Bloomberg, Factiva, and LexisNexis for announcement dates, for simultaneous other news, and for the possibility that the issue is not a bona fide bond IPO. We therefore track name changes, takeovers, issues by subsidiaries, and earlier issues not covered in SDC. In the process, we delete 78% of the remaining issues and we are left with a sample of 236 bond IPOs. For these issues, Worldscope and Thomson One are consulted for financial statement data. However, for 11 issues, we cannot find sufficient data. This results in a final sample of 225 bond IPOs, from 37 countries. Table 1 shows the number of issues per country, along with country data on investor protection and the size of public bond and stock markets. Countries with the largest number of issues are the G-7 countries along with major developing economies such as Brazil and Indonesia. The shareholder rights and creditor rights indices are from LaPorta et al. (1998). They will be used later on in this paper as proxies for investor protection. The distribution of issues over the years is relatively even, with the smallest number of issues in the first and final years (16 in 1995, 17 in 2003) and the highest number in the middle of the sample period (33 in 1999). This is consistent with the overall level of corporate bond issues over that period.
5 We exclude private issues because the distinction between private bonds and other types of private debt
Table 1. Country level descriptives
Country Number of issues Shareholder rights Creditor rights percentage of GDP Stock market as a Public bond market as a percentage of GDP
Argentina 1 4 1 10% Australia 3 4 1 86% 22% Austria 4 2 3 15% 39% Belgium 2 0 2 79% 100% Brazil 11 3 1 25% 50% Canada 5 5 1 95% 64% Chile 3 5 2 72% 28% Colombia 3 3 0 8% NA Czech Republic 1 3 3 17% 34% Denmark 1 2 3 54% 55% Finland 1 3 1 180% 38% France 15 3 0 79% 45% Germany 11 1 3 55% 30% Hong Kong 2 5 4 276% 8% India 4 5 4 25% 21% Indonesia 8 2 4 14% NA Ireland 2 4 1 66% 27% Italy 8 1 2 51% 96% Japan 9 4 2 72% 79% Luxemburg 1 0 2 79% 100% Mexico 1 1 0 13% 8% New Zealand 1 4 3 44% 30% Norway 1 4 2 36% 19% Peru 4 3 0 20% 2% Philippines 1 3 0 45% 29% Portugal 3 3 1 52% 34% Russia 4 2 3 22% 4% Singapore 3 4 4 163% 23% South Korea 5 2 3 56% 15% Spain 4 4 2 64% 51% Sweden 4 3 2 124% 53% Switzerland 5 2 1 246% 24% Taiwan 6 3 2 102% 14% Thailand 7 2 3 34% 11% The Netherlands 2 2 2 150% 48% United Kingdom 29 5 4 167% 32% United States 50 5 1 150% 48% Total 225 Average 6.1 3.0 2.0 99% 41%
Sample period is from 1995 to 2003. Number of issues is the number of bond IPOs in our sample. Shareholder rights and creditor
rights are from LaPorta et al. (1998), except the data for Russia and Czech Republic, which are from Pistor et al. (2000). Stock and
Table 2 shows firm and issue characteristics for the 225 bond IPOs in our sample.
Table 2. Firm and issue characteristics
Panel A: Firm characteristics
Variable Mean Median Minimum Maximum
Standard Deviation Number of observations FCF 0.16 0.14 -2.85 1.38 0.29 179 Dividend payout 0.33 0.29 0.00 1.00 0.32 225 Concentrated ownership 0.36 0.34 0.00 0.94 0.26 192 Sales 1512 527 0 21031 2515 225 Total Assets 2236 920 20 34022 3646 225 Debt-to-assets 0.30 0.25 0.00 2.06 0.25 225
Years since equity IPO 10.6 6.7 0.6 38.4 10.0 225
Market-to-book 1.93 1.49 -38.01 14.67 3.65 225
Panel B: Issue characteristics
Variable Mean Median Minimum Maximum
Standard Deviation Number of observations Maturity 8.08 6.91 1.00 50.00 7.17 225 Principal 232.7 143.5 0.2 3200.0 350.7 225
Relative issue size 0.222 0.137 0.002 2.44 0.300 225
Rated issues 0.46 0 0 1 0.500 225
Domestic issues 0.88 1 0 1 0.326 225
Sample period is from 1995 to 2003. Free cash flow is the average of the ratio of undistributed free cash flow and market value, for the three years before the bond IPO. Undistributed free cash flow equals operating income before depreciation minus taxes, interest expenses, preferred dividends and common dividends. Dividend payout is the ratio of dividends and net income, in the year before the bond IPO, and truncated at 1. Concentrated ownership is the ratio of closely held shares and total shares outstanding, in the year before the bond IPO. Sales and Total assets are in millions of US$ in the year preceding the bond IPO. Debt-to-assets is the ratio of the book value of debt and total assets, both in the year preceding the bond IPO. Years since equity IPO is the time in years between the equity IPO and the bond IPO of a firm. Market-to-book is the ratio of the market value of equity and the book value of equity, both in the year preceding the bond IPO. Maturity is time to maturity in years. Principal is in millions of US$. Relative issue size is the ratio of principal and pre-issue? total assets. Rated issues is a dummy variable that equals 1 if the issue is rated by one of the major US rating agencies (Fitch, Moody’s, and S&P’s), and 0 otherwise. Domestic issues is a dummy variable that equals 1 if the issue is issued in the home market and 0 otherwise.
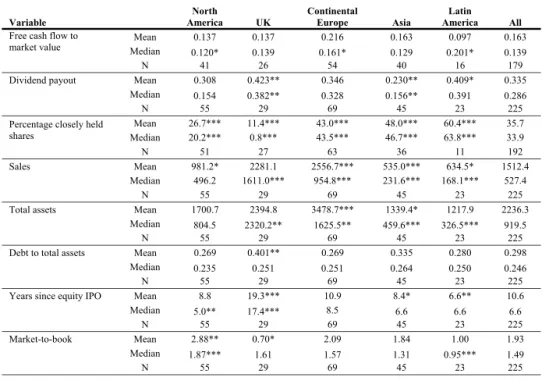
The same variables are split by region in Table 3. We show the UK and Continental Europe separately, partly because of the large number of UK issues, and partly because the UK has much stronger shareholder rights than Continental Europe. As Table 3 shows, the UK and Continental Europe also differ in their issue and firm characteristics.
Table 3. Firm and issue characteristics per region
Panel A. Firm characteristics by region
Variable America North UK Continental Europe Asia America Latin All
Mean 0.137 0.137 0.216 0.163 0.097 0.163
Free cash flow to
market value Median 0.120* 0.139 0.161* 0.129 0.201* 0.139
N 41 26 54 40 16 179
Dividend payout Mean 0.308 0.423** 0.346 0.230** 0.409* 0.335
Median 0.154 0.382** 0.328 0.156** 0.391 0.286
N 55 29 69 45 23 225
Mean 26.7*** 11.4*** 43.0*** 48.0*** 60.4*** 35.7
Percentage closely held
shares Median 20.2*** 0.8*** 43.5*** 46.7*** 63.8*** 33.9
N 51 27 63 36 11 192
Sales Mean 981.2* 2281.1 2556.7*** 535.0*** 634.5* 1512.4
Median 496.2 1611.0*** 954.8*** 231.6*** 168.1*** 527.4
N 55 29 69 45 23 225
Total assets Mean 1700.7 2394.8 3478.7*** 1339.4* 1217.9 2236.3
Median 804.5 2320.2** 1625.5** 459.6*** 326.5*** 919.5
N 55 29 69 45 23 225
Debt to total assets Mean 0.269 0.401** 0.269 0.335 0.280 0.298
Median 0.235 0.251 0.251 0.264 0.250 0.246
N 55 29 69 45 23 225
Years since equity IPO Mean 8.8 19.3*** 10.9 8.4* 6.6** 10.6
Median 5.0** 17.4*** 8.5 6.6 6.6 6.6
N 55 29 69 45 23 225
Market-to-book Mean 2.88** 0.70* 2.09 1.84 1.00 1.93
Median 1.87*** 1.61 1.57 1.31 0.95*** 1.49
N 55 29 69 45 23 225
Panel B. Issue characteristics by region
Variable America North UK Continental Europe Asia America Latin All
Maturity Mean 9.1 15.0*** 6.4*** 4.5*** 8.9 8.1 Median 10.0*** 10.1*** 5.1** 5.0*** 6.0 6.9 N 55 29 69 45 23 225 Principal Mean 290.9 425.1*** 231.5 114.3** 91.1** 232.7 Median 150.0*** 323.8*** 158.6 52.6*** 36.6*** 143.5 N 55 29 69 45 23 225
Principal to total assets Mean 0.345*** 0.235 0.173* 0.198 0.127 0.222
Median 0.248*** 0.151 0.103*** 0.097 0.123* 0.137
N 55 29 69 45 23 225
Rated issues Mean 0.909*** 0.690*** 0.391 0.000*** 0.174*** 0.462
N 55 29 69 45 23 225
Domestic issues Mean 0.927 0.828 0.855 0.911 0.870 0.880
N 55 29 69 45 23 225
Sample period is from 1995 to 2003. Free cash flow is the average of the ratio of undistributed free cash flow and market value, for the three years before the bond IPO. Undistributed free cash flow equals operating income before depreciation minus taxes, interest expenses, preferred dividends and common dividends. Dividend payout is the ratio of dividends and net income, in the year before the bond IPO, and truncated at 1. Concentrated ownership is the ratio of closely held shares and total shares outstanding, in the year before the bond IPO. Sales and Total assets are in millions of US$ in the year preceding the bond IPO. Debt-to-assets is the ratio of the book value of debt and total assets, both in the year preceding the bond IPO. Years since equity IPO is the time in years between the equity IPO and the bond IPO of a firm. Market-to-book is the ratio of the market value of equity and the book value of equity, both in the year preceding the bond IPO. Maturity is time to maturity in years. Principal is in millions of US$. Relative issue size is the ratio of principal and total assets. Rated issues is a dummy variable that equals 1 if the issue is rated by one of the major US rating agencies
(Fitch, Moody’s, and S&P’s), and 0 otherwise. Domestic issues is a dummy variable that equals 1 if the issue is issued in the home market and 0 otherwise. Statistical differences from the rest of the sample are denoted by *(10% level), ** (5%), and ***(1%).
We will first discuss firm characteristics and then issue descriptives.
2.3.2 Firm characteristics
Lehn and Poulsen (1989) define free cash flow as the ratio of undistributed free cash flow and market value, where undistributed free cash flow equals operating income before depreciation minus taxes, interest expenses, preferred dividends and common dividends. As our measure of free cash flow, we take the average value of the Lehn and Poulsen ratio for the three years before the bond IPO, because this average is less likely to be imbalanced by outliers. Firm characteristics split by region are given in Panel A of Table 3. Free cash flow is higher in Europe and Latin America (where market-to-book ratios are low) and lower in North-America (where market-to-book-ratios are high). European and UK firms are larger than the others. UK firms differ in that they are older, more levered, pay higher dividends, and have less growth options than the rest of the sample. They thus closely resemble the typical low growth firm as described by Jensen (1986). Apparently, UK dividends are on average high enough to keep median free cash flow (0.139) at the median of the entire sample (also 0.139).
Dividend payout is the ratio of common cash dividends and net income, in the year before the bond IPO (see also Johnson, 1995, and LaPorta et al., 2000). We truncate dividend payout at unity 1 to avoid extreme outliers in cases where net income is close to zero. The median of 0.29 is very close to the 0.30 that LaPorta et al. (2000) find for a set of over 4,000 firms from roughly the same countries as our sample. Dividends are highest in the UK and lowest in Asia, which largely matches the results of LaPorta et al. (2000), who find that dividends are higher in countries with better investor protection. An exception is the high level of dividends in Latin America, which might be due to the mandatory dividend rules in Brazil, Chile and Colombia. The dividend picture is also consistent with Faccio et al. (2001) who find that firms in Europe pay higher dividends than in Asia, dampening insider expropriation in Europe and not in Asia. Dividends are relatively low for North-American firms. A potential explanation is that they have more growth options and thus need more cash to finance their investments. Likewise, Fama and French (2001) find that the proportion of US firms paying cash dividends has fallen from 66.5% in 1978 to 20.8% in 1999. They explain this shift by the changing nature of US listed firms, which increasingly tilts toward small firms with low profitability and strong growth opportunities, typical of firms that do not pay dividends.
Concentrated ownership is measured as the ratio of shares held by the largest five shareholders and total shares outstanding, in the year before the bond IPO. This measure obviously has its limitations. For example, the measure does not account for the possible presence of pyramid structures or differential voting rights, and it is not necessarily so that the largest five are the only significant shareholders. We might therefore underestimate the actual level of ownership concentration. In addition, it is implicitly assumed that these large shareholders are in coalition with each other, which might not be the case. In this respect we are likely to overestimate the actual level of ownership
concentration. On balance, it is a crude measure, which makes it less likely to be found significant in our regressions, but it is the best measure we can consistently calculate. Previous research has shown that cash flow ownership is a good indicator of ownership concentration in countries with strong shareholder protection (e.g., LaPorta et al., 1999). In countries with weak ownership concentration the evidence is mixed: cash flow ownership does underestimate ownership concentration in many Asian countries (Claessens et al., 2000) but only in some European countries (Faccio and Lang, 2002). The values we find for ownership concentration in our sample range from completely dispersed, through intermediate forms of ownership concentration, to complete control. Ownership concentration is high in Asia, Continental Europe and Latin America, while it is much more dispersed in America. UK firms are even more dispersed than North-American firms, which can be explained from the difference in size: smaller firms, such as those in North-America, are less likely to be dispersed. Overall, these regional differences in ownership are very similar to those reported in LaPorta et al. (1999), who measure the percentage of widely held companies in a sample of 27 countries. Firms are more likely to have concentrated ownership when private benefits are high and shareholder protection is weak.
Firms differ greatly in size as measured by sales and total assets (as measured in millions of US$ in the year before the bond IPO)6. As said, European firms are typically the largest. Outside the UK, most firms have little debt in their financial structure before the bond IPO, which often follows within less than 10 years after the equity IPO. The dispersion in market-to-book ratios is high, with the standard deviation at twice the mean market-to-book.
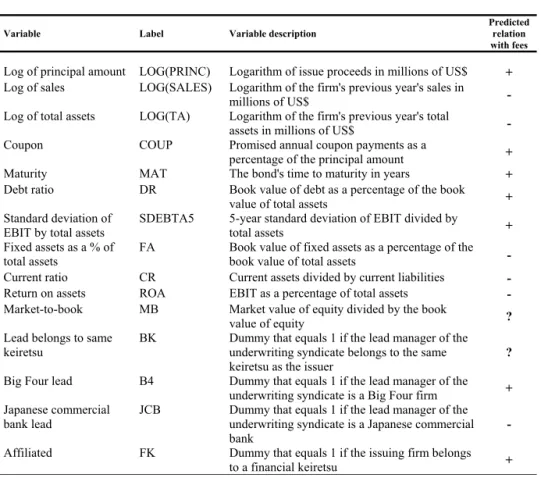
Graph 1 shows the evolution of debt levels for the 207 sample firms for which we had non-zero debt from the third book year before the bond IPO to the third book year since the bond IPO.
T-1 denotes the last annual report before the bond IPO, T refers to the first annual report since the bond IPO. T-3 is the reference year for which the debt level is set at 100. As Graph 1 shows, debt levels start to increase in the last year before the bond IPO. Not surprisingly, they increase most in the year of the bond IPO, and then rise further in subsequent years. This pattern continues to apply when the sample is split by shareholder rights (not reported in graphs). The only difference between both groups is that firms from countries with the full score on shareholder rights experience steeper increases in debt levels in subsequent years.
6 Sales vary from zero for Norwegian drilling firm Ocean Rig to US$ 21 billion for German travel giant
TUI. Total assets range from US$ 20 million for Korean Cybertek Holdings to US$ 34 billion for Russian Sberbank.
Graph 1. Evolution of debt levels around the bond IPO 80 90 100 110 120 130 140 150 160 T-3 T-2 T-1 T T+1 T+2 T+3 average debt median debt
The graph shows mean and median levels of total debt in the 207 sample firms with sufficient data points and non-zero debt levels before the bond IPO. The third book year before the bond IPO (T-3) is taken as a reference and set at 100. The measurement period runs until the third book year since the bond IPO (T+3). T-1 denotes the beginning of the year of the bond IPO (the end of the preceding year), T is the end of the year of the bond IPO.
2.3.3 Issue characteristics
Issue characteristics are given in Panel B of Table 2. Mean and median maturities are below 10 years and range from 1 to 50 years. Only four firms issue 50 year bonds, and three of them are from the UK. The smallest principal is for the Brazilian firm Tectoy, which issued a US$ 200,000 bond. But in general, issues are much larger than that, with the median principal at US$ 143.5 million and the mean principal at US$ 232.7 million. The largest issue is the US$ 3.2 billion megadeal by US giants Progress Energy (total assets at US$ 19.9 billion). In terms of relative issue size (16%), that deal is not even extraordinary. The relative size of the issues (measured as principal by total assets) is large in general, with sample firms issuing bonds of on average 22% of total assets7. When comparing debt levels in the year before and after the bond IPO, the amount of debt on average increases by 14%, while debt ratios increase by 6 percentage points, which implies that assets increase as well.
Less than half of all issues are rated by one of the major US rating agencies (Fitch, Moody’s, S&P). The vast majority of issues are domestic, in the sense that they are sold and listed in their own currency and in their own country, or region in the case of the Eurozone8. The 27 firms that issue internationally (in the off-shore Eurobond9 market or
7 Outliers are the issues by Tectoy (0.2%) and Ocean Rig (244%).
8 Galati and Tsataronis (2001) find that the Euro introduction resulted in lower barriers to cross-border
financial transactions. Moreover, banks and investors in the Eurozone fixed income markets have become more focused on the characteristics of individual borrowers rather than the nationality of the issue.
in a foreign market) are mainly from countries that have small domestic bond markets, such as European countries that do not belong to the Eurozone.
As stated in the previous section, we extensively searched for bond IPO announcements. In two thirds of those issue announcements, no mention is made of the purpose of the issue. Where motives are given, they range from very general, such as refinancing10 (i.e., replacing existing private debt; reported by 22% of the firms), expansion (16%), or “general corporate purposes”, to very specific. Often, a combination of these motives is found. For example, Indonesian firm Selamat Sempurna stated it would use 50% of the issue proceeds to buy machinery, 35% to repay debts and 15% as working capital (Dow Jones International News, 29 May 2000). Some also hint to more specific purposes, such as Brazilian firm Duratex SA: “We want to keep a bit of cash on the side, which can be a good idea in Brazil.” (Bloomberg, 8 November 2002). The issue by UK cable operator TeleWest involved low initial interest payments, allowing the firm some years to invest heavily in expanding its network. The company said the deal “was a real milestone” (Financial Times, 12 October 1995).
Issue characteristics split by region are given in Panel B of Table 3. UK firms have much longer maturities than the overall sample average. Compared to North-American firms, this can be explained by the fact that they are much larger and have lower growth rates (lower market-to-book). This is consistent with Stohs and Mauer’s (1996) findings that long-term debt is issued by larger, less risky firms in low-growth industries. The longer maturities of both UK and North-American firms, given their size and growth rates, in comparison to the rest of the sample, are also as expected. Demirgüç-Kunt and Maksimovic (1999) find that in countries with active stock markets, large firms have more long-term debt. Principal amounts are smallest in Asia and Latin America, and largest in the UK, which is hardly surprising given the size of the firms from these respective regions. Latin American issues are very small, also relative to firm size. Relative issue size is by far the largest for American firms, which might be due to the well-developed US corporate bond market, where junk issues are not as uncommon as they are elsewhere (e.g., De Bondt and Marqués, 2004). The extent to which issues are rated varies greatly across regions. Whereas the vast majority of North-American and UK issues are rated by one of the three major (US) rating agencies, this is much less the case in Continental Europe (39%) and Latin America (17%). Strikingly, none of the Asian issues is rated by one of the major US agencies. Asia counts many local rating agencies that might have rated these issues, but we do not have systematic information on that. Finally, as to domestic issues, there are hardly any differences between regions. As pointed out before, the decision to issue abroad might be motivated by a small domestic bond market, which might be more country specific than region specific.
9 Eurobonds are not clearly distinguished in the SDC New Issues Database. We therefore checked
currencies, issuer nation and place of listing (Luxemburg and London for Eurobonds).
10 If the replaced debt is bank debt, discipline might be reduced. We therefore control for the refinancing
2.4 Results
2.4.1 Event study results and univariate analysis
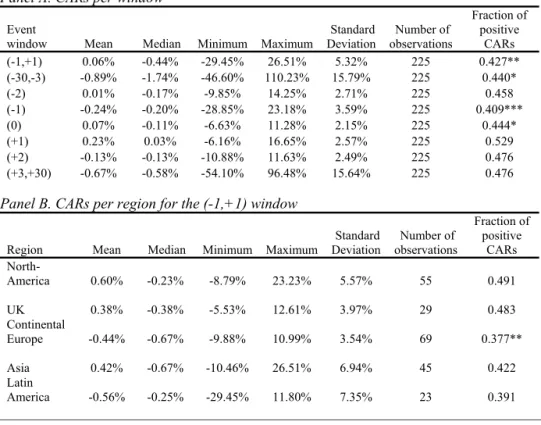
Abnormal returns to bond IPO announcements are calculated using standard event study methodology. To estimate the market model parameters, we take a clean period from day -150 to day -50. Day 0 is the first announcement date. The market returns are DataStream market total return indices per country. Table 4 shows abnormal returns for the whole sample of 225 observations. Panel A shows descriptives for several windows. None of these differs significantly from zero. However, for most windows, there are significantly more negative than positive abnormal returns.
Table 4. Abnormal returns to bond IPO announcements
Panel A. CARs per window
Event
window Mean Median Minimum Maximum
Standard Deviation Number of observations Fraction of positive CARs (-1,+1) 0.06% -0.44% -29.45% 26.51% 5.32% 225 0.427** (-30,-3) -0.89% -1.74% -46.60% 110.23% 15.79% 225 0.440* (-2) 0.01% -0.17% -9.85% 14.25% 2.71% 225 0.458 (-1) -0.24% -0.20% -28.85% 23.18% 3.59% 225 0.409*** (0) 0.07% -0.11% -6.63% 11.28% 2.15% 225 0.444* (+1) 0.23% 0.03% -6.16% 16.65% 2.57% 225 0.529 (+2) -0.13% -0.13% -10.88% 11.63% 2.49% 225 0.476 (+3,+30) -0.67% -0.58% -54.10% 96.48% 15.64% 225 0.476
Panel B. CARs per region for the (-1,+1) window
Region Mean Median Minimum Maximum Deviation Standard observations Number of
Fraction of positive CARs North-America 0.60% -0.23% -8.79% 23.23% 5.57% 55 0.491 UK 0.38% -0.38% -5.53% 12.61% 3.97% 29 0.483 Continental Europe -0.44% -0.67% -9.88% 10.99% 3.54% 69 0.377** Asia 0.42% -0.67% -10.46% 26.51% 6.94% 45 0.422 Latin America -0.56% -0.25% -29.45% 11.80% 7.35% 23 0.391