Checking account information and credit risk of bank customers
LARS NORDEN and MARTIN WEBER*
First version: March 14, 2007; this version: October 17, 2007
ABSTRACT
We investigate if information from checking accounts may help banks to monitor the credit risk of their customers. Analyzing a unique data set with more than 3 million account-month observations from the period 2002-2006, we find that the credit line usage, the cumulative number of limit violations, the account amplitude and credit payments exhibit an abnormal pattern approximately 12 months before default events. Differentiating by customer type reveals that checking account information is particularly helpful for monitoring small businesses and individuals. We condition the checking account behavior on customers’ internal credit ratings and control for credit line changes as well as bank relationship characteristics like the number of accounts, distance and duration.
JEL classification: G20, G21, G30
Key words: Bank lending; Checking accounts; Credit lines; Credit ratings; Bankruptcy
*
Norden is at the Department of Banking and Finance, University of Mannheim, and currently visiting the Finance Department, Kelley School of Business, Indiana University, Email: lnorden@indiana.edu. Weber is at the Department of Banking and Finance, University of Mannheim, and Centre for Economic Policy Research (CEPR), Email: weber@bank.BWL.uni-mannheim.de. We wish to thank Utpal Bhattacharya, Arnoud W.A. Boot, Hans Degryse, Daniel Foos, Jens Grunert, Florian Heider, Kevin Keasey, Steven Ongena, Andreas Pfingsten, Gregory F. Udell, as well as participants at the Conference “Small Business Banking and Finance: A global perspective” in Cagliari, the European Summer Symposium in Financial Markets 2007 in Gerzensee, the Finance Brown Bag Seminar at Kelley School of Business, and the Research Seminar at the University of Mannheim for useful comments and suggestions. In addition, we are grateful to the management and three anonymous employees of the bank which provided us with the data. Financial support from the German Research Foundation (Deutsche Forschungsgemeinschaft) is gratefully acknowledged.
Close relationships between banks and their customers can reduce the degree of asymmetric information in lending which may be beneficial for both. Boot (2000) summarizes the state of the relevant literature as follows: “… little is known about how banks obtain information, what type of information they acquire, and how they use this information.” The literature survey by Elyasiani and Goldberg (2004) confirms that the previous quote still holds for recent years. Accordingly, there are at least three fundamental questions which have not been answered sufficiently yet. First, what are the sources of (credit-relevant) information in banking? On the one side, banks follow a standardized credit rating process to screen prospects and to monitor existing borrowers (see Udell (1989)). On the other side, banks have begun to consider data from checking accounts and payment transactions systematically to get a continuous flow of information. Second, what type of information do banks rely on? Information may be classified as private vs. public and as hard vs. soft (see Berger and Udell (2002), Petersen (2004), Grunert, Norden, and Weber (2005)). Financial statements and payment information are usually considered as hard information while examples for soft information are the management quality, the market position and information from social interactions (see Agarwal and Hauswald (2007)). Third, for which purposes do banks use certain information? Examples are the loan approval decision, credit pricing, credit monitoring, loan loss provisioning, capital requirements, and credit risk transfer. This paper relates to all of these questions.
Checking accounts may represent one potentially useful source of information which can be complementary to the information included in internal rating systems. The advantage of checking account information is that it represents private, continuous, timely, almost costless (given an existing information technology system), and hard information. Note that these characteristics meet the definition of relationship lending in the sense that the information is proprietary and based on multiple interactions (see Boot (2000)). A further advantage is that checking accounts do not only reveal information about debit payments (like credit card
accounts) but also on credit payments which represent an important determinant of a borrower’s debt capacity. Moreover, unlike accounting numbers payments are not or less likely to be influenced by rules and policies. However, potential problems may arise due to dilution across accounts at the same bank and dilution across different banks. Accordingly, main or housebanks can benefit mostly from this source of information.
In this paper we analyze whether information from checking accounts may help banks to monitor the credit risk of their customers. Early warning indications that are observed significantly before internal credit rating changes are of high importance for banks (see Nakamura (1993)). Based on this information loan officers can either take restrictive actions or make an attempt to help the borrower through a period of financial distress. For example, banks may want to stop the customer relationship, to reduce or to cancel credit lines, to require additional collateral or to increase the existing credit line. In this context, we investigate by means of event study methodology and probit regressions models if and how early checking account variables indicate an abnormal pattern before default events. We also compare the usefulness of checking account information by customer and default type. Furthermore, we condition on the initial and the pre-default internal credit ratings and control for bank relationship characteristics like the number of accounts, distance and duration.
Our study contributes in several ways. This is the first large-sample analysis based on a unique data set with more than 3 million account-month observations provided by German bank, covering the years 2002-2006. Moreover, we compare the value of checking account information for different types of customers like companies, small business, and individuals as well as size categories (see Mester, Nakamura, and Renault (2007) for a related study analyzing checking account information from a Canadian bank). To the best of our knowledge, we are not aware of any study that examines the value of checking account information for individual bank customers. In addition, Jiménez, Lopez, and Saurina (2007) focus on credit line usage while we also consider other important variables, for example the
amplitude of monthly account balances as well as monthly debit and credit payments. Furthermore, we are able to match the checking account information with customer-specific variables like internal credit ratings, number of accounts, distance and duration which allows to control for characteristics of the bank-firm relationship. Our data is particularly interesting because in Germany, the prototype of a bank-based financial system and the world’s third largest banking sector behind the U.S. and Japan (as of year-end 2006), checking accounts are in the center of the bank-customer relationship, i.e. all incoming and outgoing payments are routed through this account. Note that credit cards do not play a significant role for the payments of firms and are, in contrast to the U.S., a far less important means of payment for individuals. Most of the corporate and individual borrowers rely on financing from universal banks and the prevailing financing mode of firms is relationship lending (see, for example, Elsas and Krahnen (1998), Elsas (2005)), as opposed to arm’s-length lending in the U.S. and U.K.
The remainder of the paper is organized as follows. Section I reviews the related literature and Section II describes the data. In Section III we present the methodology and report main results from the empirical analysis. Section IV provides robustness tests and Section V concludes.
I. Related literature
This study builds upon three strands of literature. First, we briefly review empirical studies which include proxy variables to measure the closeness of bank relationships. Second, we focus on the relatively scarce literature that investigates the role of checking accounts as a source of information for banks. Third, we summarize insights about the importance of checking account data for banks’ internal rating systems from the applied credit risk and the banking regulation literature.
The first category of studies is based on the idea that banks can gather information if the borrower used or is still using other, i.e. non-credit related, financial services. In other words, there may be an informational spillover from other financial services to the lending business. Examples for these other financial services are checking accounts, payment services, savings and money market accounts, brokerage, and underwriting activities (see Black (1975), Fama (1985), Vale (1993), Nakamura (1993), Petersen and Rajan (1994), Blackwell and Winters (1997), Cole (1998), Chakravarty and Scott (1999), Petersen and Rajan (2002), Cole, Goldberg, and White (2004), Elsas (2005), Berger, Miller, Petersen, Rajan, and Stein (2005), Bharath, Dahiya, Saunders, and Srinivasan (2007)). These analyses explicitly hint at the specific source of a potential informational advantage of banks and include dummy variable in empirical models to measure its impact. However, existing studies provide mixed evidence on the question whether checking accounts are useful for banks to gather information. In addition, more recent research indicates that borrowers having checking accounts at their lenders exhibit a smaller distance to their bank and communicate in a more personal way with their bankers (see Petersen and Rajan (2002)). Moreover, firms with checking accounts at their lenders benefit from higher credit availability if the latter are small banks (see Cole, Goldberg, and White (2004)). Elsas (2005) shows that payments and informational financial services have a positive impact on the probability of being a housebank. Finally, Berger, Miller, Petersen, Rajan, and Stein (2005) find a negative impact of checking account dummies on bank size, the physical distance between the bank and firm, the probability of impersonal communication, and a significantly positive impact on the probability of having an exclusive lender and on the duration of the bank relationship. As mentioned above, these studies are restricted in the sense that they include dummy variables that indicate the existence of checking accounts without explaining how banks can get an informational advantage. Our analysis looks inside the checking accounts to detect a link between the payment behavior of bank customers and their credit risk.
The second strand of literature goes one step further in identifying the mechanism which may provide banks with useful credit-relevant information. Black (1975), stating that “if the individual routes most of his receipts and payments through his loan account, they can serve as a continuing source of credit information“, and Fama (1985) have inspired Nakamura (1993) to propose the checking account hypothesis. The latter states that checking accounts may be useful for banks in monitoring small borrowers. Concurrently, Vale (1993) proposes a theoretical model to study the complementary role of deposits as a source of funding and private information in lending. Solving this model leads to two empirical implications. First, customers that have been depositors receive better loan terms than others. Second, exclusive customers are treated more favorably because they do not hide information from their banks. Mostly related to our work is the only direct empirical test of the checking account hypothesis by Mester, Nakamura, and Renault (2007) which analyzes 100 SME borrowers, hereof 50 in financial distress, from a Canadian bank during 1988-1992. Their sample consists annual data from credit files (loan specifics, ratings, dates of reviews and completion of reviews, financial statements, information on the exclusivity of the relationship) and monthly data (value that the bank assigns to receivables and inventories on the basis of information provided by the borrower, end-of-month balance in the borrower’s checking account as well as minimum, average, and maximum monthly balances). The study has the following three key results. First, monthly changes in accounts receivable can be retraced in checking accounts if the borrower has an exclusive bank relationship. Second, borrowings that exceed inventory and accounts receivables can predict rating downgrades and loan write downs. Third, the analyzed bank intensifies its monitoring as the credit quality decreases, i.e. loan reviews become lengthier and more frequent. The authors conclude that information from checking accounts is indeed useful for banks in monitoring as proposed by Nakamura (1993). A complementary study by Sufi (2007) takes a corporate finance perspective, analyzing credit lines by means of 10-K SEC filings from 4,604 U.S. firms during the period 1996-2003. The main finding is
that firms which have access to credit lines from banks have to maintain a high cash flow level to be able to comply with covenants. In contrast, firms with low cash flows or covenant violations due to declines in cash flows face a more difficult access to credit lines. Overall, these results suggest that the lack of access to a credit line is a robust measure to describe financial constraints of firms.
The third strand of literature investigates, from an applied risk management or regulatory perspective, whether checking account variables (e.g. account balances, turnover measures for debits and credits, days of unauthorized overdrafts) can serve as an early warning indicator, whether it can help to improve banks‘ internal rating systems, and how banks can estimate exposure at default (EAD) and credit conversion factors (see e.g. Eisfeld (1935), Apilado, Warner, and Dauten (1974), von Stein (1983), Hackl and Schmoll (1990), Schlüter (2005), Jiménez, Lopez, and Saurina (2007)). Note that these studies mainly examine methodological issues and statistical measurement techniques while the first and second strand of literature focus on the economic importance of checking account information for banks. Apilado, Warner, and Dauten (1974) show that the possession of a checking account is an important indicator of the creditworthiness of individual borrowers. The work of von Stein (1983) builds on Eisfeld (1935) and provides first quantitative evidence that checking account data allows to discriminate between defaulting and non-defaulting firms already two years before default. Subsequently, Hackl and Schmoll (1990) are able to confirm earlier findings. Moreover, Jiménez, Lopez, and Saurina (2007) analyze data from the Spanish Credit Register during the period 1984-2005 to provide evidence on corporate credit line utilization and its implications for exposure at default (EAD) estimations. They can show that the risk profile of the borrower, characteristics of the bank, and the business cycle have a significant impact on credit line utilization. Consistent with Mester, Nakamura, and Renault (2007) they find that firms which subsequently default exhibit a more intensive use of credit line than other firms.
II. Description of the data
This study is based on a unique data set with monthly observations from checking accounts provided by a German universal bank. The bank is among the largest 5% by total assets in the category of comparable banks, as defined by the Deutsche Bundesbank. The sample period covers five calendar years, starting from January 2002 until December 2006.
Initially, we start with a data set including more than 3.7 millions of account-month observations and apply the following selection and adjustment rules. First, we exclude all customers that are financial institutions, public entities (state or municipality-owned), and certain legal advisers (lawyers, solicitors, notaries) because we want to analyze checking accounts of commercial and individual borrowers. Legal professions are excluded because notaries typically hold a large number of special purpose transaction accounts to enable their clients to meet obligations from sales contracts (for example real-estate transactions). Second, we consider all customers borrowing from the bank during the period 2002-2006 to ensure that our data set is free of a survivorship bias that may arise from bank switching and default events.1 Third, we differentiate customers by (i) legal form (categories: GROUP = 1 for companies like corporations and partnerships, GROUP = 2 for small businesses and liberal professions, and GROUP = 3 for individuals) and (ii) size measured by the mean credit payments per month (categories: SIZE = 1 for large customers (>95% quantile: 12,835 EUR), SIZE = 2 for mid-sized customers (75% to 95% quantile: between 2,979 EUR and 12,835 EUR), and SIZE = 3 for small customers (0% to 75% quantile: between 0 EUR and 2,979 EUR). On the one hand, differentiating by legal form has the clear advantage that this classification is not based on data from checking accounts, i.e. it can be seen as exogenous relative to the payment behavior. On the other hand, differentiating customers by their mean
1
The data selection is not based on a particular point in time but the entire sample period. The sample includes bank customers who started borrowing before 2002 but which are no longer in the sample in subsequent years because they switched the bank or because they went bankrupt. Moreover, the sample also includes customers who have started borrowing from the bank during 2002-2006. For example, there are 58,790 (51,069) accounts with a time series of at least 36 (48) months. We have data on exactly 60 months for 6,235 accounts.
credit payments may represent a more accurate proxy for size than the legal form because many small firms in Germany are corporations and but there are also some large businesses that are no corporations. However, the size proxy may be biased if a firm has multiple bank relationships and most of the credit payments are not observed. As both arguments are valid, we differentiate by GROUP and SIZE.2 Fourth, if customers change their legal form (for example, an individual starts running small business or a partnership is transformed into a corporation), we assign the legal form that is observed in most of the months to the account and the customer. Finally, we do not have information about a customer’s number of bank relationships. We believe that this is not a problem because it creates a conservative bias in our study, making it more difficult to provide evidence on the usefulness of checking account information for credit risk monitoring. If we assume that some customers have multiple bank relationships and the analysis of data from one bank reveals that checking account information is useful, the corresponding results should be even stronger for a homogeneous sample including only customers with single bank relationships. Moreover, given the fact that most individuals and small businesses in Germany typically have only one or two checking accounts, the dilution effect should not be very strong. Summary statistics are reported in Table I.
Insert Table I here
Panel A describes the structure of our final data set. As can be seen from the rightmost column, it includes 3,271,879 account-month observations from 86,945 accounts (67,215 customers). For comparison, the study of Mester, Nakamura, and Renault (2007) which mostly relates to our paper analyzes data on 100 SME borrowers from a Canadian bank.
2
The variable GROUP (based on the legal form) and SIZE (based on mean credit payments) exhibit a rank correlation of 0.28 (p<0.0001), indicating that both criteria are significantly positively related but not perfectly correlated.
Columns 2-4 in the upper part of Panel A differentiate the composition of the sample by legal form. 3.79% of all account-month observations come from companies, 10.28% from small businesses, and 85.93% from individuals. Given this large share of individuals, it is not surprising that most of the customers (78%) have just one checking account while companies and small businesses are typically among those who have multiple accounts. Note that we will study the robustness of the results with respect to the number of accounts later in more detail. Moreover, an important feature of our data set is that we have a time series of 48-60 months for 77% of all checking accounts, allowing not only cross-sectional but also time-series analysis.
Panel B summarizes the main checking account and bank-relationship variables for the entire sample at the account level. Note that all checking account variables are reported in thousands of Euro. For example, the mean minimum balance per month (LOW) is -0.16 and the corresponding maximum (HIGH) is 4.15. Mean cumulative debits (DEBIT) and credits (CREDIT) run up to 8.04 and 8.22 respectively. The mean balance (MID) is 1.99 and the average credit line (LIMIT) amounts to -8.12. In addition, the absolute account amplitude AMPLI (calculated as HIGH minus LOW) describes the monthly variation at an account and exhibits a mean of 4.32. Furthermore, we calculate the variable USAGE (defined as MID divided by LIMIT, in %) to report the credit line usage. Note that the negative mean of USAGE (-108.47) indicates no credit line usage on average (i.e. a credit balance) while positive values correspond to an actual use of a credit line. The mean duration of the bank-customer relationship DUR is 8.06 years3 and the mean distance between the domicile of a customers and the bank’s head office DIST is 7.21 kilometers.4 The average internal credit
3
Related studies report similar durations, for example 7.9 years (Degryse and Ongena (2005)) and 5.1 years (Ongena and Smith (2001)).
4
The variable DIST reflects the aerial distance between the borrowers and the bank, based on the first three digits of the postal code. Other studies report 8 miles (Agarwal and Hauswald (2007), for relationship borrowers), 9 miles (Petersen and Rajan (2002)), and 4.3 kilometers (Degryse and Ongena (2005)). Our results are not much affected if we compute the distance between the customer and the nearest bank branch because all branches of the bank are relatively close to the bank’s head office which is located in a metropolitan area.
rating RAT is 2.87 (on a 6-grade scale, with 1 being the best grade, grades 5 and 6 included defaulted borrowers) and most of the customers have a rating of 2 or 3. The bank has different internal credit rating systems for firms and individuals and systematically considers the rating for all loan approval decisions, loan pricing and loan loss provisioning (see Machauer and Weber (1998), Treacy and Carey (2000), Grunert, Norden, and Weber (2005) for studies on internal credit rating systems of banks). Internal credit ratings for firms are based on hard facts (analysis of financial statements) and soft facts (market position, management quality, etc.) while ratings for individuals are based on variables like age, marital status, home status, income, etc. Most important, information from checking accounts is not included in the bank’s internal credit rating system and it is not used in any other systematic way. This fact rules out that borrowers strategically adjust their payment behavior to hide information from the bank. In addition, borrowers which are close to financial distress have the strongest incentives to hide information but they have typically the lowest financial flexibility to do so.
Panel C presents the number of different types of credit events. During the sample period, we observe 12,803 changes of the internal credit ratings. Although we know the exact dates, we assign a rating change to the corresponding month since all other variables are measured at a monthly frequency. Differentiating by direction of the rating change leads to 5,515 rating upgrades and 7,288 rating downgrades. Finally, we observe 1,009 default events, i.e. these customers were downgraded to grade 5 (first specific loan loss provision, 90 days past due on any obligation, restructuring, utilization of collateral, attachment proceedings) or grade 6 (bankruptcy filing). This definition of default is common practice at banks and meets the international regulatory requirements (see Basel Committee on Banking Supervision (2006)). The type of default is distributed almost uniformly with 541 downgrades to rating 5 and 468 downgrades to rating 6. Note that defaults to grade 5 are under some control of the bank
management5 whereas defaults to grade 6 (bankruptcy filing) can be seen as exogenous events which may have implications for the usefulness of checking account information.
III. Empirical analysis A. Methodology and univariate results
We consider two ways of measuring whether checking account information is useful for assessing the credit risk of bank customers. First, we apply event study methodology which has been extensively used to analyze anticipation and announcement effects in financial economics. This approach enjoys the advantage that the results can be easily visualized. In addition, we estimate multivariate probit regression models in calendar time to investigate which factors in month t influence the probability of going to default in month t+1.
For the event study, we proceed as follows. First, we identify and mark default events in calendar time. Second, we transform calendar time into event time at a monthly frequency with an event time window of 48 months [event time = -36, -35, …, 0, 1, …, 12]. During the period 2002-2006 we observe 1,009 default events and assign these incidents to event time 0. Third, we calculate various checking account variables of customers which default at event time 0 for each month in the event time window. For comparison purposes, we calculate the same variables at the same month for all customers in our sample. The latter serve as a benchmark in order to identify abnormal patterns of checking account variables of defaulters. This approach has the clear advantage that a bank can ex ante compare each customer with an appropriate benchmark (average of all customers, industry-specific, size-based benchmarks). Note that this methodology is similar to calculating abnormal stock returns (with a stock index return, an average portfolio return or a market model return as a benchmark). Taking non-defaulting customers as a benchmark suffers from the problem that a bank can identify
5
Note that the loan loss provisioning follows strict regulations and the actual specific loan loss provisions made by the bank are checked by the auditors, tax authorities, and federal banking supervisors.
this group only from an ex post perspective, i.e. it does not help banks obtaining ex ante warning indications.6 Subsequently, we report results which are based on the median variables for defaulters and all customers for the entire sample.7
In a first step, we examine the credit line usage and the cumulative number of credit limit violations. We measure credit line usage (in %) by the variable USAGE_LOW = LOW / LIMIT and the variable USAGE = MID / LIMIT. A credit limit violation occurs if the minimum balance in a month falls short of the credit limit (LOW < LIMIT). The cumulative number of credit limit violations CUMVIOL is defined as the sum of all monthly limit violations up to a particular month. Figure 1 displays the findings for the medians of these variables.
Insert Figure 1 here
It turns out from Figure 1a that the median credit line usage of defaulters is very different to those of non-defaulting customers. While USAGE_LOW (USAGE) of defaulters start above 60% (20%) 36 months prior to default, the corresponding values of non-defaulters amount to roughly 0% (-30%). As explained above a negative sign for credit line usage indicate that there is no usage at all, i.e. the account has a credit balance. If we come closer to the default at event time 0, the value of USAGE_LOW (USAGE) for defaulters runs up to almost 100% (80%), indicating a systematic increase of credit line usage. Note that most of the run up of USAGE_LOW occurs during the event time interval [-36, -16]. In addition, USAGE displays a sharp increase nine months prior to default. Most important, during the negative event time the credit line usage USAGE_LOW (USAGE) of all customers remains
6
We also calculated the corresponding checking account variables for (i) all non-defaulters and (ii) all customer (without those that are already in default). The results are almost identical to the reported ones since the impact of the defaulters on the average variables of the entire sample is very small.
7
relatively stable around 0% (-30%). It can be seen that there is no systematic increase or decrease in the benchmark. This finding is consistent with the results for Spanish firms by Jiménez, Lopez, and Saurina (2007) who detect a major increase in credit line usage during the 12 months prior to default. Moreover, from Figure 1b it can be seen that the cumulative number of credit limit violations for defaulters differ considerably from those of all customers. While the latter remains relative flat, the former increases continuously from a median of 5 at event time -36 to a median of 20 at event time 0. Note that the slope of the curve for defaulters becomes considerably steeper around event time -18. This relatively strong result is in line with the findings on Canadian firms from Mester, Nakamura, and Renault (2007). Overall, we conclude that defaulters exhibit a significantly abnormal increase in credit line usage and in the number of limit violations before default.
In a next step, we analyze another potentially useful checking account variable that has not been considered in related studies so far. In order to asses the variation of balances within a month, we calculate the absolute account amplitude AMPLI, defined as AMPLI = HIGH – LOW. This variable takes always positive values regardless of the sign of the minimum LOW and maximum HIGH. Our hypothesis is that customers that go bankrupt exhibit a systematic
decrease in the absolute account amplitude. This may be the case for the following to reasons. First, firms as well as individuals which subsequently default are expected to face a decline in credit payments. In other words, firms get into financial distress mainly if sales decrease (i.e. credits decrease) while debits remain relatively constant. The same reasoning holds for individuals that become unemployed, facing no or a reduced transfer income. Second, given a decrease in credit payments customers become increasingly financially constrained. Consequently, from a certain level debits have to decrease as well in order avoid overdrafts, encumbrance etc. Figure 2 depicts the event study results for the median of AMPLI.
Interestingly, the median amplitude AMPLI of defaulters and all customers are relatively similar and in a range of 1,000 to 2,000 EUR during the event time interval -36 to -6. The fact that AMPLI for defaulters is above the other curve during event time -36 to -30 is due to a relatively small number of observations in the first months.8 More important, from event time -5, we observe that the AMPLI of defaulters drops considerably from 1,000 EUR to less than 200 EUR while the corresponding value for all customers does not change at all. Based on these results, we conclude that the account amplitude provides a warning indication roughly 5 months prior to default.
In addition, we examine not only account balances but also turnover information reflected by the cumulative monthly credit and debit payments (CREDIT, DEBIT). We divide CREDIT and DEBIT respectively by the credit line LIMIT to evaluate the relative evolution of payments at defaulters to those at all customers.9 Note that no other study has analyzed payment variables like CLR and DLR before. Results for the medians of both variables are presented in Figure 3.
Insert Figure 3 here
Figure 3 indicates that both debits and credits (relative to the credit line) of defaulters are more or less stable in the range 60% to 80% during event time -36 to -18 and they drop sharply afterwards. Most of this sudden decrease occurs during event time -18 to -12. Obviously, cumulative credits and debits are highly correlated and move relatively in tandem as hypothesized above. For comparison, CLR and DLR of all customers do not change very
8
The graph for defaulters is based on 310 (574) observations at event time -36 (-24) and on average, during the entire event time window on 771 observations.
9
The inverse of CLR and DLR can be interpreted as limit-credit duration (how many months does it take that cumulative credit payments can pay back the limit?) and limit-debit duration (how many months does it take that cumulative debit payments reach the limit?).
much, remaining above 70% all the time. Given these findings, we conclude that the evolution of credit payments indicates an abnormal pattern roughly 12-18 months prior to the actual default event.
B. Multivariate regression analysis
We now turn to a multivariate econometric analysis by means of probit regression models. All regression models are estimated in calendar time in order to take an ex ante perspective. Subsequently, we study which factors at calendar time t and t-12 influence the probability of default in calendar time t+1. Default is indicated by a dummy variable which takes a value of one if the customer exhibits a jump to the default grades (rating 5 or 6) in t+1. Explanatory variables are the change of the internal rating (ΔRAT), the credit line usage (ΔUSAGE), the absolute checking account amplitude (ΔAMPLI), the credit-to-limit ratio (ΔCLR) and the cumulative number of limit violations (ΔCUMVIOL) during the period [t, t-12] and the period [t-12, t-24].10 Moreover, we also include the percentage change of the credit line (ΔLIMIT) as a control variable. This is important because the checking account variables (except AMPLI) are based on the payment behavior and the credit limit. However, the bank can change the credit limit to manage the loan exposure. For example, USAGE may increase if (i) the account balance steadily declines while LIMIT remains unchanged (i.e. the bank does not manage the loan exposure) or (ii) the account balance remains stable while LIMIT has been reduced by the bank. We expect a negative sign for the coefficient of limit changes because limit reductions can be one response of the bank with regard to borrowers facing financial problems. All variable changes are calculated over twelve months because within this period
10
The number of observations decreases due to the model specification. We cannot include accounts with (i) a history of less than 13 or less than 25 months respectively and (ii) with no credit line. In Section IV.B we estimate an alternative model that is based on considerably more observations.
at least one internal rating review has to be carried out.11 Note that the internal credit rating can be seen as a benchmark against which we test the usefulness of checking account information.12 Results are reported in Table II.
Insert Table II here
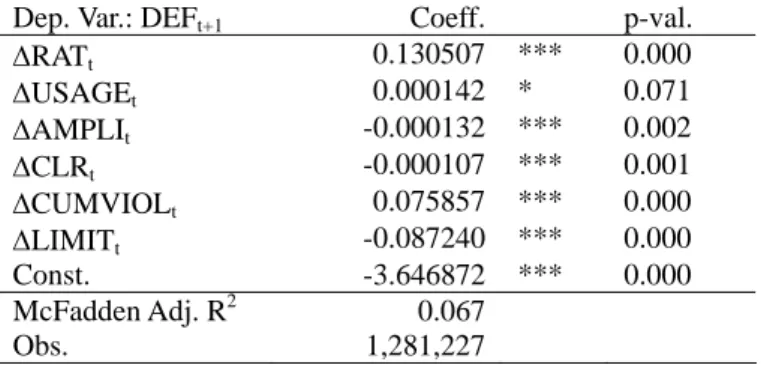
The key finding is that internal credit ratings and checking account variables have a statistically significant impact on the probability of default. Panel A shows that all variables are correctly signed and highly significant. As expected the change of the internal rating13, the credit line usage and the cumulative number of limit violations display a positive coefficient and the change of the absolute amplitude and the credit-to-limit ratio a negative coefficient. As expected, the control variable ΔLIMIT is statistically significant and negative. Panel B additionally includes the change of the explanatory variables lagged by 12 months, i.e. the change during the period [t-12, t-24]. Except the coefficient of ΔAMPLI and ΔCLR the results of Panel A are confirmed. In addition, we see that even the coefficients of the lagged rating change, the credit line usage and the cumulative number of limit violations are significantly positive.
In summary, estimation results from probit regression models confirm univariate results from the event study. In addition, the multivariate analysis shows that checking account
11
This approach is conservative because we do not consider short-run variable changes which are more likely to occur at the checking accounts than in case of the internal ratings. Nonetheless, we have also estimated the model with changes of all variables over consecutive 3 and 6-months intervals and obtain very similar results. 12
We have also estimated a two-stage model to test whether there is an overlap of information in credit ratings and checking accounts (first stage: credit rating changes as a function of checking account variables, second stage: future defaults as a function of the residuals from the first stage). Although checking account information is not formally included in the ratings, it may be possible that some loan officers make informal (or discretionary) use of this information. We find that the residuals from the first stage, i.e. the unexplained part of rating changes, are significantly positively associated with future defaults, indicating that checking account information goes beyond information included in credit ratings.
13
Note that positive rating changes indicate a credit quality deterioration (for example, from rating grade 2 at time t-12 to rating grade 4 at time t) since higher numbers correspond to rating grades of a higher default risk.
information is also useful if we control for changes of internal ratings and credit lines changes.
C. Results by customer type
In this section we continue the analysis by questioning whether our previous results hold for different types of customers as well. As discussed beforehand we differentiate between both the legal form GROUP (companies, small businesses, and individuals) and SIZE (large, mid, and small). The complexity of payments at the checking accounts and the mechanism of default differ considerably across these groups. Note that in the following event study we use GROUP- or SIZE-specific benchmarks in this section. For example, a checking account variable of defaulters in SIZE = 1 (or GROUP = 1) is compared with the median of all customers from the same category, i.e. with SIZE = 1 (GROUP 1). This analysis is not only interesting for comparison purposes across groups but it is also more precise than the analysis from the previous section because the benchmarks are more appropriate. Figure 4 displays the event study results for the absolute checking account amplitude AMPLI which can be interpreted as an indicator for balance variation within a month.14
Insert Figure 4 here
Essentially, findings from the previous section are confirmed. In all sub-groups we find that the absolute amplitude of defaulters decreases considerably some time before default while the one of all customers does not change very much. However, there are important differences within the categories of GROUP and SIZE. Differentiating by legal forms based on GROUP (Figures 4a, b, c) reveals that the warning sign by AMPLI occurs 12 to 6 months
14
We have repeated the univariate analysis with the variables USAGE, CLR and DLR and obtain qualitatively similar results.
before default at small businesses, 6 months before default at individuals and only slightly before default at companies. A differentiation by SIZE (Figures 4d, e, f) leads to very similar results. However, for small customers (essentially individuals) a clear warning indication is observed 12 months prior to default. In addition, it turns out that there are no clear warning indications for companies and large customers. In summary, we conclude that checking account information from small businesses and individuals (mid-sized and small customers) provide banks with warning signs about the credit quality 6-12 months prior to a subsequent default. In contrast, checking account information does not significantly help monitoring companies (corporations, partnerships) and large customers (with mean monthly cumulative credit payments above 12,835 EUR).
In a next step, we re-estimate the probit regression model from the previous section for the categories of GROUP and SIZE. Table III summarizes the estimation results.
Insert Table III here
Table III provides very interesting insights on the usefulness of checking information across types of customers. Panel A presents the results differentiated by GROUP. The change of the internal credit rating, the credit line usage and the cumulative number of violations display a significantly positive coefficient for companies. For small businesses, only
ΔCUMVIOL at t and t-12 and the internal credit rating change at t-12 have a significantly positive influence on the probability of default. Most important, for individuals we find that all contemporaneous checking account variables are correctly signed and highly significant. In addition, in contrast to commercial customers there is no impact of the internal rating change at t-12. Panel B distinguishes by size categories. Basically, the results shown in Panel B are even clearer than in Panel A. Note that the findings for large and mid-sized customers are very similar, i.e. the rating change in t and t-12 and the change of the cumulative number
of violations display significant coefficients (and ΔUSAGE at t for mid-sized customers). In opposite, internal credit rating changes have no impact on the probability of default for small customers while all checking account variables are signed as expected and highly significant. It is noteworthy that the change of the cumulative number of limit violations (ΔCUMVIOL) performs especially well. The contemporaneous change of this variable exhibits a significantly positive coefficient for all GROUP- and SIZE-categories and the lag is significant for small businesses, individuals and small customers. Finally, as expected the contemporaneous change of ΔLIMIT is significantly negative in for all categories. Our results on the checking account variables do not change if we exclude ΔLIMIT from the regression models.
D. Results conditional on internal credit ratings
Subsequently, we investigate whether the usefulness of checking account information depends on (i) the credit rating in the default status, i.e. the type of default event, (ii) the rating at the beginning of the checking account time series, and (iii) the rating one month prior to default. Our expectation is that checking account information is more useful for (i) defaults to rating grade 6 (bankruptcy filing) in comparison to defaults to rating grade 5, (ii) the better the rating at the beginning, and (iii) the better the rating before default.
We start the analysis with a differentiation by default event types. As mentioned above default to rating grade 5 is under some control of the bank management while a default to rating grade 6 can be regarded as exogenous and has more severe consequences for the bank. Figure 5 shows event study results for the credit line usage behavior (USAGE) if we differentiate the 1,009 default events by default type (541 defaults to rating grade 5 and 468 defaults to rating grade 6).
During the event time -36 to -12 months the credit line usage USAGE increases in a very similar way that significantly differs from that of all customers. It is noteworthy that the credit line usage of customers with subsequent defaults to rating grade 6 is above the other curve most of the time. Interestingly, it increases sharply from 50% to almost 100% during the 9 months prior to default while the corresponding variable for defaults to rating grade 5 even decreases during the event time interval -4 to 0. In summary, we find that credit line usage provides a particularly reliable short-term early warning indication of “hard defaults” while the usefulness for “soft defaults” is smaller.
In a next step, we condition the evolution of checking account variables (USAGE, AMPLI) on credit ratings at the beginning of a customer’s checking account time series in our sample and on the credit rating level one month before default. The corresponding findings are presented in Figure 6.
Insert Figure 6 here
Figures 6a and 6b reveal that checking account information is more useful for credit risk assessment purposes if the customer’s start rating is 1, 2 or 3. In contrast, USAGE is not and AMPLI is only weakly informative if customers have a start rating of 4. These results can be interpreted as follows. If a customer exhibits a relatively low creditworthiness long time before default (rating grade 4), the checking account has already reached an abnormal pattern. In contrast, if a defaulter’s rating is relatively good at the beginning of the sample there is much time left for a gradual deterioration at the checking account. The latter is exactly what we observe for customers with start ratings of 1, 2 or 3.
In addition, we also condition our analysis on the rating one month before default to distinguish between “surprising” defaults and “unsurprising” defaults. The corresponding
empirical results are shown in Figures 6c and 6d. The variable USAGE is very informative for defaulters from relatively good ratings (1, 2, or 3) while it is not useful for rating grade 4 at all. The same holds for the absolute amplitude AMPLI. The amplitude for customers that default from good rating grades declines considerably below that of all customers 5 months prior default whereas the one of defaulters from grade 4 is similar to that of all customers during -12 to 0. Finally, these findings are confirmed by multivariate probit regression models (not reported here), including credit lines changes as a control variable.
E. Checking account information and bank relationship characteristics
Previous analyses have provided evidence in favor of the hypothesis that checking account information can help banks to monitor their customers. In this section, we examine whether this finding holds if we control for bank relationship characteristics. The latter are proxied by means of two frequently used variables from the empirical banking literature (see Berger and Udell 1995, Petersen and Rajan 2002, Degryse and Ongena 2005): the duration of the bank-customer relationship and the physical distance between the domicile of the customer and the bank’s head office. Both variables may be interpreted as indicators of the intensity of the bank-customer relationship. This implies that they also may serve as proxies for the degree of asymmetric information between a bank and its customers (see Boot 2000, Elyasiani and Goldberg 2004). Table IV presents the probit regressions results by duration (long, short) and distance (low, high). Again, we include credit limit changes and legal form (GROUP) of the customer as control variables.
Insert Table IV here
With regard to duration (Panel A), we find that checking account information is more useful than ratings in the case of customers with a long duration. Note that changes of the
internal credit ratings at t and t-12 are not significantly related to future defaults at all. This finding suggests that the reliabilty of information from checking account becomes higher in the course of a bank-customer relationship. In contrast, checking account and rating information appear to be complementary for monitoring customers with a short duration. In other words: credit ratings are relatively more important for rather new customers. Panel B reveals that ratings and checking account information are both significantly related to defaults of near customers while contemporaneous checking account information is clearly less important in terms of statistical significance for customers located far away. Furthermore, it is noteworthy that the variable ΔCUMVIOL performs especially well in most of the cases.
Summarizing, we find that checking account information is more informative for customers with a long duration and a small distance. These results indicate that checking account information is particularly useful if there is a close bank-customer relationship, i.e. relatively low informational asymmetries. This is consistent with findings from the cross-sectional study by Agarwal and Hauswald (2007) and implies that main banks that are typically relationship lenders can benefit more from extracting checking account information than arm’s-length banks.
IV. Tests of robustness A. Miscellaneous empirical checks
In this section, we use an alternative benchmark for checking account information, examine the influence of outliers and analyze the stability of our findings over time. First, instead of including rating changes over the period [t, t-12] to predict defaults at time t+1, we include changes of the probability of default associated with each rating grade. This test takes explicitly into account that a move from grade 1 to 2 corresponds to a considerably smaller change in the probability of default than a move from grade 3 to 4. In other words, we control for the fact the difference between average PDs of adjacent rating grades is increasing the
lower the credit quality. It turns out that the coefficient of ΔPDt is positive and highly
significant (p<0.01). Furthermore, the sign and the statistical significance of all checking account variables are not changed in comparison to Table II. Consequently, we conclude that previous findings are robust if we control for non-linearities in default risk changes.
Second, we winsorize the variables USAGE, AMPLI, CLR, and LIMIT at the 0.5%/99.5%-level to study whether extreme observations influence previous results (see, for example, Carey and Hrycay (2001) for winsorization of accounting variables in a default prediction model). Repeating all previous analyses with winsorized explanatory variables leads to slightly higher coefficients and essentially similar findings. The impact of credit line usage (USAGE) is reduced in terms of statistical significance while results for the other checking account variables remain basically unchanged.
Third, we re-estimate the probit model from Table II, Panel A, for the years 2002-2004 (378 defaults) and the years 2005-2006 (631 defaults) separately. It turns out that rating changes have an impact on future defaults in both subsamples. In addition, we find that two out of four checking account variables (AM, CUMVIOL) are significant and correctly signed in the first half of the sample while all four variables are highly significant during the second half. Given that our data covers only five calendar years we cannot say whether this result is due to an increasing reliability of checking account information or simply due to the higher number of defaults in the second half. Most important, we observe that at least some checking account variables are significantly related to subsequent defaults in both sub-samples.
B. Checking accounts with and without credit lines
All findings presented so far are based on data from checking accounts with a credit line (55% of all account-month observations and 49% of all customers). We now investigate whether checking account information is also useful to assess the credit risk of customers which do not have a credit line. In other words, we test if our results are driven by a selection
bias. For this purpose, we modify the probit model from Table II, Panel A, as follows. We consider DEFt+1 as dependent variable and include a reduced number of explanatory
variables: the rating change, the change of the account amplitude, and a new variable, the cumulative number of overdrafts (CUMOVER). The latter counts the number of limit violations (for customers which have a credit line) and unauthorized overdrafts (which occurs if LOW < 0 Euro in case of customers which have no credit line). We exclude all variables that can only be observed for customers with a credit line (USAGE, CLR, LIMIT). The number of observations available for model estimation now increases by 72% (from 1.2 millions to 2.2 millions). First, we estimate the previously described model on all observations. Second, we consider only data from accounts without a credit line. Table V summarizes the results.
Insert Table V here
The regression reveals that both the change of the internal rating (ΔRAT) and the cumulative number of overdrafts (ΔCUMOVER) are highly significant and positively related to future defaults while the account amplitude is not. In addition, differentiating by GROUP (not reported in Table V) indicates that ΔCUMOVER is significant for each group and the magnitude of the coefficient increases from companies (0.063) and small businesses (0.071) to individuals (0.085). Furthermore, in case of accounts without credit lines we observe that the cumulative number of overdrafts is the only variable that has a significant and economically meaningful impact on the probability of subsequent defaults. In summary, we can show that our previous findings do not suffer from data selection problems because checking account information also helps predicting defaults of customers without credit lines.
C. Single-account and multiple-account bank relationships
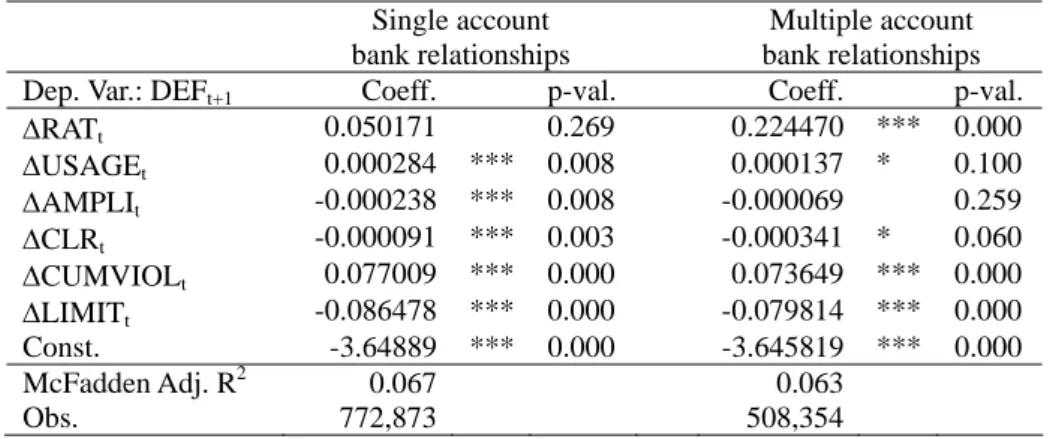
Another important factor that might influence the usefulness of checking account information for loan monitoring is the structure of the bank relationship. In particular, the number of accounts per customer and the relative importance of each account in case of multiple-account bank relationships could have an impact (for example, a dilution or distortion of information). As shown in Table I, Panel A, the data set includes customers which have a single account with the bank (78% of all observations) and others which have multiple accounts. Subsequently, we re-estimate the baseline model at the customer level (i.e. one account from every customer) to study the robustness of previous findings which are based on an estimation at the account-level. Specifically, we consider the structure of the bank relationship in two ways. First, we repeat the analysis for customers which have only one account with the bank (i.e. there is no dilution across accounts) and compare the outcome with previous results. Note that this approach is rather restrictive since we drop approximately 40% of all observations in the regression models.15 Therefore, we consider a second approach which ensures that we have at least one account time series from each customer. For this purpose, we rank all accounts per customer according to their relative importance. The latter is proxied by the monthly mean cumulative credit payments (debit payments) and by the length of the available account time series.16 Based on these rankings, we re-estimate the probit models on data for single-account bank relationships and the most important accounts in case of multiple account relationships. Following this approach we only loose 10% of all observations. Table VI reports the results.
15
However, the sample composition is not substantially changed. The share of account-month observations from companies and small businesses decreases slightly from 14.1% to 11.6%. The corresponding share at the customer level declines from 11.3% to 10.2%. Hence, shrinking the sample does not create selection problems. 16
The account rank per customer based on monthly mean credits is highly correlated with the rank based on monthly mean debits (Spearman rank correlation coefficient of 0.95). Therefore, we only consider the mean credit rank in the remainder. Interestingly, the length of the account time-series exhibits a rank correlation of 0.77 with the mean credit rank measure, indicating that both ranking approaches are not perfectly congruent.
Insert Table VI here
Panel A shows that the results for the checking account variables in case of single-account relationships are similar to Table II. This is consistent because the majority of all observations come from customers that have only one account and these are typically small customers like individuals. We also observe that internal rating changes are not significantly related to subsequent defaults which is in line with Table III, Panel B (small customers). In addition, for multiple-account bank relationships we find that the rating is relatively more important but still three out of four checking account variables display the expected sign and are statistically significant. Panel B also confirms previous results. Regardless whether we proxy the importance of an account by monthly mean credit payments or the length of the time series we obtain results very similar to Table II, Panel A. Hence, previous findings remain robust if we explicitly take into account the structure of the bank relationship.
V. Conclusions
Checking accounts and payment services may represent a powerful source for banks to extract private information about their customers. By means of a unique data set with more than 3 million account-month observations from the period 2002-2006 we analyze empirically whether checking account information may help banks to monitor the credit risk of their customers.
Essentially, we find that the credit line usage, the cumulative number of limit violations, the account amplitude and the credit-to-limit ratio exhibit an abnormal pattern approximately 12 months before default. Comparing customer types and size categories reveals that checking account information is particularly helpful for monitoring relatively small customers, i.e. small businesses and individuals. Especially, the change of the credit line usage and the cumulative number of limit violations exhibit a significantly positive impact on
the probability of default in the next period. Moreover, we condition the checking account behavior on internal credit ratings and find that checking account information conveys more reliable warning signs if the start and pre-default rating is relatively good in comparison to customers with a relatively bad rating. Distinguishing by default types (first specific loan loss provision vs. bankruptcy) reveals that warning indications from checking accounts are considerably clearer for customers who experience a more severe default event. Furthermore, we examine if the informativeness of checking accounts is associated with bank relationship characteristics like duration and distance. Interestingly, it turns out that abnormal patterns of checking account variables are earlier observable in case of strong bank-customer relationships (long duration, small distance), suggesting that this information is especially valuable for main banks. All results remain robust if we control for credit line changes. Finally, tests of robustness indicate that our findings also hold for customers with and without credit lines as well as for single-account and multiple-account bank relationships.
This study has important implications. Our results reveal that checking accounts represent indeed a major source of information for banks that is complementary to internal credit rating systems. It is very unlikely that those borrowers who are close to financial distress can hide credit-relevant information from the bank (by manipulating their payment behavior) because they face considerable transaction costs and constraints. Consequently, banks can benefit from exploiting this private, timely, hard, and almost costless information on existing customers for credit risk management and pricing purposes. Avenues for further research are to measure the forecasting accuracy of checking account information in comparison to internal credit ratings as well as to study how banks react upon early warning indications.
REFERENCES
Agarwal, Sumit, and Robert Hauswald, 2007, The Choice between Arm’s-Length and Relationship Debt: Evidence from eLoans, Working Paper, March 2007.
Apilado, Vincent P, Warner, Don C., and Joel J. Dauten, 1974, Evaluative Techniques in Consumer Finance -- Experimental Results and Policy Implications for Financial Institutions, Journal of Financial and Quantitative Analysis 9, 275-283.
Basel Committee on Banking Supervision, 2006, Basel II: International Convergence of Capital Measurement and Capital Standards: A Revised Framework – Comprehensive Version, June 2006.
Berger, Allen N., Miller, Nathan H., Petersen, Mitchell A., Rajan, Raghuram G., and Jeremy C. Stein, 2005, Does function follow organizational form? Evidence from the lending practices of large and small banks, Journal of Financial Economics 76, 237-269.
Berger, Allen N., and Gregory F. Udell, 1995, Relationship lending and lines of credit in small firm finance, Journal of Business 68, 351-381.
Berger, Allen N., and Gregory F. Udell, 2002, Small Business Credit Availability and Relationship Lending: The Importance of Bank Organisational Structure, Economic Journal 112, F32-F53.
Bharath, Sreedhar, Dahiya, Sandeep, Saunders, Anthony, and Anand Srinivasan, 2007, So what do I get? The bank’s view of lending relationships, Journal of Financial Economics
85, 368-419.
Black, Fisher, 1975, Bank Funds Management in a efficient market, Journal of Financial Economics 2, 323-339.
Blackwell, David W., and Drew B. Winters, 1997, Banking relationships and the effect of monitoring in loan pricing, Journal of Financial Research 20, 275-289.
Boot, Arnoud W.A., 2000, Relationship Banking: What do we know? Journal of Financial Intermediation 9, 7-25.
Carey, Mark, and Mark Hrycay, 2001, Parameterizing credit risk models with rating data,
Journal of Banking and Finance 25, 197-270.
Chakravarty, Sugato, and James S. Scott, 1999, Relationships and rationing in consumer loans, Journal of Business 72, 523-544.
Cole, Rebel A., 1998, The importance of relationships to the availability of credit, Journal of Banking and Finance, 22, 959-977.
Cole, Rebel A., Goldberg, Lawrence G., and Lawrence J. White, 2004, Cookie-Cutter versus Character: The Micro Structure of Small-Business Lending by Large and Small Banks,
Journal of Financial and Quantitative Analysis 39, 227-251.
Degryse, Hans, and Steven Ongena, 2005, Distance, Lending Relationships, and Competition,
Journal of Finance 60, 231-266.
Eisfeld, Curt, 1935, Kontenanalyse im Dienste der Kreditbeobachtung, Sparkasse 55, 333-345.
Elsas, Ralf, and Jan P. Krahnen, 1998, Is relationship special? Evidence from credit-file data in Germany, Journal of Banking and Finance 22, 1283-1316.
Elsas, Ralf, 2005, Empirical Determinants of Relationship Lending, Journal of Financial Intermediation 14, 32-57.
Elyasiani, Elias, and Lawrence G. Goldberg, 2004, Relationship lending: a survey of the literature, Journal of Economics and Business 56, 315-330.
Fama, Eugene F., 1985, What's different about banks, Journal of Monetary Economics 15, 29-39.
Grunert, Jens, Norden, Lars, and Martin Weber, 2005, The role of non-financial factors in internal credit ratings, Journal of Banking and Finance 29, 509-531.
Hackl, Peter, and Anton Schmoll, 1990, Kontodatenanalyse zur Früherkennung von Kreditrisiken, Österreichisches Bank-Archiv 38, 870-881.
Jiménez, Gabriel, Lopez, Jose A., and Jesús Saurina, 2007, Empirical Analysis of Corporate Credit Lines, Working Paper 2007-14, June 2007, Federal Reserve Bank of San Francisco. Machauer, Achim, and Martin Weber, 1998, Bank Behavior Based on Internal Credit Ratings
of Borrowers, Journal of Banking and Finance 22, 1355-1383.
Mester, Loretta J., Nakamura, Leonard I., and Micheline Renault, 2007, Transaction accounts and loan monitoring, Review of Financial Studies 20, 529-536.
Nakamura, Leonard I., 1993, Commercial Bank Information: Implications for the Structure of Banking, in Klausner, Michael, and Lawrence J. White, eds.: Structural Change in Banking, 131-160.
Ongena, Steven, and David C. Smith, 2001, The duration of bank relationships, Journal of Financial Economics 61, 449-475.
Petersen, Mitchell A., 2004, Information: Hard and Soft, Working Paper, July 2004.
Petersen, Mitchell A., and Raghuram G. Rajan, 1994, The Benefits of Lending Relationships: Evidence from Small Business Data, Journal of Finance 49, 3-37.
Petersen, Mitchell A. and Raghuram G. Rajan, 2002, Does Distance Still Matter? The Information Revolution in Small Business Lending, Journal of Finance 57, 2533-2570. Schlüter, Burkhard, 2005, Empirische Analyse der Bedeutung interner Informationen von
Kreditinstituten für die Bonitätsprüfung, Shaker: Aachen, 2005.
Sufi, Amir, 2007, Bank lines of credit in corporate finance: an empirical analysis, forthcoming
Review of Financial Studies.
Treacy, William F., and Mark Carey, 2000, Credit risk rating systems at large US banks,
Journal of Banking and Finance 24, 167-201.
Udell, Gregory F., 1989, Loan quality, commercial loan review and loan officer contracting,
Journal of Banking and Finance 13, 367-382.
Vale, Bent, 1993, The dual role of demand deposits under asymmetric information,
Scandinavian Journal of Economics 95, 77-95.
von Stein, Johann H., 1983, Früherkennung von Kreditrisiken mit quantitativen Methoden,
Table I Summary statistics
Panel A: Number of customers, accounts and account-month observations
The data was provided by a German universal bank and the sample period is January 2002 to December 2006.
Subject Companies Small businesses Individuals All
Customers 1,969 5,644 59,673 67,215 Accounts 3,003 8,005 75,887 86,945 Account-months (%) 123,939 3.79 336,286 10.28 2,811,654 85.93 3,271,879 100.00 Accounts per customer
(%) (1) 78.07 (2) 17.03 (3-4) 4.48 (5 or more) 0.42 Length of time series in months
(%) (1-11) 1.26 (12-35) 12.73 (36-47) 8.83 (48-60) 77.18
Panel B: Checking account and bank-relationship variables
The variables LOW, …, and AMPLI are reported in thousands of Euros and refer to the account level. LOW and HIGH may be negative or positive. DEBIT and CREDIT are defined as positive numbers. MID can be positive or negative while LIMIT is defined as a negative number. AMPLI is a positive number. USAGE is positive if a credit line is drawn and negative in case of no usage. The internal rating RAT ranges from 1 (best) to 6 (worst).
Variable Variable description Mean Median St. dev. Min Max
LOW Minimum account balance per
month -0.16 0.00 61.36 -6,486.24 8,959.00
HIGH Maximum account balance per
month 4.15 1.00 98.68 -6,486.24 70,154.38
MID Monthly average account
balance 1.99 0.50 73.08 -6,486,24 35,082.48
DEBIT Monthly cumulative debit
payments 8.04 1.00 215.58 0.00 49,516.00
CREDIT Monthly cumulative credit
payments 8.22 1.00 220.08 0.00 70,959.91
LIMIT Credit limit (nominal credit
line) -8.12 -2.50 80.48 -7,158.08 0.00
USAGE Monthly credit line usage =
BALANCE / LIMIT (%) -108.47 -23.35 1,986.29 -401,980.00 1,020,000.00
AMPLI Monthly absolute account
amplitude = HIGH - LOW 4.32 1.00 75.13 0.00 70,143.78
DUR Duration of bank-customer
relationship (years) 8.06 4.99 7.79 0.00 26.93
DIST Distance between customer and
bank based on first three digits of the postal code (kilometers)
7.21 0.00 28.84 0.00 613.89
RAT Internal credit rating, ranging
from 1 (best) to 6 (worst) 2.87 3.00 0.81 1.00 6.00
Panel C: Number of credit events
Default events are defined as internal rating changes to grade 5 or 6. The bank assigns a borrower to grade 5 when it establishes the first specific loan loss provision. A rating 6 indicates that the customer has filed for bankruptcy. All events refer to the account level.
Variable Number of events
Rating changes 12,803 hereof upgrades 5,515 hereof downgrades 7,288 Defaults 1,009 … hereof rating 5 541 … hereof rating 6 468
Table II
Baseline probit regression results
The dependent variable is default at calendar time t+1 (DEFt+1 takes the value 1 for jumps to default and 0 for
non-defaults). Explanatory variables are the rating change (ΔRAT), the change of the credit line usage
(ΔUSAGE), the change of the absolute checking account amplitude (ΔAMPLI), the change of the credit-to-limit ratio (ΔCLR), the change of the cumulative number of limit violations (ΔCUMVIOL) and the relative change of
the credit limit (ΔLIMIT) during the period [t, t-12] and the period [t-12, t-24]. We divide the variables
ΔUSAGE and ΔCLR by 100 to scale the estimated coefficients. Regressions take into account the clustering of
observations at the account level and are based on p-values from Huber-White robust standard errors.
Panel A: Estimation results for the period one year before default
Dep. Var.: DEFt+1 Coeff. p-val.
ΔRATt 0.130507 *** 0.000 ΔUSAGEt 0.000142 * 0.071 ΔAMPLIt -0.000132 *** 0.002 ΔCLRt -0.000107 *** 0.001 ΔCUMVIOLt 0.075857 *** 0.000 ΔLIMITt -0.087240 *** 0.000 Const. -3.646872 *** 0.000 McFadden Adj. R2 0.067 Obs. 1,281,227
Panel B: Estimation results for the period two years before default
Dep. Var.: DEFt+1 Coeff. p-val.
ΔRATt 0.126352 *** 0.001 ΔUSAGEt 0.000403 *** 0.000 ΔAMPLIt -0.000150 ** 0.036 ΔCLRt -0.000147 *** 0.007 ΔCUMVIOLt 0.053731 *** 0.000 ΔLIMITt -0.133008 *** 0.000 ΔRATt-12 0.151072 *** 0.003 ΔUSAGEt-12 0.000327 ** 0.013 ΔAMPLIt-12 -0.000112 0.278 ΔCLRt-12 -0.000048 0.176 ΔCUMVIOL t-12 0.033801 *** 0.000 ΔLIMITt-12 -0.013785 0.148 Const. -3.643053 *** 0.000 McFadden Adj. R2 0.077 Obs. 815,480
Table III
Probit regression results by legal form and size
The dependent variable is default at calendar time t+1 (DEFt+1 takes the value 1 for jumps to default and 0 for
non-defaults). Explanatory variables are the rating change (ΔRAT), the change of the credit line usage
(ΔUSAGE), the change of the absolute checking account amplitude (ΔAMPLI), the change of the credit-to-limit ratio (ΔCLR), the change of the cumulative number of limit violations (ΔCUMVIOL) and the relative change of
the credit limit (ΔLIMIT) during the period [t, t-12] and the period [t-12, t-24]. We divide the variables
ΔUSAGE and ΔCLR by 100 to scale the estimated coefficients. The variables GROUP is based on the
customer’s legal form (companies, small businesses, and individuals) and SIZE is based on the average credit payments in a month (<75%: small, 75%-95%: mid, >95%: large). Regressions take into account the clustering of observations at the account level and are based on p-values from Huber-White robust standard errors.
Panel A: Estimation results by legal form (GROUP)
Companies Small businesses Individuals
Dep. Var.: DEFt+1 Coeff. p-val. Coeff. p-val. Coeff. p-val.
ΔRATt 0.184604 *** 0.008 0.039642 0.518 0.085223 * 0.061 ΔUSAGEt 0.000629 ** 0.039 0.000244 0.332 0.000441 *** 0.002 ΔAMPLIt -0.000038 0.577 0.000056 0.646 -0.000806 *** 0.001 ΔCLRt 0.000029 0.783 -0.000630 0.615 -0.000162 *** 0.004 ΔCUMVIOLt 0.061574 *** 0.000 0.016049 *** 0.001 0.049243 *** 0.000 ΔLIMITt -0.278374 *** 0.000 -0.173408 *** 0.000 -0.124858 *** 0.000 ΔRATt-12 0.161231 ** 0.012 0.165212 ** 0.019 0.094969 0.283 ΔUSAGEt-12 0.000626 ** 0.026 0.000134 0.608 0.000216 0.460 ΔAMPLIt-12 -0.000028 0.818 -0.000056 0.697 -0.000254 0.144 ΔCLRt-12 0.000493 ** 0.036 -0.000216 0.703 -0.000065 ** 0.021 ΔCUMVIOLt-12 0.005214 0.730 0.027174 * 0.084 0.037399 *** 0.000 ΔLIMITt-12 -0.073272 0.276 -0.007390 0.742 -0.017373 0.199 Const. -3.247895 *** 0.000 -3.59107 *** 0.000 -3.679721 *** 0.000 McFadden Adj. R2 0.046 0.054 0.054 Obs. 28,494 85,003 701,983
Panel B: Estimation results by customer size (SIZE)
Large Mid-sized Small
Dep. Var.: DEFt+1 Coeff. p-val. Coeff. p-val. Coeff. p-val.
ΔRATt 0.206479 *** 0.000 0.167764 ** 0.048 0.035972 0.466 ΔUSAGEt -0.001143 0.299 0.000551 ** 0.019 0.000878 *** 0.001 ΔAMPLIt -0.000046 0.562 -0.000463 0.684 -0.011669 *** 0.000 ΔCLRt -0.000077 0.968 -0.000151 0.844 -0.001778 *** 0.002 ΔCUMVIOLt 0.050922 *** 0.002 0.075786 *** 0.000 0.046392 *** 0.000 ΔLIMITt -0.208655 *** 0.000 -0.110942 *** 0.000 -0.133217 *** 0.000 ΔRATt-12 0.237709 *** 0.000 0.212156 *** 0.008 0.023042 0.818 ΔUSAGEt-12 -0.000428 0.563 0.000416 0.121 0.001706 ** 0.015 ΔAMPLIt-12 -0.000054 0.683 -0.000099 0.912 -0.004621 *** 0.000 ΔCLRt-12 0.000027 0.890 0.000264 0.673 0.000577 0.392 ΔCUMVIOLt-12 0.023682 0.106 0.009469 0.545 0.041089 *** 0.000 ΔLIMITt-12 -0.062538 0.123 0.003573 0.791 -0.019517 0.200 Const. -3.494538 *** 0.000 -3.691999 *** 0.000 -3.646014 *** 0.000 McFadden Adj. R2 0.072 0.067 0.060 Obs. 61,066 252,255 502,159