THE EFFECT OF CREDIT RISK MANAGEMENT ON THE FINANCIAL
PERFORMANCE OF COMMERCIAL BANKS IN TANZANIA
AMBROSE NTANGEKI NSHALA
A DISSERTATION SUBMITTED IN PARTIAL FULFILLMENT OF THE
REQUIREMENTS FOR THE DEGREE OF MASTER OF BUSINESS
ADMINISTRATION OF THE OPEN UNIVERSITY OF TANZANIA
2017
CERTIFICATION
The undersigned certifies that has read and hereby recommends for acceptance by
the Open University of Tanzania the dissertation entitled
“The Effect of Credit Risk
Management on the Financial Performance of Commercial Banks in Tanzania”
submitted in partial fulfillment of the requirements for the degree of master of
Business Administration of the Open University of Tanzania.
………..
Dr. Proches Ngatuni
Supervisor
………..…….…………..
COPYRIGHT
"No part of this dissertation may be reproduced, stored in any retrieval system, or
transmitted in any form or by any means without prior written permission of the
author or the Open University of Tanzania in that behalf".
DECLARATION
I,
Ambrose Ntangeki Nshala, do hereby declare that this dissertation is my own
original work and that it has not been submitted for a similar degree in any other
University.
………
Signature
……….
DEDICATION
ACKNOWLEDGEMENT
I want to thank Mr. Benson Bimbiga, a true friend indeed, for being always ready to
assist whenever I needed his help. My sincere appreciation to my Supervisor, Dr.
Proches Ngatuni, without whom this work would not have been completed. His
passion and dedication to his work is unmatchable. He did not only supervise but he
encouraged me, inspired and imparted in me a desire to continue to the next step.
ABSTRACT
The purpose of this study was to determine the effect of credit risk management on
the profitability of commercial banks in Tanzania. Secondary panel data was
collected from published financial statements of a sample of 19 commercial banks
covering a period of 11 years, from 2005 to 2015 and used for the analysis. Financial
profitability of the banks was proxied by Return on both assets and equity ratios.
Independent variables included, nonperforming loan ratio, capital adequacy ratio,
total loans to total deposits ratio and loan loss provision to nonperforming loan ratio.
Panel data regression analysis were used to run the estimation model, specifically
pooled regression model. Results reveal that there was a significant negative
relationship between the NPL/TL ratio and ROE. Also, there was a significant
negative relationship between the LLP/NPL ratio with both ROE and ROA. It was
also revealed that CAR had an insignificant positive relationship with ROE but
significant positive relationship with ROA. However, TL/TD ratio had negative but
insignificant relationship with both ROE and ROA. It is concluded that increasing
nonperforming loans relative to total loans reduces the profitability of a bank or
financial institution and so is increasing loan loss provisions relative to
non-performing loans. Therefore, management and all stakeholders are required to put in
place a robust credit risk management structure that will strengthen the loan
assessment process so as to minimize possibility of issuing potentially bad loans.
Furthermore, management should put in place an effective credit portfolio
management mechanism so as to effectively follow up on all issued credit facilities
so as they do not turn bad.
TABLE OF CONTENTS
CERTIFICATION ... ii
COPYRIGHT... iii
DECLARATION ... iv
DEDICATION ...v
ACKNOWLEDGEMENT ... vi
ABSTRACT ... vii
TABLE OF CONTENTS ... viii
LIST OF TABLES ... xi
ABBREVIATIONS AND ACRONYMS ... xii
CHAPTER ONE ...1
1.0 INTRODUCTION ...1
1.1
Background of the Study ...1
1.2
Statement of the Research Problem ...5
1.3
Research Objectives ...6
1.3.1
General Research Objectives ...6
1.3.2
Specific Research Objectives...6
1.4
Research Questions ...7
1.4.1
General Research Question...7
1.4.2
Specific Research Questions ...7
1.5
Relevance of the Research ...7
1.6
Organization of the Dissertation ...8
CHAPTER TWO ...9
2.1
Overview ...9
2.2
Conceptual Definitions ...9
2.2.1
Financial Performance ...9
2.2.2
Credit Risk ... 10
2.2.3
Credit Risk Management ... 11
2.2.4
Credit Risk Management Indicators ... 12
2.3
Theoretical Linkages between Credit Risk Management Indicators ... 15
2.4
Empirical Literature Review ... 16
2.5
Policy Review ... 18
2.6
Research Gap ... 21
2.7
Conceptual framework ... 21
2.8
Hypotheses ... 22
CHAPTER THREE ... 23
3.0 RESEARCH METHODOLOGY ... 23
3.1
Overview ... 23
3.2
Research Strategies ... 23
3.3
Survey Population ... 23
3.4
Sampling Design and Procedures ... 24
3.5
Variables and their Measurement Procedures ... 24
3.5.1
Independent Variables ... 24
3.5.2
Banks’ Financial Profitability ... 25
3.6
Methods of Data Collection ... 26
3.7
Data Processing and Analysis ... 27
4.0 FINDINGS AND DISCUSSIONS ... 28
4.1
Overview ... 28
4.2
Sample Description ... 28
4.3
Findings ... 30
4.4
Discussion ... 33
CHAPTER FIVE ... 35
5.0 SUMMARY CONCLUSION IMPLICATIONS RECOMMENDATIONS .. 35
5.1
Overview ... 35
5.2
Summary of Key Results ... 35
5.3
Conclusions ... 36
5.4
Implications ... 36
5.5
Recommendations... 36
5.6
Limitations and Areas for Future Research ... 37
LIST OF TABLES
Table 4.1 Panel Descriptive Statistics Parameters ... 29
Table 4.2 Panel Descriptive Statistics Variables ... 30
Table 4.3 Effect on ROE……….31
LIST OF ABBREVIATIONS AND ACRONYMS
ADF
African Development Fund
BCBS
Basel Committee on Banking Supervision
BFIA
Banking and Financial Institutions Act
CAR
Capital Adequacy Ratio
ERP
Economic Recovery Programme
IFRS
International Financial Reporting Standards
IRB
Internal Rating-based
TA
Total Assets
TL
Total Loans
TD
Total Deposits
LLP
Loan Loss Provision
NPL
Non-performing Loan
NPLR
Non-performing Loan Ratio
ROA
Return on Assets
ROE
Return on Equity
ROC
Return on Capital
RWA
Risk-Weighted-Assets
CHAPTER ONE
1.0 INTRODUCTION
1.1
Background of the Study
From Independence in 1961, Tanzania has experienced different economic policies but
the remarkable one was the Arusha Declaration in 1967, principle of which was Ujamaa
(socialism). During this time all privately owned institutions were nationalized, banks
being among them.
Government of Tanzania (GOT) embarked on major economic
reforms in 1986 following the launching of the Economic Recovery Programme
(ERP), (ADF, 2000). The financial reforms came into effect after the approval of the
Banking and Financial Institutions Act (BFIA) in 1991. This was accompanied by
liberalization of interest rates, elimination of administrative credit allocation,
strengthening of the Bank of Tanzania’s role in regulating and supervising financial
institutions, restructuring of state-owned financial institutions especially banks, and
allowing entry of private (both local and foreign) financial institutions (Randhawa &
Gallardo, 2003; URT, 2000 as cited by Kessy, 2011).
After the liberalization of the banking sector, Tanzania has experienced the influx of
many banks in the industry, some local, and others regional or multinationals.
Twenty-five (25) years after these reforms the banking sector is now formed with 34
fully fledged commercial banks, and other 20 community banks and microfinance
banks which makes the 54. Reforms have brought good services to customers,
efficient usage of resources, expansion of branch networks to all regions in the
country and above all profitability to investors. According to the BOT (2014), the
banking sector has been growing steadily for the past ten years. The total assets of
the whole banking industry have grown from TZS 4,287 billion in 2005 to TZS
22,473 billion in 2014. The portfolio of Loans, Advances and Overdraft has also
increased from TZS 1,446 billion to 11,886 billion by the end of 2014 while total
deposits closed at TZS 17,524 billion from TZS 3,598 billion in 2005. For the past
five years it has been reported that return on assets (ROA) is at an average of 2.5%
while return on equity (ROE) is at an average of 13.3%. From the numbers above it
is important to note that loans, advances and overdrafts make around 53% of the total
assets of the banks, thus making it the most significant asset in bank. It is also
equally important to note that credit portfolio makes 66.7% of the total earning
assets.
Furthermore, net interest income makes 53% of total income of banks. Banks depend
very much on the performance of their credit portfolios and thus any mismanagement
thereof can inflict severe damage on the bottom line of a particular bank and
sometimes it can wipe out the entire capital of the bank. Although commercial banks
face a few other risks such as liquidity risk, interest rate risk, foreign exchange risk,
operational risk, it is imperative to place a special attention on credit risk embedded
on the huge income from credits. Globally, more than 50% of total risk elements in
Banks and Financial Institutions (FI) are credit risk alone. Thus, managing credit risk
for efficient management of a FI has gradually become the most crucial task. Credit
risk management encompasses identification, measurement, matching mitigations,
monitoring and control of the credit risk exposures (Lalon, 2015). Gestel and
Baesems (2008) as cited in Li and Zou (2014) views financial sector as the backbone
of the economy and therefore its failure can disrupt economic development of a
given country. The default of a small number of customers may result in a very large
loss for the bank. There have been two strong examples of economic crises that were
caused by failure of the financial systems. First the Latin American debt crisis burst
in early 1980’s that saw Mexico's bank indebtedness expanded almost 230% over the
six-year period from 1976 to 1982, Brazil's 160%, Venezuela's obligations spurted
330%, Argentina's by a monstrous 550% and Chile's 850% (Wessel, 1984). Then
there is the USA financial crisis of 2007 to 2009, which sent shockwaves all over the
world. To the large extent, these two cases were associated with poor credit
management.
Failures of financial systems attracted the attention of Basel Committee which started
with an accord that regulated credit risk by according to proportionate capital
available. The Basel Accord (Basel I) called for a minimum capital ratio of capital to
risk-weighted assets of 8% to be implemented by the end of 1992 (Bis.org, 2014) as
cited by Li and Zou (2014). Consequently, Basel II came into effect, in 2004, to
better reflect banks’ underlying risk and response to financial innovation like
securitization. As per the BOT (2014), Tanzania has 34 fully licensed commercial
banks, but when the licensed community banks and non-bank financial institutions
are included the number jumps to 54. This growth of players in the financial sector
brings stiff competition for quality customers in the market. But when competition
gets too stiff, banks start to compromise on their lending policies and procedures so
as to attract new customers. This simple fact is what caused a financial crisis in the
Latin America in the 1980s and the USA crisis in 2007. It is also the same reason
that led to the collapse of some Tanzanian banks like Tanzania Housing Bank
(THB), Meridian Biao Bank, Greenland Bank, First Adili Bank and Trust Bank.
Because of the sensitivity and importance of the financial sector especially the
relationship between credit risk and performance, significant research efforts have
been directed towards the subject. A few examples of such researches include but not
limited to Magnifique (2011) in Rwanda; Li and Zou(2014) in Europe; Hosna et al.
(2009) in Sweden; Gizaw et al. (2015) in Ethiopia; Otieno (2013), Gakure et
al.(2012), Onuko et al. (2015), and Karugu and Ntoiti (2015) in Kenya; Abiola and
Olausi (2014), Ogboi and Onuafe (2013), and Kolapo, et al. (2012) in Nigeria; Lalon
(2015) in Bangladesh; Poudel (2012) in Nepal; Nyamutowa and Masunda (2013) in
Zimbabwe; Kodithuwakku (2015) in Sri Lanka; Singh (2014) in India and Oswari
(n.d) in Indonesia.
In Tanzania, a few studies have been done around the banking industry performance
See for example, Quin and Pastory (2012), Kaaya and Pastory (2013), Pastory and
Mutaju (2013), and Amin et al. (2014). Pastory and Mutaju (2013) studied the
influence of capital adequacy on asset quality position of banks in Tanzania. With a
panel data from 33 banks in the period of six years their study reported a relationship
between capital adequacy and asset quality implying that increase in nonperforming
loans would worsen capital ratio.
Qin and Pastory (2012) studied the commercial banks’ profitability position using
one-way ANOVA and concluded that there was no significant difference on the
profitability position of the banks reviewed. Abdallah et al. (2014) looked at the
inverse relationship of financial risk and performance in commercial banks in
Tanzania and after empirical analysis of data observed that financial risk and
performance have a significant influence on each other. However, it is only one study
by Kaaya and Pastory (2013) that focused solely on credit risk management. This
study picked data from only 11 out of 34 commercial banks and sampled data from
seven years only, from 2005 to 2011 and by using data regression model observed
that increase in credit risk tends to lower banks performance.
It is notable that despite the previous studies made in Tanzania in the financial sector,
there are a number of changes such as the use of new technology, new players, new
size of the market and the issuance of new regulations by BOT in 2014 that have
made the industry different from that one that was researched earlier. Therefore,
there is a glaring need to conduct a comprehensive study that will involve a larger
number of commercial banks over a much longer period and include most current
data in order to have current and conclusive results that can be relied upon by
stakeholder. It is against this background that this study was designed to retest the
effect of credit risk management indicators on banks’ financial performance in
Tanzania
1.2
Statement of the Research Problem
From the preceding background, credit risk has been shown to be behind the bank
related financial crisis. It is the most critical risk among the risks that banks face.
Research has shown that credit risk management is crucial for the effective
performance of banks. Thus, managers acting in the best interest of the shareholders
should manage the credit risk items in a minimizes the potential failures that are
associated with mismanagement of the underlying indicators. Researches have
focuses on identifying determinants of credit risk and how they affect performance of
banks. However, while most researches are done from the western economy, limited
research is done in developing countries like Tanzania. The few researches done on
banks in Tanzania, e.g. Quin and Pastory (2012), Kaaya and Pastory (2013), Pastory
and Mutaju (2013), and Abdallah et al. (2014) differ in a number of ways – some of
which include methodological differences and coverage. Several of them claim to
have used Panel data regression for example, but little evidence is there as to whether
that was actually done. The many changes in technology and regulations in Tanzania,
makes follow up studies important but also with time more and more banks open
operations and grow. This enables researchers to use bigger samples. Furthermore,
use of panel data is important to take into account both cross-sectional and time
differences in the data in estimation the effect of the credit risk variables on banks
performance. Therefore, the present study will fill this gaps by using a wider sample
and by using pooled regression analysis on the panel data.
1.3
Research Objectives
1.3.1 General Research Objectives
The purpose of this study was to determine the effect of credit risk management on
profitability of commercial banks in Tanzania.
1.3.2 Specific Research Objectives
(i)
To determine the relationship between non-performing loans (NPL) to total
liability (TL) ratio and commercial banks’ financial performance
(ii)
To determine the relationship between capital adequacy ratio (CAR) and
commercial banks’ financial performance.
(iii)
To determine the relationship between total loans to total deposits ratio and
commercial banks’ financial performance.
(iv)
To determine the relationship between loan loss provision to non-performing
loans ratio and commercial banks’ profitability performance
1.4
Research Questions
1.4.1 General Research Question
What is the effect of credit risk management and the financial performance of
commercial banks in Tanzania?
1.4.2 Specific Research Questions
(i)
What is the relationship between non-performing loans to total liability ratio
(NPL/TL) and financial performance of commercial banks in Tanzania?
(ii)
What is the relationship between capital adequacy ratio (CAR) and the
financial performance of commercial banks in Tanzania?
(iii)
What is the relationship between Loans to Deposits Ratio and financial
performance of commercial banks in Tanzania?
(iv)
What is the relationship between Provision for Non-Performing Loans and
financial performance of commercial banks in Tanzania?
1.5
Relevance of the Research
Findings from this research will have a significant impact on the whole Tanzania
banking industry and beyond. The findings of this research will give credit managers,
senior managers, board members and regulators bases for policy review and drawing
regulations that will help mitigate credit risk to manageable levels. When credit risk
is at manageable levels, banks will improve their profitability and investor will get
their return though dividends or increase in stock value.
1.6
Organization of the Dissertation
The next chapter presents a review of related literature regarding the link between
financial performance and credit risk management. Chapter three sets out the
research methodology. Chapter four presents and discussed the findings. Finally,
chapter five concludes the study and presents recommendations.
CHAPTER TWO
2.0 LITERATURE REVIEW
2.1
Overview
This chapter presents the outcome of a review of literature related to this study. The
chapter starts with a brief definition of key concepts, review of relevant theories and
empirical literature and later develop a framework and hypothesis for this study.
2.2
Conceptual Definitions
2.2.1 Financial Performance
Financial Performance of a bank is the ability of a bank to generate income.
Magnifique (2011) argues that the financial performance of banks is expressed in
terms of profitability and the profitability has no meaning except in the sense of an
increase of net asset. The best way to measure financial performance of a bank is
through ROE and/ or ROA. Hosna et al. (2009) suggests that ROE is the most widely
used indicator of profitability, along with ROA, in research. Computation of these
ratios is dealt with in chapter three.
(a)
Return on Equity (ROE)
ROE is a return on capital. This shows how much profit is made for each shilling
invested. ROE is commonly used to measure the profitability of banks. When the
capital invested is efficiently deployed the ROE becomes high, but when there is
inefficiency in putting the capital to work then the ROE becomes low. Foong (2008)
argues that if banks use capital more efficiently, they will have a better financial
leverage and consequently a higher ROE. Because a higher financial leverage
multiplier indicates that banks can leverage on a smaller base of stakeholder’s fund
and produce higher interest-bearing assets leading to the optimization of the
earnings. However, one may argue that the rise in ROE may be caused by a bank
using too much borrowing than capital and so increase debt risk
(b)
Return on Assets (ROA)
Return on assets (ROA) is an indicator of how profitable a company is relative to its
total assets. ROA gives an idea as to how efficient management is at using its assets
to generate earnings. Calculated by dividing a company's annual earnings by its total
assets, ROA is displayed as a percentage. According to Guru et. al, (1999, p.7),
ROA, which is the ratio of net income to total assets, measure how profitable and
efficient a bank' management is, based on the total assets.
2.2.2 Credit Risk
According to Basel II (2006), credit risk is the risk of loss due to an obligator's
non-payment of an obligation in terms of a loan or other lines of credit. Conford (2000) as
sited by Kithinji, (2010) defines credit risk as the possibility that the actual return on
an investment or loan extended will deviate from that, which was expected. Coyle
(2000) also defines credit risk as losses from the refusal or inability of credit
customers to pay what is owed in full and on time. Furthermore, Heffernan (1996)
defines credit risk as the risk that an asset or a loan becomes irrecoverable in the case
of outright default, or the risk of delay in the servicing of the loan. Bessis (2002)
opined that credit risk is critical since the default of a small number of important
customers can generate large losses, which can lead to insolvency. Anthony (1997)
asserts that credit risk arises from non-performance by a borrower, and this may arise
from either an inability or an unwillingness to perform in the pre-committed
contracted manner. Hosna et al (2009) argues that according to the Basel Accords,
risks the banks face include market risk, operational risk and credit risk. Basle II has
defined market risk as the risk of losses in on and off-balance sheet positions arising
from movements in market prices. The capital treatment for market risk addresses the
interest rate risk and equity risk pertaining to financial instruments, and the foreign
exchange risk in the trading and banking books.
Operational risk is defined as the risk of direct or indirect loss resulting from
inadequate or failed internal processes, people and systems or from external events.
Operational risk relates to the issues of precise processing, settling and taking
delivery on trades for the exchange of cash (Santomero, 1997, p. 89). Credit risk is
the risk of loss due to an obligator's non-payment of an obligation in terms of a loan
or other lines of credit. It is a risk that counterparties in loan transactions and
derivatives transactions might default, which means counterparties fail to repay the
principal and interest on a timely basis (Koch & MacDonald, 2000, p. 109).
2.2.3 Credit Risk Management
Credit risk management is a process whereby a bank employs various tools in order
to eliminate or minimize the probability of losing money by inadvertently lending to
a person with little ability to repay the loan on time or in full in whatever
circumstances they operate in. Credit risk is the biggest risk any bank faces as
compared to other risks like, interest rate risk, foreign exchange risk and liquidity
risk. It is therefore imperative that the bank puts in place a comprehensive process
that will make the lending process smooth while effective as far as risk mitigation is
concerned. According to Hosna et al (2009), credit risk can be divided into three
risks: default risk, exposure risk and recovery risk. Early (1996) and Coyle (2000)
defined credit risk management as involving identification, measurement, monitoring
and control of risk arising from the possibility of default in loan repayments.
For most banks, credit risk management starts at the point of first contact with the
potential borrowing customer. The loan officer has to listen to the customer
carefully, read the body language and ask critical questions in order to gain full
understanding of the business of the customer. Then a visit to the potential customer
is conducted while documents and data analysis follows. Security has to be perfected
before a loan is advanced. There after periodic follow up and business site visit
continues throughout the credit period. When this process is well adhered to, credit
risk will be minimised, but when there is pressure to grow the loan book, some of
these steps are overlooked and that is when the skyrocketing of the non-performing
loans is experienced. A good example is the USA financial crisis of 2007.
2.2.4 Credit Risk Management Indicators
According to Ara, Bakaeva and Sun (2009, p.13), as cited by Li & Zou (2014), the
Basel Accord links the minimum regulatory capital to the underlying risk exposure
of banks. It refers to the fact that the greater the risk a bank exposed to relates to the
higher amount of capital it needs. This regulation indicates the importance of capital
management in risk management. The compliance with the regulatory requirement
can be expressed as risk management indicators (Li & Zou, 2014). The Basel accord
puts in place some regulations that help to safeguard the deposits from the public by
linking the amount of credit portfolio with the amount of capital invested, the capital
adequacy ratio (CAR). CAR measures the amount of bank’s capital which is related
to the amount of is risk weighted credit exposure. However, CAR alone does not tell
the whole story. If one wants to know the credit risk status of a bank, he or she also
look at Non-Performing Loans Ratio (NPL/TL), Loans to Deposits Ratio (LD/TD)
and Loans Loss Provisions ratio (LLP/NPL). As for NPL/TL, it is relevant with
bank loans. Thus, it was considered reasonable to use CAR and NPL/TL in this
research, and further discussion for these two variables will be present in the
following sections (Li & Zou, 2014). Conclusively, the choice of CAR, TL/TD,
LLP/NPL and NPL/TL are based not only on their properties and frequency of
occurrences in previous studies but also their capability to bring out a more reliable
result. Although there could be many indicators for the credit risk management, this
study will focus mainly of the four; the CAR, TL/TD, LLP/NPL and the NPL/TL.
These for ratios are more comprehensive, direct and easy to interpret.
(a)
Capital Adequacy Ratio (CAR)
Capital adequacy ratio (CAR) is defined as the ratio of capital to the risk-weighted
sum of bank’s assets (Hyun & Rhee, 2011, p. 325). It measures the amount of a
bank’s capital relative to the amount of its risk weighted credit exposures (Reserve
Bank of New Zealand, 2007, p.1).The risk weighting process takes into account, in
stylized way, the relative riskiness of various types of credit exposures that banks
have, and incorporates the effect of off-balance sheet contracts on credit risk. The
higher the capital adequacy ratios a bank has, the greater the level of unexpected
losses it can absorb before becoming insolvent.(Reserve Bank of New Zealand,
2007, p. 9).The general belief is that banks with strong capital base would have the
ability to absorb losses that may arise from non-performing liabilities (Adegbaju &
Olokoyo, 2008).Minimum capital adequacy ratio has been developed to ensure banks
can absorb a reasonable level of losses before insolvency and before depositor funds
is lost (Reserve Bank of New Zealand, 2007, p.2). Applying minimum capital
adequacy ratio aims to protect depositors and promote the stability and efficiency of
the financial system (Reserve Bank of New Zealand, 2007, p.2).
(b)
Non-Performing Loans Ratio (NPL/TL)
According to the Bank of Tanzania’s management of risk assets regulation (2014),
non-performing credit accommodations shall include substandard, doubtful, and loss
categories and be classified by a bank or financial institution according to the criteria
prescribed in these Regulations. NPL/TL is the ratio of non-performing loans to total
loans (Yang, 2010, p.2019). The equation can be defined as NPL deflated by total
loans (TL). NPL/TL is a financial soundness indicator which demonstrates the
quality of bank loans (Park, 2012, p. 909). According to Yang, NPL/TL can
adversely influence the efficiency of risk management and investment (2010, p.
2019).
Commercial banks expose themselves to the risk of default from loan borrowers.
Quality credit risk assessment, risk management and creation of adequate provisions
for bad and doubtful debts can reduce the banks credit risk. Brewer et al. (2006)
regards non-performing loan ratio (NPL/TL) as a significant economic indicator. It
implies that lower NPL/TL is related with the lower risk and deposit rate. Li & Zou
(2014) further argues that that NPL is also a probability of loss which requires
provision. The amount of provision is “accounting amount” which can be further
subtracted from the profit. Thus, high NPL increases the provision while reduces the
profit.
(c)
Loans to Deposits Ratio (TL/TD)
TL/TD indicates the credit risk appetite of the bank that exposes it to probable losses.
It is measured as a ratio of total loans (TL) to the total amount of deposits (TD)
(d)
Loans Loss Provisions Ratio (LLP/NPL)
The LLP is the ratio of total loan provision (LLP) to the total non-performing loans
(NPL). The Bank of Tanzania Management of Risk Assets Regulation 2014 has
clearly stipulated provision percentages for various classes of nonperforming loans.
When a loan is especially mentioned provision will be 3%, Substandard (20%),
Doubtful (50%) and Loss is 100%.
2.3
Theoretical Linkages between Credit Risk Management Indicators of
Commercial Banks’ Profitability
2.3.1 Relationship between NPL/TL with ROE/ROA
Since the biggest contributor of banks’ income is the credit portfolio, any problem
with this asset will significantly impact the amount of profit of the bank. So, when
customers fail to honor their commitments to repay their loans, the bank will suspend
the interest from the bad loans and in that regard the bottom line will be directly
impacted. Therefore, the larger the NPL/TL ratio the lower the performance
(ROE/ROA).
2.3.2 Relationship between CAR with ROE/ROA
CAR is expected to affect performance of the bank positively. This is because when
the bank increases its capital, it gains the ability to service bigger single credits, it
increases its capacity to expand its credit portfolio and capital is a cheap source of
deposits that can be given out as a loan.
2.3.3 TL/TD Ratio Relationship with ROE/ROA
The higher the ratio the higher the performance, because deposits are expensive and
any deposit that remain unused costs the bank. Therefore, it is expected that TL/TD
ratio to positively affect ROE/ROA.
2.3.4 LLP/NPL Ratio with ROE/ROA
When a loan is provided for as lose in the books of a bank it hits directly on the
bottom line. In that regard the higher the LLP/NPL ratio the lower the performance
of the bank (ROE/ROA)
2.4
Empirical Literature Review
Many studies have been conducted in many countries around the world to assess how
credit risk can affect performance of banks. In these studies, various indicators have
been used to measure credit risk, but the widely used credit risk indicators are; Non-
Performing Loans to Total Loans ratio (NPL/TL), the Capital Adequacy ratio (CAR),
the Total Loans to Total Deposit ratio (TL/TD) and the Loan loss provision to
Non-Performing Loans ratio (LLP/NPL). Bank Performance has been measure using
either The Return on Equity ROE or the Return on Assets (ROA) or both. Most of
these studies used the regression analysis model to analyze the data.
Kolapo et al. (2012) did a study on credit risk and commercial bank’s performance in
Nigeria. The study used a panel data approach. The study used NPL/TL, LLP/NPL
and TL/TD ratios to determine the credit risk. On performance measurement the
study used ROA as the only indicator. The study found out that there was a negative
relationship between ROA and NPL/TL and LLP/NPL and a positive relationship
between ROA and TL/TD ratio.
Hosna et al. (2009) researched on the credit risk management and Profitability in
Commercial Banks in Sweden where they studied four major commercial banks.
Their study used ROE as the performance indicator and CAR and NPL/TL as credit
risk variables. They employed the regression analyses model. Their study showed
that NPL/TL ratio has a significant negative effect on profitability (ROE) while CAR
had an insignificant positive effect on ROE.
Li and Zou (2014) performed a study on the Impact of Credit Risk Management on
Profitability of Commercial Banks: A Study of Europe. The study involved 47
largest commercial banks in Europe and used ROE and ROA as performance
indicators and CAR and NPL/TL ratio as credit risk indicator. Using the panel data
regression analysis model their findings indicated presence of significant negative
relationship between NPL/TL ratio while CAR was insignificant. Gizaw et al. (2015)
studied the impact of credit risk on profitability performance of commercial banks in
Ethiopia. The study involved 8 commercial banks for the period of 12 years. The
study used both ROE and ROA as performance indicators and four credit risk
indicators; NPL/TL, CAR, TL/TD and LLP/NPL ratios. Findings of this study
showed that NPL/TL and CAR were significant and negative to ROE and ROA,
LLP/NPL was significant and positive to performance while TL/TD had insignificant
effect on performance. In 2010 Kithinji performed a study in Kenya on the credit risk
management and profitability of commercial banks in Kenya. In this study
performance indicator used was ROA and credit risk indicators were NPL/TL and
TL/TA ratios. The regression results indicated that there was no relationship between
profits, amount of credit and the level of nonperforming loans. Kodithuwakku (2015)
performed a study on the impact of credit risk management on performance of
commercial banks in Sri Lanka. The study used ROA as performance indicator while
it used LLP/NPL, NPL/TL, LLP/TA and LLP/NPL ratio. The result shows that
non-performing loans and provisions have an adverse impact on the profitability.
Kaaya and Pastory (2013) researched on credit risk and commercial banks in
Tanzania, using panel data analysis. The study used ROA and ROE as performance
indicators and LLP/TL, LLP/NPL, LLP/NPL and NPL/TL ratios as credit risk
indicators. The study concluded that the increase in credit risk tends to lower firm
performance; both indicators produced negative coefficients which tend to lower
profit level. From a few samples of studies reviewed above it is evident that best and
widely used indicators of banks performance are ROE and ROA and the most used
indicators of credit risk performance are NPL/TL, CAR, TL/TD and LLP/NPL ratios.
2.5
Policy Review
The primary purpose of banks is to take deposits and lend the funds to needy
customers. And since not all customers will manage to pay back the loan either on
time or in full, it is natural that this lending business is very risky. And since banks
play a very vital role in our economies any slip up in managing the financial sector
can cause very damaging effect to the economy. In the last three decades we have
witnessed financial system failures that sent tremor beyond country and continent
borders. The major one was the financial crises in the Latin America in the 1980s
which resulted into the Basel accord. Leaders of the world saw the need to have a
global standard to mitigate these far reaching risks. Basel Committee on Banking
Supervision (BCBS, 2013, p.2) reported that, And under the condition that Latin
American debt crisis had hit the economy heavily, the Basel Committee, backed by
the G10 Governors, “resolved to halt the erosion of capital standards in their banking
systems and to work towards greater convergence in the measurement of capital
adequacy. This resulted in a broad consensus on a weighted approach to the
measurement of risk, both on and off banks’ balance sheets”.
According to Patricia (1999, p. 1) as cited by Li & Zou (2014) the Basel I Accord has
two fundamental roles. The first one is the promotion of soundness and stability of
the international banking system by encouraging international banking organizations
to improve their capital positions. And the second one is to provide fairness for
competitions among banks. It was signed by all 12 members of Basel Committee and
paved the way for a significant increase in the resources banks devote to measure and
managing risks (Hull, 2012, p. 258). Basel I accord set a good base for risk
management; however, after its implementation it was observed that there were still
some gaps that needed fixing. Besides, there has been a rapid development towards
larger and more complex banking groups with broader operations, from a global
perspective (Lind, 2005, p. 23&24) as cited by Li & Zou (2014). That is when the
Basel committee came up with the Basel II Accord which focused on three pillars;
Minimum Capital Requirement, Supervisory Review and Market Discipline. Now we
have Basel III which was published in 2009 and there are six parts in
theregulations:1. Capital definition and requirements, 2. Capital conservation buffer,
3. Countercyclical buffer, 4. Leverage ratio, 5. Liquidity ratio, 6. Counterparty credit
risk (Hull, 2012). This evolution of the Basel Accord from Basel I to Basel III gives
a clear picture that credit risk management is of great importance to banks and to our
economy. All these efforts to introduce new regulations is to enhance level of credit
risk management. We have seen that before Basel I banks operated under very small
capitalization that lead to easy bankruptcy. Challenges are still there but hopefully
when all banks fully adopt the Basel III Accord, credit risks will be minimized to a
large extent.
According to the Bank of Tanzania (BOT)’s Banking and Financial Institutions
(Management of Risk Assets) Regulations, 2014, the Board of Directors of every
bank or financial institution shall ensure that appropriate credit risk management
policies are in place and are consistent with principles set forth in the Risk
Management Guidelines for Banks and Financial Institutions issued by BOT.
All banks are required to review their credit policies at least once every year in order
to incorporate current market developments. As a matter of policy, the loan portfolio
has to be reviewed in every quarter and each facility to be categorized as either;
current, especially mentioned, substandard, doubtful or loss. BOT recognizes
non-performing loans (NPL) as those loans in the category of substandard, doubtful and
loss.
2.6
Research Gap
From the empirical literature review we have noted that many studies have been
conducted around the world but only a few in Tanzania. So far only three studies
focused on the relation between credit risk and bank performance, these are Kaaya &
Pastory (2013), Abdallah et al. (2014) and Qin & Pastory (2012).
However, these studies used samples that were too small to truly produce findings
that reflect the picture of the whole industry. None of the studies used the four credit
risk indicators (CAR, LDR, LLP and NPLR). Also, the industry has been
experiencing a growth of about 20% per annum and so dynamics have changed since
a similar study was performed. This study will include most current data. It is also
good to note that new regulations were issued by BOT in 2014 and so there is a
change on how banks used to operate as far as credit risk management is concerned.
After reviewing the above studies that have been carried out in Tanzania I have come
to a conclusion that there is a big gap to fill and a new study is justified to be carried
out. And I am very confident that the result will be useful to all stakeholders who
will access it.
2.7 Conceptual framework
The theoretical framework used in our study can be illustrated in the following
research model:
Figure 2.1Research Model
ROA: Return on Assets, ROE: Return on Equity, CAR: Capital Adequacy Ratio, TL/TD: Total Loans to Total Deposits Ratio, LLP/NPL: Loan Loss Provisions to Performing Loans, NPL/TL: Non-performing Loans to Total Loans
2.8
Hypotheses
The following hypotheses were tested:
Hypothesis I:
There is a relationship between CAR, TL/TD, LLP/NPL and NPL/TL ratios and
ROE of commercial banks.
Hypothesis II:
There is a relationship between CAR, TL/TD, LLP/NPL and NPL/TL ratios and
ROA of commercial banks.
CHAPTER THREE
3.0 RESEARCH METHODOLOGY
3.1
Overview
This chapter presents the research methodology used in the study. It covers research
strategies, the population of companies involved, sample and sampling procedures,
variables and measurement procedures, methods of data collection and data
processing. The chapter ends with a section on data analysis models
3.2
Research Strategies
The study adopted the quantitative descriptive strategy with secondary data from
commercial banks in Tanzania. It uses panel data regressions specifically pooled
regression technique, to test for the effect of selected credit risk management
indicators on the banks’ financial performance measures such as Return on equity
and return on assets. It is deductive in nature because it uses some of the
hypothesized relationships between the selected credit risk management indicators
and the financial performance indicators.
3.3
Survey Population
According to BOT (2014), there are 34 licensed commercial banks in Tanzania.
These comprised the study’s population and efforts were made to collect audited
financial statements on them over the 11-year period. Availability of these sources
of data was the main sampling criteria.
3.4
Sampling Design and Procedures
Availability of audited financial statement was the main inclusion/exclusion criteria.
From the 34 licensed commercial banks and with great efforts, audited financial
statements were obtained from 25 commercial banks only. These 25 banks represent
over 90% of the total banking industry capital, 89% of total industry assets and 85%
of the total loan portfolio. Compilation of the required financial statement items
required for the computation of the credit risk management indicators lead to further
exclusion of 6 banks for they did not have such data consistently over the study
period 2005 to 2015. The final sample comprised therefore 19 commercial banks
with consistent data over the period and hence a balanced panel. This provided a
total of 209 observations.
3.5
Variables and their Measurement Procedures
3.5.1 Independent Variables
Data was collected for total loans (TL), total deposits (TD), total assets (TA), loan
loss provisions (LLP), non-performing loans (NPL), profit before interest and tax
(PBIT), profit after tax (PAT), Total equity (TE). Then the independent variable were
the selected credit risk management indicators. These included Total Loans to Total
Deposits (TL/TD) ratio, loan loss provisions to non-performing loans (LLP/NPL)
ratio, non-performing loans to total liabilities (NPL/TL) ratio and capital adequacy
ratio. The ratios were computed for each company for each year as follows:
Total Loans to Total Deposits (TL/TD) ratio, loan loss provisions to non-performing
loans (LLP/NPL) ratio, non-performing loans to total loans (NPL/TL) ratio and
capital adequacy ratio.
TD
TL
deposits
Total
loans
Total
TLTD
NPL
LLP
gLoans
Perfor
non
Total
provisons
loss
loan
Total
LLPNPL
min
TL
NPL
Loans
Total
loans
g
perfor
non
Total
NPLTL
min
TA
C
Assets
Total
capital
Total
CAR
3.5.2 Banks’ Financial Profitability
The primary goal of establishing a bank is to increase value of investors’ capital. The
value can only be increased if the bank is making profit. At the same time,
effectiveness of management’s strategy in operating in a risk area can be recognized
by the profitability of the bank. This study is trying to examine the profitability of
banks in relation to credit risk management. We all understand that most of the
profits made by banks come from credits. The dependent variables were return on
asset (ROA) and return on equity (ROE).
(a)
Return on Equity (ROE)
ROE seems to be the best measure of bank performance because many studies in this
area have used it. Gizaw, et al. (2015) used ROE when studying the impact of credit
risk on profitability performance of commercial banks in Ethiopia, Hosna, et al.
(2009) used ROE when researching on credit risk management and profitability in
commercial banks in Sweden, Li & Zou (2014) used ROE when studying the impact
of credit risk management on profitability of commercial banks in Europe, Abbas et
al. (2014) used ROE to measure performance when they were studying the credit risk
exposure and performance of banking sector in Pakistan. ROE has been used in so
many other studies around the world because of its proven reliability.
TE
PAT
Equity
Total
tax
after
profit
ROE
(b)
Return on Assets (ROA)
ROA is a reliable tool for measuring performance and it has been used in many
studies all over the world. Kolapo et al. (2012) used ROA as a measure of bank
performance in Nigeria and concluded that the effect of credit risk on bank
performance measured by the Return on Assets of banks is cross-sectional invariant.
Lalon (2015) used ROA in a regression analysis while studying the Credit Risk
Management (CRM) Practices in Commercial Banks of Bangladesh: “A Study on
Basic Bank Ltd.” and observed that when the amount of NPLR will increase, ROA
will decrease and vice versa. Many other researchers around the world have relied on
ROA to measure profitability of banks.
TA
PBIT
Assets
Total
tax
and
erest
before
profit
ROA
int
3.6
Methods of Data Collection
Commercial banks in Tanzania are required by law to publish and well as submit to
Bank of Tanzania their financial statements on quarterly basis. Just like any other
company they are also required to publish annual audited financial statements.
Audited financial statements of each commercial banks over the study period were
collected from various sources – BOT, Company websites and from the company’s
head offices. Documents needed to bear signatories of their respective board
members to be considered reliable. A spread sheet was created in Microsoft Excel
and the components required for the computation of the independent and dependent
variables were painstakingly extracted and entered into the spreadsheet. The ratios
were then computed. The resulting data sheet containing the relevant ratios was then
exported to STAT 13 for further analysis.
3.7
Data Processing and Analysis
The model adopted for this study is underpinned to the model of Kolapo et al. (2012,
Hosna et al. (2009), Kithinji (2010), Poundel (2012), which studied the effect of
credit risk and commercial bank performance. This study has adopted the same
analysis method by measuring profitability of banks by using both ROE and ROA
while these being the function of CAR, LDR, LLP and NPLR.
The model for this study functionally becomes;
t
CAR
TD
TL
NPL
LLP
TL
NPL
ROE
0
1/
2/
3/
4
(1) tCAR
TD
TL
NPL
LLP
TL
NPL
ROA
0
1/
2/
3/
4
(2)Descriptive statistics were used to describe the different ratios and BOT indicators
were used to benchmark such ratios. The models were run in Panel data econometric
formats in a number of stages. For each model, a pooled regression was estimated.
CHAPTER FOUR
4.0 FINDINGS AND DISCUSSIONS
4.1
Overview
This chapter presents and discusses the findings from the pooled regression analysis
about the impact of the four independent variables to the profitability of commercial
banks.
4.2
Sample Description
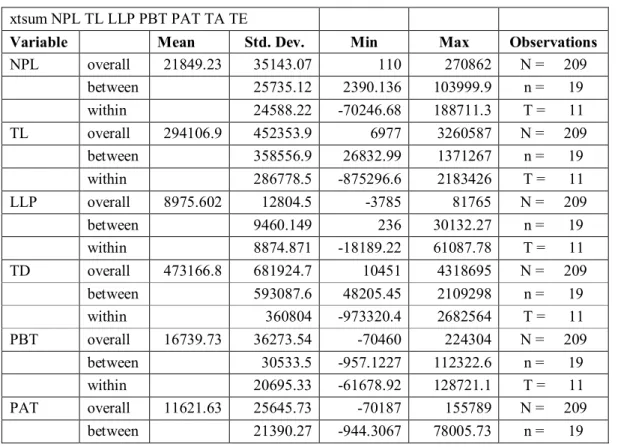
Tables 4.1 and 4.2 presents panel descriptive statistics. The overall quality of data is
shown as strongly balanced meaning for 11 years (2005 to 2015) all 19 banks were
able to provide data for every independent variable as required by the study. There
was no any missing data in any category for the whole period of study. For NPL/TL;
Results show that the mean is 9%, meaning that for 11 years under the study for all
19 banks 9% of the loan portfolio was categorized as not performing. It also shows
that across studied banks NPL/TL ratio varied between 1% and 20.5% while within a
single institution is varied between -4% and 25% in 11 years.
For the
LLP/NPL; it is now shown that 2.2% of all non-performing loans were
categorized as loss in the books of these banks. However, across the studied
population LLP/NPL ratio varied between -0.8% and 4% while in a within one
institution is varied from 1.8% and 8% during the period of study. For the TL/TD;
for the period under study it is being observed that 63.6% of deposits were given out
as loans. Results show that across the industry the TL/TD ratio varied between
42.9% to 122.9% while within an institution it varied between -16.8% to 225%
during the period under study. ROE results have shown that equity invested in these
19 banks understudy produced a return of 11.2% every year under the period of
study. However, across the industry ROE varied between -2.5% and 29% while
within one institution it varied between -56% and 46% during these 11 years under
study. From ROA; the table shows that during these 11 years assets of the 19 banks
were producing a return of 1.89% per annum. Across the industry ROA varied
between -0.3% and 5% while within institutions it varied between -6.8% and
5.8%.
CAR has a
mean capital adequacy ratio for the 19 banks under this study was
12.8%. However, across the industry the CAR varied between 7% and 34% while
within institutions it varied between -12% and 29%.
Table 4.1 Panel Descriptive Statistics Parameters
xtsum NPL TL LLP PBT PAT TA TE
Variable Mean Std. Dev. Min Max Observations
NPL overall 21849.23 35143.07 110 270862 N = 209 between 25735.12 2390.136 103999.9 n = 19 within 24588.22 -70246.68 188711.3 T = 11 TL overall 294106.9 452353.9 6977 3260587 N = 209 between 358556.9 26832.99 1371267 n = 19 within 286778.5 -875296.6 2183426 T = 11 LLP overall 8975.602 12804.5 -3785 81765 N = 209 between 9460.149 236 30132.27 n = 19 within 8874.871 -18189.22 61087.78 T = 11 TD overall 473166.8 681924.7 10451 4318695 N = 209 between 593087.6 48205.45 2109298 n = 19 within 360804 -973320.4 2682564 T = 11 PBT overall 16739.73 36273.54 -70460 224304 N = 209 between 30533.5 -957.1227 112322.6 n = 19 within 20695.33 -61678.92 128721.1 T = 11 PAT overall 11621.63 25645.73 -70187 155789 N = 209 between 21390.27 -944.3067 78005.73 n = 19
within 14904.95 -61804.37 89404.9 T = 11 TA overall 584887.2 837104.5 13492 5407816 N = 209 between 711166.7 55103.68 2476771 n = 19 within 468296 -1148954 3515933 T = 11 TE overall 72172.76 106785 -13464 687398 N = 209 between 83643.23 2929.682 289695.3 n = 19 within 68870.98 -156180.5 499560.4 T = 11
Table 4.2 Panel Descriptive Statistics Variables
xtsum NPLTL LLPNPL TLTD ROA ROE CAR
Variable Mean Std. Dev. Min Max Observations
NPLTL overall 0.0906305 0.0757485 0.0009572 0.361456 N = 209 between 0.0516846 0.0115876 0.2052605 n = 19 within 0.0565241 -0.0467825 0.250627 T = 11 LLPNPL overall 0.0219717 0.019123 -0.0300708 0.0905378 N = 209 between 0.0121181 0.00881 0.0425421 n = 19 within 0.01503 -0.0181569 0.0821233 T = 11 TLTD overall 0.6360013 0.2625915 0.1321921 2.848556 N = 209 between 0.1722975 0.429871 1.22973 n = 19 within 0.2017302 -0.1689799 2.254828 T = 11 ROA overall 0.0189151 0.0207685 -0.0769285 0.070086 N = 209 between 0.0153628 -0.0038473 0.0501993 n = 19 within 0.0143757 -0.0683619 0.0585231 T = 11 ROE overall 0.1124971 0.1453301 -0.63388 0.41699 N = 209 between 0.0940719 -0.0256532 0.2928447 n = 19 within 0.11268 -0.566324 0.4639462 T = 11
4.3
Findings
4.3.1 Return on Equity
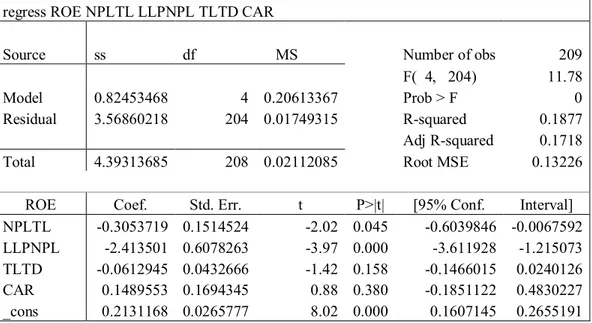
Table 4.3 present the results of pooled regression of return on equity on the credit
risk management indicators.
Table 4.3
Effect on ROE
regress ROE NPLTL LLPNPL TLTD CAR
Source ss df MS Number of obs 209
F( 4, 204) 11.78
Model 0.82453468 4 0.20613367 Prob > F 0
Residual 3.56860218 204 0.01749315 R-squared 0.1877
Adj R-squared 0.1718
Total 4.39313685 208 0.02112085 Root MSE 0.13226
ROE Coef. Std. Err. t P>|t| [95% Conf. Interval]
NPLTL -0.3053719 0.1514524 -2.02 0.045 -0.6039846 -0.0067592
LLPNPL -2.413501 0.6078263 -3.97 0.000 -3.611928 -1.215073
TLTD -0.0612945 0.0432666 -1.42 0.158 -0.1466015 0.0240126
CAR 0.1489553 0.1694345 0.88 0.380 -0.1851122 0.4830227
_cons 0.2131168 0.0265777 8.02 0.000 0.1607145 0.2655191
The overall results presented in Table 4.3 show that this regression analysis
considered 209 observations. The F-Statistics = 11.78
ρ< .001, indicating that the
model is significant, that is, it has power to predict the variation on ROE using the
four credit risk management indicators used. Also, the R-square confirms that
18.77% of the variation in ROE is explained by the four credit risk management
indicators.
Relationship between ROE and NPL/TL is statistically significant (ρ = .045)
meaning that any rise in NPL/TL ratio will lower the profitability of the bank.
Relationship between ROE and CAR is positive but insignificant. The Relationship
between ROE and TL/TD is negative but insignificant. However, relationship
between ROE and LLP/NPL is statistically significantly negative (ρ< .001), meaning
that any increase of the LLP/NPL ratio will cause a decrease in ROE.
4.3.2 Return on Asset
Table 4.4 present the results of pooled regression of return on assets on the credit risk
management indicators
Table 4.4 Effect on ROA
regress ROA NPLTL LLPNPL TLTD CAR
Source SS df MS Number of obs 209
F( 4, 204) 15.45
Model 0.020861339 4 0.005215335 Prob > F 0
Residual 0.068855578 204 0.000337527 R-squared 0.2325
Adj R-squared 0.2175
Total 0.089716917 208 0.000431331 Root MSE 0.01837
ROA Coef. Std. Err. t P>|t| [95% Conf. Interval]
NPLTL -0.0524844 0.0210376 -2.49 0.013 -0.0939635 -0.011005 4 LLPNPL -0.3622576 0.0844306 -4.29 0 -0.5287262 -0.195789 1 TLTD -0.0076613 0.00601 -1.27 0.204 -0.019511 0.004188 3 CAR 0.0936046 0.0235354 3.98 0 0.0472007 0.140008 6 _cons 0.0245211 0.0036918 6.64 0 0.0172421 0.0318