Tag Performance Parameters and Test Methods
Version 1.1.3
Approved by the EPCglobal Technical Steering Committee and EPCglobal Business Steering Committee
June 30, 2008
Copyright notice
© 2008, EPCglobal Inc.
All rights reserved. Unauthorized reproduction, modification, and/or use of this Document is not permitted. Re-quests for permission to reproduce should be addressed to [email protected]. EPCglobal Inc.TM is providing this document as a service to interested industries. This document was devel-oped through a consensus process of interested parties. Although efforts have been to assure that the docu-ment is correct, reliable, and technically accurate, EPCglobal Inc. makes NO WARRANTY, EXPRESS OR IMPLIED, THAT THIS DOCUMENT IS CORRECT, WILL NOT REQUIRE MODIFICATION AS EXPERIENCE AND TECHNOLOGICAL ADVANCES DICTATE, OR WILL BE SUITABLE FOR ANY PURPOSE OR WORKABLE IN ANY APPLICATION, OR OTHERWISE. Use of this Proposal Document is with the understand-ing that EPCglobal Inc. has no liability for any claim to the contrary, or for any damage or loss of any kind or na-ture.
Disclaimer
Whilst every effort has been made to ensure that this document and the information contained herein are cor-rect, EPCglobal and any other party involved in the creation of the document hereby state that the document is provided on an “as is” basis without warranty, either expressed or implied, including but not limited to any war-ranty that the use of the information herein will not infringe any rights, of accuracy or fitness for purpose, and hereby disclaim any liability, direct or indirect, for damages or loss relating to the use of the document.
Contents
VERSION 1.1.2... 1 Foreword ... 4 Introduction... 4 1.Scope ... 5 2.Normative references... 53.Terms and definitions ... 7
3.1 ADDITIONAL TERMS AND DEFINITIONS... 7
3.2 SYMBOLS ... 8 3.3 ABBREVIATED TERMS ... 8 3.4 NOTATION ... 9 4.Tag Parameters ... 10 ITEM ... 10 PARAMETER ... 10 5.Conditions... 11
5.1 NUMBER OF TAGS TO BE TESTED ... 11
5.2 TAG INITIALIZATION ... 11 5.3 TEST ENVIRONMENT ... 12 5.4 SIGNALLING... 12 5.4.1 WAVEFORM... 12 5.4.2 PROTOCOL... 12 5.4.3 FREQUENCY ... 12 5.4.4 TRIALS ... 13 5.5 RF ENVIRONMENT... 13 5.5.1 RF REFLECTIONS... 13
5.5.2 AMBIENT POWER LEVEL... 13
5.6 PRE-CONDITIONING... 13
5.7 DEFAULT TOLERANCE... 13
5.8 TOTAL MEASUREMENT UNCERTAINTY ... 13
5.9 TEST RESULT REPORTING ... 13
5.10 TEST MOUNTING MATERIAL... 14
6.Test Setup ... 14
6.1 FUNCTIONAL SETUP... 14
6.2 PHYSICAL SETUP... 15
6.3 LINK DEFINITIONS... 16
6.4 TEST SET REQUIREMENTS ... 18
REQUIREMENT ... 18
7.Calibration... 20
7.1 POWER DEFINITIONS... 20
7.2 TRANSMIT POWER CALIBRATION ... 21
7.3 RECEIVE POWER CALIBRATION ... 22
7.4 ANTENNA GAIN CALIBRATION... 22
8.Test Methods ... 23 8.1 READ RANGE... 23 8.1.1 PURPOSE ... 23 8.1.2 DESCRIPTION ... 23 8.1.3 PROCEDURE ... 24 8.1.4 REPORTING... 24 8.2 ORIENTATION TOLERANCE ... 24 8.2.1 PURPOSE ... 24 8.2.2 DESCRIPTION ... 24 8.2.3 PROCEDURE ... 26 8.2.4 REPORTING... 26 8.3 FREQUENCY TOLERANCE ... 27 8.3.1 PURPOSE ... 27 8.3.2 DESCRIPTION ... 27 8.3.3 PROCEDURE ... 27 8.3.4 REPORTING... 28 8.4 INTERFERENCE TOLERANCE... 28
8.4.1 PURPOSE ... 28 8.4.2 DESCRIPTION ... 28 8.4.3 PROCEDURE ... 29 8.4.4 REPORTING... 29 8.5 BACKSCATTER RANGE... 29 8.5.1 PURPOSE ... 29 8.5.2 DESCRIPTION ... 29 8.5.3 PROCEDURE ... 30 8.5.4 REPORTING... 30 8.6 WRITE RANGE ... 30 8.6.1 PURPOSE ... 30 8.6.2 DESCRIPTION ... 31 8.6.3 PROCEDURE ... 31 8.6.4 REPORTING... 31 8.7 WRITE TIME... 32 8.7.1 PURPOSE ... 32 8.7.2 DESCRIPTION ... 32 8.7.3 PROCEDURE ... 32 8.7.4 REPORTING... 33 8.8 TAG PROXIMITY... 33 8.8.1 PURPOSE ... 33 8.8.2 DESCRIPTION ... 33 8.8.3 PROCEDURE ... 33 8.8.4 REPORTING... 33 Revision History ... 35
Annex A – Conversion Factors... 36
Annex B – Orientation Tolerance Derivation... 37
Foreword
This document contains performance metrics and means for testing these metrics for a Class-1 radio-frequency identification (RFID) Tag compliant with the EPCglobal™ Class-1 Generation-2 UHF RFID Protocol for Communi-cations at 860 MHz – 960 MHz (the Protocol). This document is intended to serve the industry by providing a systematic means for evaluating Tags and ultimately optimizing performance in the field.
Introduction
The performance characteristics of Tag and Reader devices may vary drastically due to application factors as well as the particulars of the RF air interface (frequency, modulation, inventory algorithm, etc.). Of key concern is the matching of the various performance characteristics to the user application. Additionally, in an open environment users of RFID technology demand multiple sources for these devices from technology providers. A key challenge is a method of evaluating the differences between various technology providers' products in a consistent and eq-uitable manner.
This document specifies the Tag performance metrics and procedures for measuring them. Tags are passive-backscatter devices and operate within an Interrogator-talks-first, radio-frequency identification (RFID) system operating in the 860 MHz – 960 MHz frequency range. The system comprises Readers, also known as Interroga-tors, and Tags, also known as Labels. The active component of a Tag is the Tag Integrated Circuit (IC) which de-termines all of the functional properties of the Tag as well as many of its performance parameters.
A Reader transmits information to a Tag by modulating an RF signal in the 860 MHz – 960 MHz frequency range. The Tag receives both information and operating energy from this RF signal. Tags are passive, meaning that they receive all of their operating energy from the Interrogator’s RF waveform.
A Reader receives information from a Tag by transmitting a continuous-wave (CW) RF signal to the Tag and the Tag responds by modulating the reflection coefficient of its antenna, thereby backscattering an information signal to the Reader. The system is Interrogator-Talks-First, meaning that a Tag modulates its antenna reflection coeffi-cient with an information signal only after being directed to do so by the Reader.
Readers and Tags are not required to talk simultaneously; rather, communications are half-duplex, meaning that Readers talk and Tags listen, or vice versa.
Various air interface modulation and coding schemes are permitted by the Protocol. The Reader-to-Tag link is called the forward link and the Tag-to-Reader link is called the reverse link. The Reader selects the modulation and coding schemes for both links.
1. Scope
This document specifies a common set of Tag parameters that can be used to evaluate and compare Tags from multiple vendors and across product lines within a vendor. These parameters are listed in Table 4-1. Tag parame-ters fall in three categories:
1. Descriptive parameters that describe Tag features. Examples are manufacturer, model number, and size. 2. Operational limitation parameters that indicate extreme operational ratings. Examples are maximum RF
input power, operating temperature range, and Electrostatic Discharge (ESD) level.
3. Performance metrics that contribute to the system performance in the field. Examples are read and write range, orientation sensitivity, and tolerance to RF interference.
Capabilities for each of the Tag parameter categories are discerned separately. Means for collecting capabilities are respectively:
1. Tag vendor provides list of standard features.
2. Tag or IC vendor tests and/or analyzes operational limitations using techniques commonly adopted in the industry and provides values.
3. Testing laboratory tests performance metrics using the methods specified in this document.
Methods for testing performance metrics are defined in this document to the level necessary to provide repeatable results from independent test laboratories. The set of performance parameters chosen is not exhaustive but represents the primary parameters that influence fielded system performance.
Performance parameters are expressed in terms of a common and limited set of units. These units are distance, percent and duration. Standardizing on these units provides an intuitive link to physical properties that we all un-derstand. For those interested in translations to power levels and field strengths, Annex A provides the conversion expressions.
It is not the intent of this document to dictate specific test equipment or a test environment. Instead, test system requirements are provided that, if satisfied, assure accurate measurement results. Test system requirements in-clude test equipment accuracies, physical dimensions of the test setup, RF environmental requirements, and cali-bration procedures.
This document also specifies reporting guidelines where test conditions and results are listed. A summary of the test reports from all tests form a standardized Tag datasheet (see Table 4-1).
This document does not specify parameters or methods used to test regulatory parameters such as spurious emissions or transmit power. It is assumed that these parameters are addressed by appropriate regulatory certifi-cation testing.
This document does not specify detailed physical layer parameters (timing, wave shapes, etc.) or Protocol func-tional parameters (state diagram, command responses, etc.). These parameters are addressed by the EPCglobal conformance and interoperability test programs.
2. Normative references
The following referenced documents are indispensable to the application of this document. For dated references, only the edition cited applies. For undated references, the latest edition (including any amendments) applies.
EPCglobal™: EPC™ Radio-Frequency Identity Protocols, Class-1 Generation-2 UHF RFID, Protocol for Commu-nications at 860 MHz – 960 MHz, Version 1.1.0
EPCglobal™: EPC™ Tag Data Standards
EPCglobal™ (2004): FMCG RFID Physical Requirements Document (draft)
EPCglobal™ (2004): Class-1 Generation-2 UHF RFID Implementation Reference (draft)
and Radio spectrum Matters (ERM); Short Range Devices (SRD); Radio equipment to be used in the 25 MHz to 1000 MHz frequency range with power levels ranging up to 500 mW
European Telecommunications Standards Institute (ETSI), EN 302 208: Electromagnetic compatibility and radio spectrum matters (ERM) – Radio-frequency identification equipment operating in the band 865 MHz to 868 MHz with power levels up to 2 W, Part 1 – Technical characteristics and test methods
European Telecommunications Standards Institute (ETSI), EN 302 208: Electromagnetic compatibility and radio spectrum matters (ERM) – Radio-frequency identification equipment operating in the band 865 MHz to 868 MHz with power levels up to 2 W, Part 2 – Harmonized EN under article 3.2 of the R&TTE directive
ISO/IEC Directives, Part 2: Rules for the structure and drafting of International Standards
ISO/IEC 3309: Information technology – Telecommunications and information exchange between systems –
High-level data link control (HDLC) procedures – Frame structure
ISO/IEC 15961: Information technology, Automatic identification and data capture – Radio frequency identification (RFID) for item management – Data protocol: application interface
ISO/IEC 15962: Information technology, Automatic identification and data capture techniques – Radio frequency identification (RFID) for item management – Data protocol: data encoding rules and logical memory functions
ISO/IEC 15963: Information technology — Radio frequency identification for item management — Unique identifi-cation for RF tags.
ISO/IEC 18000-1: Information technology — Radio frequency identification for item management — Part 1: Ref-erence architecture and definition of parameters to be standardized
ISO/IEC 18000-6, Information technology — Radio-frequency identification for item management — Part 6: Pa-rameters for air interface communications at 860 MHz to 960 MHz
ISO/IEC TR 18046-3, Information technology — Radio frequency identification device performance test methods — Part 3: Test methods for tag performance
ISO/IEC TR 18047-6, Information technology — Automatic identification and data capture techniques — RFID device conformance test methods — Part 6: Test methods for air interface communications at 860 - 960 MHz
ISO/IEC 19762: Information technology AIDC techniques – Harmonized vocabulary – Part 3: radio-frequency identification (RFID)
ISO Guide to the Expression of Uncertainty in Measurement, ISBN 92-67-10188-9, 1993
U.S. Code of Federal Regulations (CFR), Title 47, Chapter I, Part 15: Radio-frequency devices, U.S. Federal Communications Commission
3. Terms and definitions
The principal terms and definitions used in this document are described in the Protocol and in ISO/IEC 19762. The principal symbols and abbreviated terms used in this document are detailed in
• ISO/IEC 19762: Information technology AIDC techniques – vocabulary.
• EPCglobal™: EPC™ Radio-Frequency Identity Protocols, Class-1 Generation-2 UHF RFID, Protocol for Communications at 860 MHz – 960 MHz, Version 1.1.0.
Symbols, abbreviated terms, notation, and additional terms specific to this document are as follows:
3.1 Additional terms and definitions
Terms and definitions specific to this document that supersede any normative references are as follows:
Backscatter
The means by which a Tag communicates with a Reader. The Tag modulates the reverse link waveform by changing its impedance, thereby modifying the amplitude or phase of the reflected signal.
Baseband
Term used to describe the backscatter signal after the RF carrier has been frequency translated to DC in the re-ceiver.
BLF
Backscatter Link Frequency. The subcarrier frequency of the Tag backscatter. A Miller subcarrier s used for per-formance testing to minimize the impact of the transmitted carrier at the receiver.
Compliance
Suitability of products, processes, or services, for use together, under specified conditions, without causing unac-ceptable interactions, in fulfillment of the requirements of a protocol.
dBil
Decibel units for antenna gain. The gain relative to an isotropic radiator as measured by a linearly polarized measuring antenna. The more standard unit for antenna gain, dBi, does not convey the polarity of the measuring antenna. For instance, the gain of a perfect circularly polarized antenna may be 9 dBi when measured by a matched circularly polarized measuring antenna and 6 dBil as measured by a linearly polarized measurement antenna.
Dense reader PR-ASK
Dense reader PR-ASK is the term used for a particular set of forward link signaling parameters characteristic of dense reader operation in the field. The specific dense reader PR-ASK signaling parameters are enumerated in section 5.4. Dense reader PR_ASK is the favored forward link signaling used for Tag performance testing.
EIRP
Effective Isotropic Radiated Power. The amount of power that would have to be emitted by an isotropic antenna to produce the power density observed in the direction of maximum antenna gain. EIRP is a measure of the signal strength in a particular direction leaving a transmitter.
Forward link
Signaling from the Reader to the Tag.
I, Q
In-phase and Quadrature-phase digital samples collected at the output of the receiver shown in Figure 6-2.
IC
Integrated Circuit. IC typically refers to the chip used in the Tag. The IC determines all of the operational capabili-ties of the Tag and is a major contributor to Tag performance.
ITF
Interrogator Talks First. Protocol used in Gen 2 where the Interrogator (Reader) wakes up the Tag and controls many aspects of the Tag communications.
Mega-sample per second. The rate at which the receiver samples the baseband backscatter signal. For example, 1 Msps means that the signal is converted to one million I digital words and one million Q digital words per sec-ond.
Reverse link
Signaling from the Tag to the Reader.
RIP
Received Isotropic Power. The power measured at the output of a 0 dBi gain receive antenna. RIP is a measure of the signal strength at a point in space, typically the input to a receive antenna.
Word
A 16-bit row in EPC memory as described in the Protocol.
3.2 Symbols
Symbols specific to this document that supersede any normative references are as follows:
BLF Backscatter link frequency (kHz)
DR Divide ratio
EIRPTx Effective isotropic radiated power from transmitter (dBm)
EIRPTUT Effective isotropic radiated power from Tag under test (dBm)
GRx Receiver electronics gain (dBV)
GRxA Receive antenna gain – linear (dBil)
GTxA Transmit antenna gain – linear (dBil)
h Height of Tag under test from floor (meters)
PRx Received power at output of receive antenna (dBm)
PTx Transmit power at input to transmit antenna (dBm)
Q Slot-count parameter used in Query command r Range to Tag under test from test antennas (meters) RIPRx Received isotropic radiated power at receiver (dBm)
RIPTUT Received isotropic radiated power at Tag (dBm)
xxxx2 binary notation
xxxxh hexadecimal notation
θ Angle between transmit and receive antennas (degrees)
3.3 Abbreviated terms
Terms and definitions specific to this document that supersede any normative references are as follows:
AUT Antenna under test
CRC Cyclic redundancy check
CW Continuous wave
EIRP Effective isotropic radiated power
EPC Electronic product code
ETSI European Telecommunications Standards Institute
FCC Federal Communications Commission
IC Integrated circuit
ITF Interrogator talks first (reader talks first)
PIE Pulse-interval encoding
PL Path loss
PSK Phase shift keying or phase shift keyed
RIP Received isotropic power
RN16 16-bit random or pseudo-random number
RF Radio frequency
RFID Radio-frequency identification
TID Tag-identification or Tag identifier, depending on context
TUT Tag under test
3.4 Notation
This document uses the following notational conventions:
• States and flags are denoted in bold. Example: ready.
• Commands are denoted in italics. Variables are also denoted in italics. Where there might be confusion between commands and variables, this specification will make an explicit statement. Example: Query.
• Command parameters are underlined. Example: Pointer.
4. Tag Parameters
All testing of category 3 parameters shall be performed according the procedures in section 8 and under the con-ditions specified in section 5, unless specified otherwise.
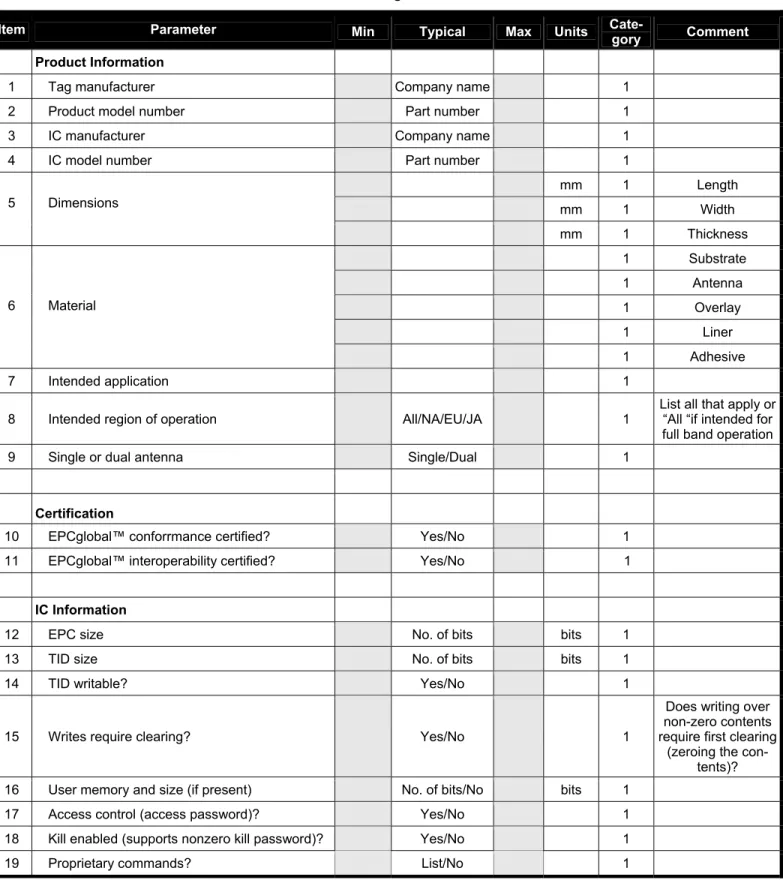
Table 4-1 – Tag datasheet
Item Parameter Min Typical Max Units
Cate-gory Comment
Product Information
1 Tag manufacturer Company name 1
2 Product model number Part number 1
3 IC manufacturer Company name 1
4 IC model number Part number 1
mm 1 Length mm 1 Width 5 Dimensions mm 1 Thickness 1 Substrate 1 Antenna 1 Overlay 1 Liner 6 Material 1 Adhesive 7 Intended application 1
8 Intended region of operation All/NA/EU/JA 1 List all that apply or “All “if intended for
full band operation
9 Single or dual antenna Single/Dual 1
Certification
10 EPCglobal™ conforrmance certified? Yes/No 1
11 EPCglobal™ interoperability certified? Yes/No 1
IC Information
12 EPC size No. of bits bits 1
13 TID size No. of bits bits 1
14 TID writable? Yes/No 1
15 Writes require clearing? Yes/No 1
Does writing over non-zero contents require first clearing
(zeroing the con-tents)?
16 User memory and size (if present) No. of bits/No bits 1
17 Access control (access password)? Yes/No 1
18 Kill enabled (supports nonzero kill password)? Yes/No 1
Cate-Item Parameter Min Typical Max Units gory Comment
20 Custom commands? List/No 1
21 Error-code support (error-specific codes)? Yes/No 1
22 Memory retention and endurance 2 Data retention dura-tion vs. number of
write/read cycles Performance
23 Read range meters 3
24 Orientation tolerance % 3
25 Frequency tolerance % 3
% 3 500 kHz offset
26 Interference tolerance
% 3 1.2 MHz offset
27 Backscatter range meters 3
28 Write range meters 3
ms 3 Zero initialized
29 Write time
ms 3 Non-zero initialized
30 Tag proximity cm 3
Operating limits
31 Maximum RF input power dBm 2
32 Operating temperature ºC 2
33 Storage temperature ºC 2
34 ESD tolerance kV 2 Human body model
Qualification information
35 Temperature Humidity Bias (THB) hours 2
36 Bending resistance bends 2
37 Temperature cycles cycles 2
5. Conditions
5.1 Number of tags to be tested
Unless otherwise specified, testing shall be performed on 30 randomly chosen tags among a population of 1000 functional samples. The reported performance shall be the 90% statistic, that is, the performance level attained by the best 27 of the 30 samples.
5.2 Tag initialization
All Tags tested shall be initialized with an EPC of 3034125BB024C34123456789. EPC memory shall be unlocked and the access and kill passwords, if supported, shall be zero.
5.3 Test environment
Unless otherwise specified, testing shall take place in a 1 atmosphere air environment of temperature 23° C +/- 5° C (73° F +/- 9° F) and of relative humidity 20 % to 75 %.
5.4 Signalling
5.4.1 Waveform
Tests requiring forward link commands shall use dense reader PR-ASK signaling, unless otherwise specified. Dense reader PR-ASK is defined as a 25 µs Tari, 2:1 PIE, 64/3 DR, extended preamble, M=4 Miller subcarrier, 256 kHz BLF, and a rise and fall time of 7.75 ± 0.5 µs.
5.4.2 Protocol
The Reader shall transmit Query commands with the following binary arguments when inventorying a Tag.
DR 1 : 64/3
M 10 : 4
TRext 1 : Extended preamble
Sel 01 : All
Session 01 : S1
Target 0 : A->B
Q 0000 : 0
The Test Reader shall ACK all RN16 responses and verify an EPC for bit errors (value matches expectation) and CRC errors. Both an RN16 and correct EPC are necessary in order to declare a successful read.
The transmitter shall remain at a fixed frequency sending a repeating Query/ACK command sequence making A-to-B attempts. If an EPC is returned by the TUT, the transmitter shall wait at least 200 µsec prior to issuing the next Query command. The transmitter has the option to continuously transmit a CW or power cycle during the wait period between EPC and the next Query.
Writing shall be attempted through the secured state following a successful inventory. The same iterative inven-tory approach described for reading shall be used. An access password is not required because it is set to zero in the TUT. The Write command shall be used to write a single word to location 20 hex in the EPC memory bank. If the memory is initialized with a non-zero value and the tag vendor specifies that the memory requires zeroing (clearing) prior to a write attempt, then the cumulative time to clear the memory and write a new non-zero value is reported (Non-zero initialized entry in Table 4-1).
All interactions between the test set and TUT shall adhere to the timing requirements in the Gen 2 protocol speci-fication with the exception of for the wait period between returned EPC and the next Query command, which is inserted to prevent the TUT session flag from transitioning to the B state.
5.4.3 Frequency
Some Tags are designed to be operated over the worldwide 860 – 960 MHz frequency band while others are op-timized for regional performance. The majority of tests described in this document are performed at a fixed fre-quency. The default test frequency shall be the center of the intended regional operating band. If multiple bands or worldwide operation are declared by the vendor, the default frequency shall be at the center of the North American band. The center frequency for a region is determined by adding the maximum and minimum high power band limits (band edges not channel edges or centers) and dividing by two. Center frequencies for Europe, North America and Japan are 866.6, 915, and 953 MHz respectively based on high power band edge pairs of (865.6, 867.6), (902, 928) and (952, 954).
5.4.4 Trials
A number of tests require the operator to vary the transmitter power until a 50% success rate is achieved. A sta-tistical confidence of 95% that a candidate power level is too high or low occurs when 4 successive successes or failures are measured, respectively. If one or two contrary results occur, then 6 and 8 trials are respectively re-quired to achieve a 95% confidence level.
A minimum of 4, 6, or 8 trials shall be made at each power level when the number of contrary results are 0, 1, or 2. If more than 2 contrary results occur, then at least 9 trials shall be made and the verdict shall be determined by a majority vote of the outcomes.
5.5 RF environment
The tests shall be performed in a controlled RF environment. A test range, anechoic chamber or other, achieving the following RF conditions is required.
5.5.1 RF reflections
The ceiling and walls of the test range shall provide a minimum reflection isolation of 30 dB at 1 GHz. The reflec-tion isolareflec-tion from the floor shall be at least 10 dB at 1 GHz. RF absorbing material is typically required to achieve the specified reflection isolation.
Personnel shall be at least two meters away from the transmitter, receiver, and TUT and not downstream from the transmitter during testing. If personnel are isolated by an RF barrier, these standoff requirements do not apply.
5.5.2 Ambient power level
The test range shall be adequately isolated such that stray RF power measured in a 10 kHz bandwidth is less than -60 dBm over the 0.5 to 2 GHz band with the exception of the TUT backscatter bands where the requirement is -90 dBm in the same measurement bandwidth. The TUT backscatter bands are 64 kHz bands centered at ± 256 kHz offset from the center frequency specified in 5.4.3 and about the center frequencies specified in 8.3. Measurements shall be made at the position of the receive antenna over a one hour period under a peak hold condition.
Conductive shielding surrounding the test range is typically required to attenuate stray RF signals to the specified levels. Aluminum foil bonded to insulating foam, or sheet aluminum are examples of shielding materials.
5.6 Pre-conditioning
Tags to be tested shall be conditioned to the test environment for a period of 24 hours before testing.
5.7 Default tolerance
Unless otherwise specified, a default tolerance of +/- 5 % shall be applied to the test equipment requirements (e.g. linear dimensions) and the test method procedures (e.g. test equipment adjustments).
5.8 Total measurement uncertainty
The total measurement uncertainty for each quantity determined by these test methods shall be stated in the test report.
Basic information is given in “ISO Guide to the Expression of Uncertainty in Measurement“, ISBN 92-67-10188-9, 1993.
5.9 Test result reporting
Two levels of reporting of test results shall be supported. A summary report shall be produced that lists data in format of the Tag datasheet (Table 4-1). A more comprehensive report shall be produced that includes the data specified in the Reporting section for each parameter listed in section 8. Category 2 data will be provided at the discretion of the Tag or IC vendor.
Summary report data shall be entered at a resolution of one digit to the right of the decimal point in the units listed in the Table 4-1. For example, 8.7 meters or 56.2%.
5.10 Test mounting material
All Tags shall be mounted on an RF-inert, styrene foam block tailored to the approximate dimensions of the Tag. Results collected under these conditions are commonly referred to as free air performance.
The Tag manufacturer may wish to test Tags that are designed to perform well on other materials. In such cases the Tag shall likewise be affixed to a surface of the subject material tailored to the Tag dimensions. A description of the mounting details, such as if a spacer is used; the thickness of the spacer, etc. shall be documented in the test report. If the dielectric parameters or other critical aspects of the material are known they should also be documented. Results collected under these conditions are commonly referred to as applied performance.
6. Test Setup
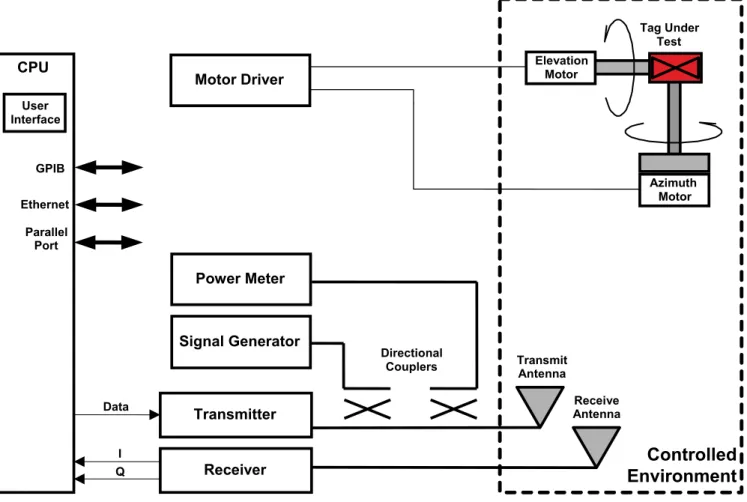
6.1 Functional Setup
A functional block diagram of Tag performance test setup is shown in Figure 6-1. RF transmissions are contained within a controlled environment meeting the shielding and reflection requirements of section 5.4.3.
Transmit source data is generated in the CPU and transferred to the transmitter electronics where it is encoded into an RFID signal. The signal generator provides an interference signal that can be optionally added to the ward link signal through a directional coupler. A second directional coupler routes a portion of the composite for-ward link to a power meter so that non-invasive transmit power readings are possible. The forfor-ward link signal is radiated toward the Tag through the transmit antenna. The transmitter and antennas shall meet the requirements specified in Table 6-1.
The Tag is mounted to a firm backing that is attached to a rotating mast constructed of RF-reflective and non-RF-conductive material. The relative dielectric constant of the mast material shall be less than 6.0.
The default orientation of the TUT on the mast shall be as specified in 6.2. The mast can be independently rotated via computer control in azimuth (left to right from the vantage point of the transmit antenna) or in elevation (up and down from the same vantage point). The azimuth and elevation rotational axes are vertical and horizontal, respec-tively, and intersect at the center of the TUT.
The Tag backscatter (reverse link) signal is collected by the receive antenna and passes into the receiver. The receiver shall be a Quadrature Demodulator Receiver as shown in Figure 6-2 meeting the requirements of Table 6-1. The reverse link signal is RF filtered, downconverted, baseband filtered, and sampled in the receiver. Down-conversion to baseband is by direct Down-conversion in the example, but a heterodyne or other traditional Down-conversion chain are acceptable. The final downconversion to baseband is accomplished by splitting a local oscillator (LO) signal through a 90 degree hybrid. Receiver output I and Q samples are passed to the CPU for post-processing. The CPU controls test flow, configures the hardware, and processes and stores data. In the case where a forward link command structure depends on an immediately preceding Tag response, the CPU must be fast enough to create the command within the Gen 2 timing limits. An example is generating the RN16 that must be inserted into the ACK command sent to the Tag to elicit its EPC. A fast processor or FPGA may be necessary to complete such real-time operations.
A user interface that accommodates creating, editing, and selecting test cases shall be provided. A data storage capability shall exist as well as software to generate the reports specified in section 8.
Neither specific test equipment nor a commercial reader is specified for use in the test set. Any complement of hardware and software that meets the requirements of this section may be used to test Tags.
Tag Under Test
Figure 6-1 - Test set functional block diagram
RF in-phase splitter 0 90 LO Quadrature Demodulator Receiver RF Amplifier I/Q LPF I/Q ADC I Q I/Q Amplifiers RF Bandpass Filter Frequency Source RF in
Figure 6-2 - Quadrature demodulator receiver architecture
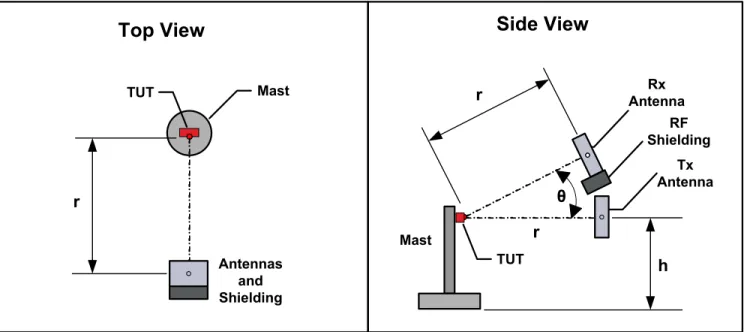
6.2 Physical Setup
Top and side views of the physical test setup are shown in Figure 6-3. Transmit and receive antennas are stacked (example shown) or placed side-by-side and positioned at equal distances from the Tag Under Test (TUT). The range to the Tag, height of the Tag, and the angle between transmit and receive mechanical boresights are con-strained by the requirements in Table 6-1. Optional RF shielding between the antennas is shown under the
as-Transmit Antenna CPU GPIB Parallel Port Elevation Motor Receiver Azimuth Motor Motor Driver User Interface Ethernet Transmitter Signal Generator Power Meter Directional Couplers Receive
Controlled
Environment
Antenna I Q Datasumption that it is necessary to achieve the isolation requirement. Separate transmit and receive antennas (bi-static configuration) are dictated based on the need to optimally align polarizations for accurate backscatter power measurements.
The Tag shall be oriented on the mast such that its longest dimension is horizontal. If the Tag is two-axis symmet-ric (e.g. square), then its default orientation should be as specified by the tag vendor.
The Tx and Rx antennas are rotated such that their major axial ratio axes are horizontal. See 7.4 for calibration details. Mast TUT Tx Antenna Rx Antenna RF Shielding r θ r r h Antennas and Shielding TUT
Top View
Side View
Mast
Figure 6-3 - Test set physical block diagram
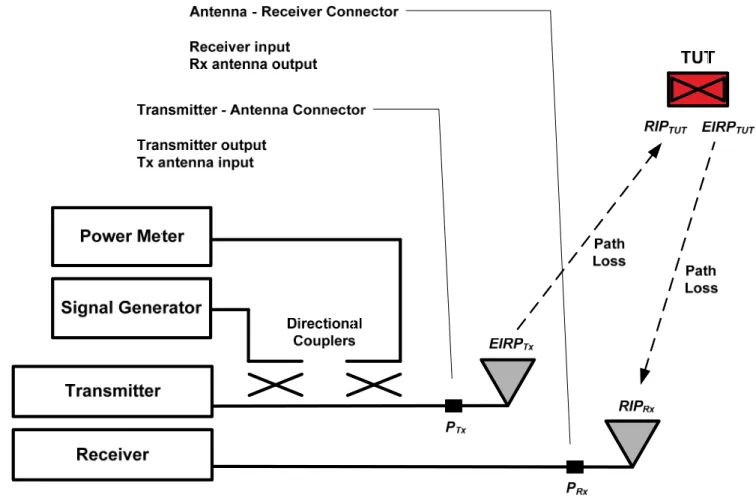
6.3 Link Definitions
Several important link parameters are defined in this section that provides the framework for properly setting and measuring power levels. The transmitter and receiver interfaces to the antennas are defined as the connection points between electronics and antenna cables (see PTx and PRx locations in Figure 6-4). “Receiver input” and “Rx
antenna output” are synonymous terms as are “transmitter output” and the “Tx antenna input”. Powers measured at these interfaces are defined as PTx and PRx. Received powers, in the air, at the antenna location, are defined in
terms of Received Isotropic Power (RIP). This is the power that would be collected by a unity gain antenna at the same location. Transmitted power, in the air, at the transmitting antenna is defined in terms of Effective Radiated Isotropic Power (EIRP). This is the power calculated to be present at the transmitting antenna when power is measured at boresight by a far-field, unity gain receiving antenna. The free space loss establishes the relationship between EIRP and RIP, that is, RIP = EIRP – PL where PL is the free space path loss and all terms are in decibel units.
6.4 Test Set Requirements
Table 6-1 lists key test set parameters and requirements. Meeting these requirements assures that a test set will be capable of generating the requisite test signals and accurately measuring the Tag performance. All require-ments apply over the UHF RFID band from 860 to 960 MHz unless stated otherwise.
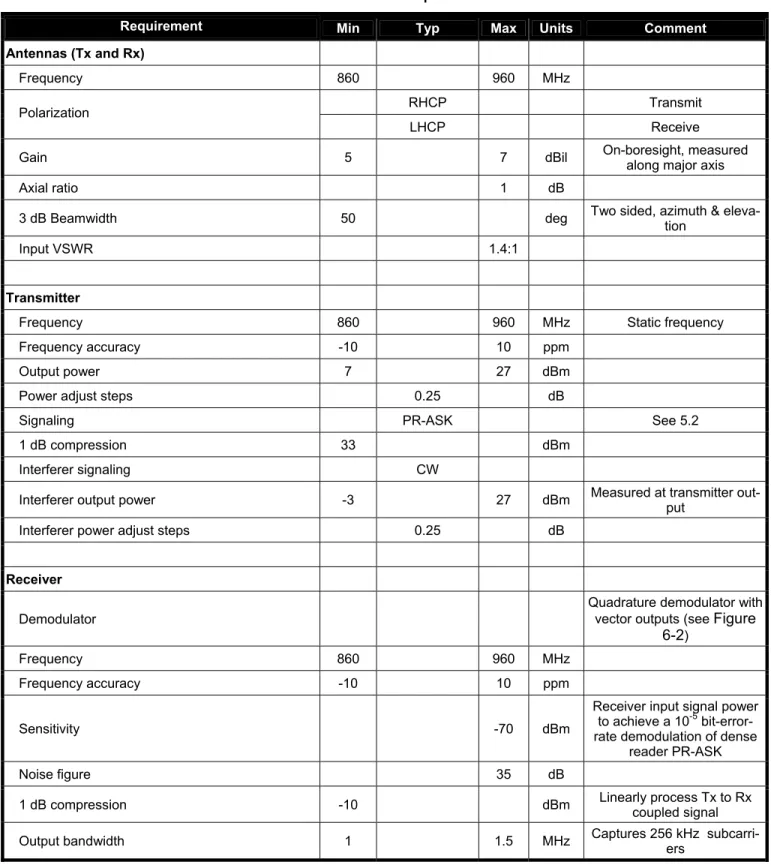
Table 6-1 – Test set requirements
Requirement Min Typ Max Units Comment
Antennas (Tx and Rx)
Frequency 860 960 MHz
RHCP Transmit
Polarization
LHCP Receive
Gain 5 7 dBil On-boresight, measured along major axis
Axial ratio 1 dB
3 dB Beamwidth 50 deg Two sided, azimuth & eleva-tion
Input VSWR 1.4:1
Transmitter
Frequency 860 960 MHz Static frequency
Frequency accuracy -10 10 ppm
Output power 7 27 dBm
Power adjust steps 0.25 dB
Signaling PR-ASK See 5.2
1 dB compression 33 dBm
Interferer signaling CW
Interferer output power -3 27 dBm Measured at transmitter out-put
Interferer power adjust steps 0.25 dB
Receiver Demodulator
Quadrature demodulator with
vector outputs (see Figure
6-2)
Frequency 860 960 MHz
Frequency accuracy -10 10 ppm
Sensitivity -70 dBm
Receiver input signal power
to achieve a 10-5
bit-error-rate demodulation of dense reader PR-ASK
Noise figure 35 dB
1 dB compression -10 dBm Linearly process Tx to Rx coupled signal
Requirement Min Typ Max Units Comment
Output sampling rate (complex) 1.5 Msps Oversampling to limit aliasing
IQ phase imbalance 3 deg
IQ amplitude imbalance 0.1 dB
IQ offset 0.5 dB Referenced to demodulator input
System
Range to tag (r) 0.8 1 m
Mast height (h) 1 m
Tx to Rx angle (θ) 25 deg
Tx to Rx isolation 50 dB Transmitter cable output to receiver cable input
7. Calibration
7.1 Power Definitions
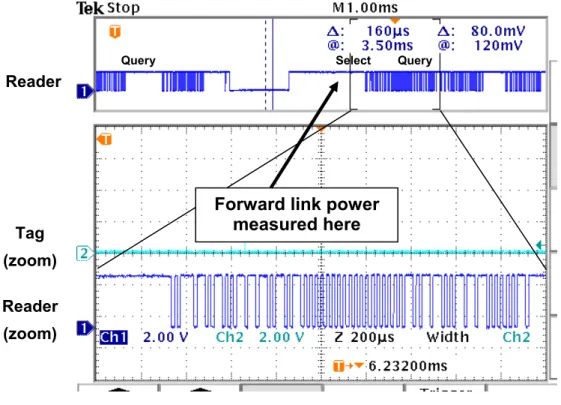
Forward link power is defined as the average power measured over a 1 ms period during the CW portion just prior to a Reader command as shown in Figure 7-1.
Query Select Query
Reader
Figure 7-1 - Forward link power measurement Reader
(zoom) Tag (zoom)
Forward link power
measured here
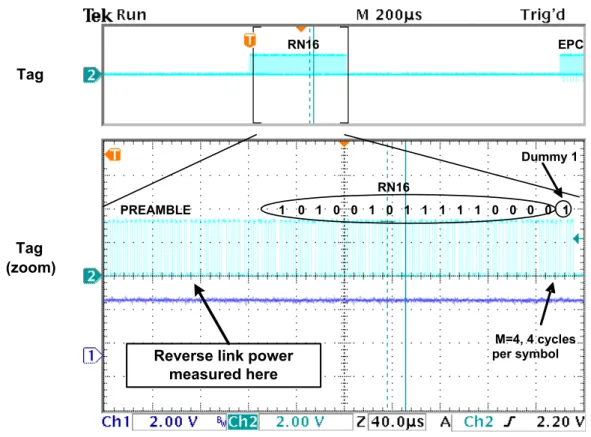
The reverse link power is the average power measured over the extended preamble of an RN16 response to a dense reader PR-ASK command as defined in 5.4.1.
PREAMBLE 1 0 1 0 0 1 0 1 1 1 1 1 0 0 0 0 1 Tag (zoom) Tag RN16 EPC RN16 Dummy 1 M=4, 4 cycles per symbol
Reverse link power measured here
Figure 7-2 - Reverse link power measurement
7.2 Transmit Power Calibration
Transmit power measurements are made at the coupled output of the directional coupler in the transmit path us-ing a gated power meter with capability to measure peak power in the period just prior to a transmitted command as described in 7.1. Transmit EIRP is determined by applying a transmitter calibration factor to a power meas-urement. The calibration factor is the difference (dB) between the power measured at the transmitter output and the coupled port plus the transmit antenna on-boresight gain.
TxA M Tx
P
P
G
EIRP
=
+
Δ+
Where: TxEIRP
is the transmit EIRP in dBmM
P
is the measured power at the power meter in dBmTx
P
is the transmitter output power in dBmTxA
G
is the peak linear antenna gain measured across the axial ratio major axis in dBilΔ
7.3 Receive Power Calibration
The backscattered RIP is determined by measuring the power at the Quadrature Demodulator output. IQ output power is the unbiased sum of the squares of I and Q digital samples. The RIP is determined by subtracting the receiver gain and antenna gain from the IQ output power.
RxA Rx IQ Rx
P
G
G
RIP
=
−
−
Where: RxRIP
is the received isotropic power at the Rx antenna in dBmIQ
P
is the power measured at the Quadrature Demodulator output determined as( ) (
)
⎟
⎠
⎞
⎜
⎝
⎛
⎥⎦
⎤
⎢⎣
⎡
−
+
−
∗
=
∑
N= n n n IQI
I
Q
Q
P
10
log
1 2 2 n nQ
I
,
are quadrature baseband I and Q digital samples measured over the long preambleQ
I,
are the means of the same I and Q samplesN is the number of complex samples captured in a 250 µsec interval
RxA
G
is the peak linear gain of the Rx antenna along the axial ratio major axis in dBilRx
G
is the receiver electronics gain in dB units measured according to the following calibration procedure: 1) Connect a signal generator to a power meter or spectrum analyzer.2) Set the signal generator for a -30 dBm output power at the center of the intended band of operation as defined in 5.4.3 and measure the power at the end of a test cable connected to the generator output. Re-cord the power reading,
P
PM, in dBm.3) Connect the end of the test cable to receiver input (where the receive antenna is normally connected) and power up the receiver equipment.
4) Set the receiver LO frequency equal to the transmit frequency and configure the receiver for a baseband bandwidth of 1 MHz and complex sampling rate of at least 50% greater than the sampling rate.
5) Capture 250 µsec of I/Q samples
(
IREF
nand
QREF
n)
and determineIREF
and
QREF
, the I and Q means respectively.6) Determine the receiver electronics gain by subtracting the initial power meter measurement from the power measured at the Quadrature Demodulator output.
(
) (
)
PMN
n n n
Rx
IREF
IREF
QREF
QREF
P
G
=
10
∗
log
⎜
⎝
⎛
∑
=1⎢⎣
⎡
−
2+
−
2⎤
⎥⎦
⎟
⎞
⎠
−
7.4 Antenna Gain Calibration
The gain of the circularly polarized antennas used in the setup in Figure 6-1 is defined as the linear gain (meas-ured by a linearly polarized test antenna) oriented along the major axial ratio axis. That is, the maximum linear gain. Antennas shall be oriented with their major axes horizontal for all tests specified in this document. The an-tenna gain can be measured against a linearly polarized reference anan-tenna with a known gain according to the following process.
1) Calibrate a Network Analyzer with S-parameter capability using an open, short and 50 ohm load.
TUT. Orient the reference antenna horizontally approximately 1 meter from the Antenna Under Test (AUT).
3) Record the distance between the reference antenna and AUT apertures.
4) Disconnect the Tx and Rx cables from the antennas and mate them to each other.
5) Sweep the S21 (transmission loss) on the Network Analyzer from 860 to 960 MHz. Save as the reference. 6) Reconnect the Tx and Rx cables to the reference and AUT and perform the same S21 sweep.
7) Rotate the AUT until the S21 gain is maximized. This is the proper AUT orientation for conducting tests. 8) Calculate the AUT gain by subtracting the reference antenna gain and path loss from the S21
measure-ment. The path loss (dB) is determined from the Friis equation using the distance between antennas and the frequency.
9) Rotate the AUT 90° clockwise (facing the front of the antenna) and repeat step 8. 10) Repeat step 9 at 180° and 270°.
11) The peak difference (dB) between the 0° orientation and the other orientations is the axial ratio. Compare it to the requirement in Table 6-1.
If the gain of the reference antenna is not known, the AUT and reference antenna gain can be determined using a third linear antenna.
1) Perform the first 7 steps of the procedure above.
2) Substitute the third linear antenna for the reference antenna with the same horizontal orientation and sweep S21 as before.
3) Substitute the reference antenna for the AUT (horizontal orientation) and sweep S21.
4) There now exists three sets of data with three unknowns, the gains of each antenna. Subtract the path loss from each set and solve for the gains.
8. Test Methods
Testing shall be performed according to the procedures described in this section using the setup defined in sec-tion 6, the calibrasec-tion procedures defined in secsec-tion 7, and under the condisec-tions defined in secsec-tion 5.
8.1 Read Range
8.1.1 Purpose
The purpose of the read range test is to determine the sensitivity of the Tag. The reported sensitivity is the for-ward link range at the center of the intended band of operation along the mechanical boresight of the Tag assum-ing a 35 dBm Reader EIRP. Class 1 tags are typically limited by forward link range (reverse link range is higher) so this metric indicates the Tag’s nominal free space range.
8.1.2 Description
With the Tag positioned in the far-field of the transmit antenna, the transmit power is varied until the Tag correctly responds with a 96-bit EPC 50% of the time. A success is defined as the return of a valid RN16 and error-free EPC data in response to Query and ACK commands from the test reader. The free space path loss to the Tag is used to determine the free space range under the assumption of a 35 dBm transmit EIRP.
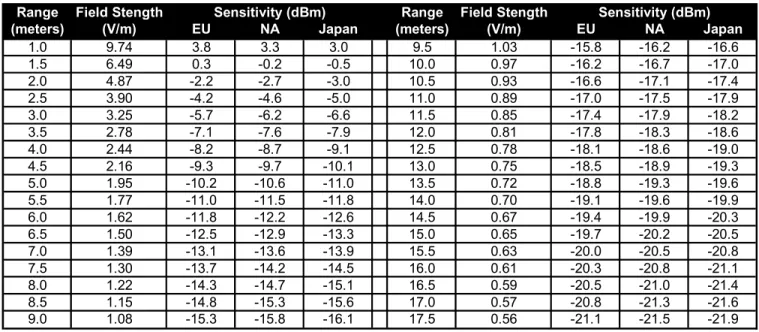
The reported range is the Tag range that is expected in an environment free of RF reflections, interference, and lossy materials. The range experienced in a real-life environment may be less or greater than the reported nomi-nal value. A conversion table is provided in Annex A listing the relationship between range (meters), RIP at the Tag (dBm), and field strength at the Tag (volts/meter).
8.1.3 Procedure
1) Position the Tag Under Test (TUT) on the mast in the default orientation specified in 6.2.
2) Set the transmitter for an EIRP below the minimum expected to elicit a response from the TUT. Set the frequency as specified in 5.4.3.
3) Repeatedly transmit the dense reader PR-ASK signal defined in 5.4 for reading and monitor the success rate.
4) Increase the transmit EIRP in 0.25 dB steps until the success rate reaches 50%. Record the EIRP. 5) Increase the EIRP by 1 dB and decrease the EIRP in 0.25 dB steps until a 50% success rate occurs.
Re-cord the EIRP.
6) Calculate the mean of the two EIRPs and use it to determine the nominal TUT read range assuming a 35 dBm EIRP using the following expression.
dBm in EIRP transmit mean the is meters in setup test the in Tag the to range the is : Where 10 * (meters) Range Read 20 35 Tx EIRP EIRP r r Tx ⎟ ⎟ ⎠ ⎞ ⎜ ⎜ ⎝ ⎛ − =
8.1.4 Reporting
The test report shall include the following information: 1. Location, time, conditions, and conductor of test 2. Description of TUT
3. Low-to-high, high-to-low, and mean EIRP for each TUT tested 4. Read Range for each TUT tested
5. Ranking in descending order, determine the 90% Read Range statistic per 5.1
The 90% Read Range statistic shall be listed in Min column of the summary report (Table 4-1).
8.2 Orientation Tolerance
8.2.1 Purpose
In practice, the Tag can have any orientation relative to a Reader’s antenna. The purpose of the orientation toler-ance test is to determine how well the Tag sensitivity is maintained as the Tag is rotated away from its preferred orientation (typically facing the Reader antenna). The metric used is the percentage of Tag positions where the range exceeds half of the on-boresight range measured in 8.1; the higher the percentage, the greater the Tag’s tolerance to orientation.
8.2.2 Description
With the Tag positioned in the far-field of the transmit test antenna, the transmit power is varied until the Tag cor-rectly responds with a 96-bit EPC 50% of the time as described in 8.1.2. This test is repeated as the Tag is swept from -90° to +90° first in azimuth and then in elevation. The free space range is determined from transmit EIRPs, frequency and the setup distance to the Tag assuming a 35 dBm transmit EIRP. Figure 8-1 is a sample plot of read range vs. azimuth and elevation.
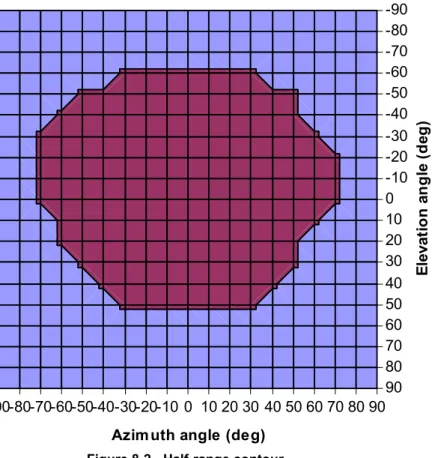
An orientation tolerance percentage is determined by calculating the percent area of the half-sphere where the range is at least half the maximum range. Azimuth and elevation Tag antenna gains are assumed independent for purposes of determining gains off of the principle azimuth an elevation axes. The orientation region where better than half-range performance is achieved appears in the contour plot of Figure 8-2 assuming the sample data in
Figure 8-1. 0 1 2 3 4 5 6 7 8 9 10 -90 -80 -70 -60 -50 -40 -30 -20 -10 0 10 20 30 40 50 60 70 80 90 Orientation (degrees) R ang e ( m et er s) Azimuth Range Elevation Range
Figure 8-1 – Free space read range vs. azimuth and elevation angles
-90-80-70-60-50-40-30-20-10 0 10 20 30 40 50 60 70 80 90 90 80 70 60 50 40 30 20 10 0 -10 -20 -30 -40 -50 -60 -70 -80 -90
Azimuth angle (deg)
E lev at io n a n g le (d eg )
8.2.3 Procedure
1) Perform steps 1 through 6 in 8.1.3.
2) Repeat step 1 at 10, 20, 30, 40, 50, 60, 70, 80, and 90° positive azimuth angles. A positive azimuth angle is a counter clockwise rotation when viewing the test mast from above.
3) Repeat step 2 for negative azimuth angles.
4) Repeat step 2 for positive elevation angles. A positive elevation angle is an upward rotation when viewing the Tag from the perspective of the transmit antenna.
5) Repeat step 2 for negative elevation angles.
6) Plot range (meters) versus azimuth and elevation angle as shown in Figure 8-1.
7) Calculate the indicator function according to the expressions below and plot it versus azimuth and elevation angle as shown in Figure 8-2.
8) Calculate the Orientation Tolerance percentage using the following expression.
(
( (i), (j)))
max * 1717 . 2 (j)) (i), U( * (i)) cos( (%) Tolerance n Orientatio El 19 1 j 19 1 El El Az i Az Rangeθ
θ
θ
θ
θ
∑∑
= = = Where:(
)
(
)
[
]
[
]
(j)) ( (i)) ( (j)) (i), ( 90 80 80 -90 -(j) 90 80 80 -90 -(i) (j)) (i), ( max * 5 . 0 (j)) (i), ange( 0 (j)) (i), ange( max * 5 . 0 (j)) (i), ange( 1 (j)) (i), U( El El El El El El El El Az Az Az Az Az Az Az Az Range Range Range Range R R Rθ
θ
θ
θ
θ
θ
θ
θ
θ
θ
θ
θ
θ
θ
θ
θ
∗ = = = ⎩ ⎨ ⎧ < ≥ = L L8.2.4 Reporting
The test report shall include the following information: 1. Location, time, conditions, and conductor of test 2. Description of TUT
3. Low-to-high, high-to-low, and mean EIRP for each TUT tested at each angle 4. Read range for each TUT at each angle
5. Plots of read range and the indicator function (contour) for each TUT vs. azimuth and elevation 6. Orientation Tolerance percentage for each TUT
7. Ranking in descending order, determine the 90% Orientation Tolerance statistic per 5.1.
8.3 Frequency Tolerance
8.3.1 Purpose
The purpose of the frequency tolerance test is to characterize the sensitivity of the Tag to frequency. Tags that perform well over a large bandwidth are suitable for operation across regulatory regions and tend to be less prone to performance degradation when attached to materials. Frequency tolerance is the percentage of frequencies that the Tag range exceeds half of the maximum read range measured over the 860 to 960 MHz worldwide band; the higher the percentage, the more consistent the Tag’s performance across regions.
8.3.2 Description
With the Tag positioned in the far-field of the transmit test antenna, the transmit power is varied until the Tag cor-rectly responds with a 96-bit EPC 50% of the time as described in 8.1.2. This test is repeated at frequencies across the 860 to 960 MHz band. The transmit EIRPs, frequency and the distance to the Tag are used to deter-mine the free space range at each frequency assuming a 35 dBm transmit EIRP. A frequency tolerance percent-age is calculated by determining the portion of frequencies performing above half the maximum range. Figure 8-3 is a sample plot of read range verses frequency with the half-range threshold superimposed. Fourteen of the twenty one data points are greater than or equal to the half-range threshold, therefore the frequency tolerance is 67%. 0 1 2 3 4 5 6 7 8 9 10 860 870 880 890 900 910 920 930 940 950 960 Frequency (MHz) R ange ( m et er s)
Figure 8-3 - Read range versus frequency
8.3.3 Procedure
1) Perform steps 1 through 6 in 8.1.3 except with frequency set to 860 MHz.
3) Plot range vs. frequency as shown in Figure 8-3 and determine the frequency sensitivity percentage ac-cording to the following expression.
21 . 0 (i)) U( (%) Tolerance Frequency 21 1
∑
= = i f Where:(
)
(
)
[
860 865 955 960]
(i) (i)) ( max * 5 . 0 (i)) ange( 0 (i)) ange( max * 5 . 0 (i)) ange( 1 (i)) U( L = ⎩ ⎨ ⎧ < ≥ = f f Range f R f R f R f (i))U(f is the indicator function that flags when the TUT can be successfully inventoried at the qualifying range. The indicator function is unity at the frequencies where the range is at least half the maximum range and zero otherwise.
8.3.4 Reporting
The test report shall include the following information: 1. Location, time, conditions, and conductor of test 2. Description of TUT
3. Low-to-high, high-to-low, and mean EIRP for each TUT tested at each frequency 4. Read range for each TUT at each frequency
5. Plot of read range for each TUT vs. frequency 6. Frequency Tolerance percentage for each TUT
7. Ranking in descending order, determine the 90% Frequency Tolerance statistic per 5.1
The 90% Frequency Tolerance statistic shall be listed in Min column of the summary report (Table 4-1).
8.4 Interference Tolerance
8.4.1 Purpose
The purpose of the interference tolerance test is to characterize the tag’s performance with interference present. Interference is common in a dense-reader environment or where asynchronous readers operate simultaneously across a portal. Interference tolerance is the ratio of desired-to-interfering Reader range at which the interferer-less Tag range to the desired Reader is halved. For example, an interference tolerance of 50% indicates that the Tag can operate when an interfering Reader is positioned at twice the range as the desired Reader. An interfer-ence tolerance greater than 100% means the interfering Reader can be positioned closer to the Tag than the de-sired Reader. The reported interference tolerance assumes the dede-sired and interfering Readers take the same path along the boresight of the Tag. Testing is performed at the center of the intended band of operation along the mechanical boresight of the Tag.
8.4.2 Description
The Tag is positioned in the far-field of the transmit test antenna and the transmit power is varied until the Tag correctly responds with a 96-bit EPC 50% of the time as described in 8.1.2. The transmit power is increased by 6 dB and an interfering continuous wave (CW) signal is summed with the desired signal just prior to the transmit antenna. The CW power is increased until the Tag correctly responds with a 96-bit EPC 50% of the time as
be-fore. The interference tolerance is determined from the dB difference between the desired and interfering transmit powers.
The test is run with the interfering signal at two different frequency offsets from desired signal. The closer inter-ferer represents an adjacent FCC channel (50 channel frequency plan assumed), and the further interinter-ferer repre-sents an alternate RFID high power ETSI channel (4 channel frequency plan assumed).
8.4.3 Procedure
1) Perform steps 1 through 6 in 8.1.3 with the interfering signal source off.
2) Increase the EIRP by 6 dB above the mean EIRP determined in step 6 in 8.1.3.
3) Set the interfering signal generator for CW transmission with an EIRP below the mean EIRP determined in step 6 in 8.1.3. Set the frequency 500 kHz higher than the transmitter frequency. Turn on the interfering signal generator.
4) Perform steps 1 through 6 in 8.1.3 as the interfering signal is increased or decreased in 0.25 dB incre-ments. Record the interferer EIRP at which 50% read success occurs.
5) Repeat steps 3 and 4 for an interfering signal 1.2 MHz above the transmitter frequency. 6) Calculate the interference tolerance at each interfering offset using the following expression.
(
/20)
10 1 * 100 (%) Tolerance ce Interferen = − −ΔEIRP Where:ΔEIRP is the difference between the interferer-less and interfering 50% success EIRP’s in dB
8.4.4 Reporting
The test report shall include the following information: 1. Location, time, conditions, and conductor of test 2. Description of TUT
3. Low-to-high, high-to-low, and mean EIRP for each TUT tested under interfere-less conditions at each in-terfering frequency
4. ΔEIRP (difference between interferer-less and interfering mean EIRP’s) at each interfering frequency 5. Interference Range Ratio at each interfering frequency
6. Ranking in descending order, determine the 90% Interference Range Ratio statistic at each frequency per 5.1
The 90% Interference Range Ratio statistic for each interfering frequency offset shall be listed in Min column of the summary report (Table 4-1).
8.5 Backscatter Range
8.5.1 Purpose
The purpose of the backscatter range test is to determine the strength of the Tag backscatter response. The backscatter strength is reported in terms of a reverse link range (meters) assuming a nominally sensitive Reader receiving the signal. Because read range (forward link range) and backscatter range (reverse link range) are rep-resented in the same units, they can be contrasted. Reverse link range is typically greater than forward link range for Class 1 tags. The reported range is the reverse link range at the center of the intended band of operation along the mechanical boresight of the Tag assuming a Reader receiver with -70 dBm sensitivity using a 5 dBil gain antenna.
8.5.2 Description
responds with a 96-bit EPC 50% of the time as described in 8.1. The transmit power is increased by 2 dB and the backscattered power at the receiver input is measured. The Backscatter Range is calculated assuming a Reader sensitivity of -70 dBm connected to a receive antenna with 5 dBil gain.
The reported range is the Tag backscatter range that is expected using a nominally sensitive Reader in an envi-ronment free of RF reflections, interference, and lossy materials. The range experienced using a Reader with a different sensitivity in a real-life environment may be less or greater than the reported nominal value.
8.5.3 Procedure
1) Perform steps 1 through 6 in 8.1.3.
2) Increase the transmit EIRP by 2 dB above the mean EIRP determined in step 6 of 8.1.3.
3) Set the receiver LO frequency equal to the transmit frequency with an output bandwidth of 1 MHz and complex sampling rate at least 50% higher than the bandwidth (e.g. at least 1.5 Msps for a bandwidth of 1 MHz).
4) Capture at least 10 symbols (250 µsec) of the backscattered preamble.
5) Determine the received backscatter power by measuring the complex IQ power and applying the receiver gain determined in 7.3.
Rx IQ
Rx
P
G
P
0=
0−
6) Calculate the Backscatter Range using the following expression:
(
)
0 0 0 4 / 1 10 / 110 10 (meters) Range r Backscatte RxA Tx Rx K G EIRP P K r − − + = ⋅ = Where:PRx0 is the measured power at the Rx input at a transmit EIRP 2 dB above the read threshold in dBm
EIRPTx0 is the transmit EIRP at 2 dB above the read threshold in dBm
GRxA0 is the test set receiver antenna gain (linearly polarized) in dBil r is the range to the Tag in the test setup in meters
8.5.4 Reporting
The test report shall include the following information: 1. Location, time, conditions, and conductor of test 2. Description of TUT
3. EIRP value where measurement was taken for each TUT tested 4. Backscatter RIP for each TUT tested
5. Backscatter Range for each TUT tested
6. Ranking in descending order, determine the 90% Backscatter Range statistic per 5.1.
The 90% Backscatter Range statistic shall be listed in Min column of the summary report (Table 4-1).
8.6 Write Range
8.6.1 Purpose
nominal forward link range at which the Tag can be successfully written. Testing is performed at the center of the intended region of operation along the mechanical boresight of the Tag, assuming a 35 dBm Reader EIRP.
8.6.2 Description
With the Tag positioned in the far-field of the transmit test antenna, the transmit power is varied until the Tag is successfully written 50% of the time. For a success the Tag must 1) be successfully inventoried, returning its 96-bit EPC, 2) respond to a Req_RN, and 3) respond to the Write command with a zero error code within 20 msec. A single 16-bit word shall be written to the EPC memory bank as defined in 5.4.2. To assure new data is written to the Tag, a different word value will be sent on the attempt following a success. The new word can be attempted until a success is achieved, then the test set should revert to the original word for the subsequent attempt. In this way, two words are sufficient for testing.
Once the 50% success point is found, the free space path loss to the Tag is used to determine the free space write range under the assumption of a 35 dBm transmit EIRP.
The reported range is the Tag range that is expected in an environment free of RF reflections, interference, and lossy materials. The range experienced in a real-life environment may be less or greater than the reported nomi-nal value. A conversion table is provided in Annex A listing the relationship between range (meters), RIP at the Tag (dBm), and field strength at the Tag (volts/meter).
8.6.3 Procedure
1) Position the Tag Under Test (TUT) on the mast in the default orientation specified in 6.2.
2) Set the transmitter for an EIRP at the TUT read threshold. Set the frequency to the center of the intended operating band as defined in 5.4.3.
3) Repeatedly transmit the dense reader PR-ASK signal defined in 5.4.1 for writing and monitor the success rate. This includes a 96-bit inventory as defined for reading followed by Req_RN and Write commands. 4) Increase the transmit EIRP in 0.25 dB steps until the write success rate reaches 50%. Record the EIRP. 5) Increase the EIRP by 1 dB and decrease the EIRP in 0.25 dB steps until the a 50% success rate occurs.
Record the EIRP.
6) Calculate the mean of the two EIRPs and use it to determine the nominal TUT write range assuming a 35 dBm EIRP using the following expression.
dBm in EIRP transmit mean the is meters in setup test the in Tag the to range the is : Where 10 * (meters) Range Write 20 35 Tx EIRP EIRP r r Tx ⎟ ⎟ ⎠ ⎞ ⎜ ⎜ ⎝ ⎛ − =
8.6.4 Reporting
The test report shall include the following information: 1. Location, time, conditions, and conductor of test 2. Description of TUT
3. Low-to-high, high-to-low, and mean EIRP for each TUT tested 4. Write Range for each TUT tested
5. Ranking in descending order, determine the 90% Write Range statistic per 5.1.
8.7 Write Time
8.7.1 Purpose
Many applications require rapid writing of data to the Tag. This test measures the time to complete a 16-bit word to EPC memory. Two conditions are tested, the write time when the memory is initialized to a zero value and when it is initialized to a non-zero value. Since most Class 1 Tags support a 96-bit EPC, the write time reported is the time to write a single word multiplied by six. This time is the minimum that could be achieved in practice using the dense-reader mode. Overhead associated with Reader and Tag communications and processing will extend the time slightly. Testing is performed at the center of the intended operation band along the mechanical boresight of the Tag.
Writing shall be attempted through the secured state following a successful inventory. An access password is not required, because it is set to zero in the default TUT configuration. The Write command shall be used to write a single word to location 20 hex in the EPC memory bank. If the memory is initialized with a non-zero value and the tag vendor specifies that the memory requires clearing (zeroing) prior to a write attempt, then the cumulative time to clear the memory and write a new non-zero value will measured and reported (see zero-initialized entry in Table 4-1). Shorter write times are desirable.
8.7.2 Description
With the Tag positioned in the far-field of the transmit test antenna, the transmit power is set 2 dB above the EIRP required to achieve a 50% probability of write success. Two scenarios are tested, writing a non-zero EPC when the TUT EPC memory contains zeros (is cleared), and writing a non-zero EPC when the TUT memory contains non-zeros. Some Tags may require clearing the memory prior to writing a new EPC. The time to complete this extra step is included in the total write time.
If the TUT requires memory clearing before a new non-zero EPC can be written then the TUT is inventoried and 96-bits of EPC memory are cleared using Gen 2 commands specified by the vendor. The time between the end of the first command and the start of the last Tag response acknowledging success is recorded (the clear time). The TUT is inventoried again, a Req_RN is sent followed by a Write command with a word targeted for memory ad-dress 20 hex. The time between the end of the Write command and the beginning of the preamble of an affirma-tive Tag response is measured (see Figure 8-4). If the write is unsuccessful, the write time is discarded, and the TUT is re-inventoried and the process repeated. Once the write is successful, the write time is recorded.
The time reported to complete a 96-bit write in a cleared Tag is calculated by multiplying the single-word write time by six. The time to write a non-cleared Tag is the cleared write time plus the time to clear the Tag. The cleared and non-cleared times are equal for Tags that can directly write a new EPC to a non-zero memory.
Write 16-bit word to EPC CW {0, handle , CRC-16 } TWRITE
Preamble
Reader command Tag response
Figure 8-4 – Single-word write time definition
8.7.3 Procedure
1) Position the Tag Under Test (TUT) on the mast in the default orientation specified in 6.2.
2) Transmitting the dense reader PR-ASK signal defined in 5.4.1, set the transmitter for an EIRP 2 dB above the TUT write threshold. Set the frequency to the center of the intended regional operating band.
3) If the vendor has declared that TUT requires clearing, then clear 96 bits of EPC memory according to the command sequence specified by the vendor. Record the clear time as the time between the end of first write command and the start of the preamble of last Tag response acknowledging success. If clearing is not required, skip this step.
4) Attempt writing AFBE hex to EPC memory address 20 hex. This includes a 96-bit inventory as defined for reading followed by Req_RN and Write commands.
5) If step 4 does not result in a successful write, then repeat step 4 until write success is achieved. 6) Measure and record the single-word write time as defined in Figure 8-4 for the successful write.