Prior-Cancer Diagnosis in Men with Nonmetastatic Prostate
Cancer and the Risk of Prostate-Cancer-Specific and All-Cause
Mortality
(Article begins on next page)
The Harvard community has made this article openly available.
Please share how this access benefits you. Your story matters.
Citation
Mirabeau-Beale, Kristina, Ming-Hui Chen, and Anthony V.
D'Amico. 2014. “Prior-Cancer Diagnosis in Men with
Nonmetastatic Prostate Cancer and the Risk of
Prostate-Cancer-Specific and All-Cause Mortality.” ISRN Oncology 2014 (1):
736163. doi:10.1155/2014/736163.
http://dx.doi.org/10.1155/2014/736163.
Published Version
doi:10.1155/2014/736163
Accessed
February 19, 2015 3:38:56 PM EST
Citable Link
http://nrs.harvard.edu/urn-3:HUL.InstRepos:12064388
Terms of Use
This article was downloaded from Harvard University's DASH
repository, and is made available under the terms and conditions
applicable to Other Posted Material, as set forth at
http://nrs.harvard.edu/urn-3:HUL.InstRepos:dash.current.terms-of-use#LAA
Research Article
Prior-Cancer Diagnosis in Men with Nonmetastatic
Prostate Cancer and the Risk of Prostate-Cancer-Specific and
All-Cause Mortality
Kristina Mirabeau-Beale,
1Ming-Hui Chen,
2and Anthony V. D’Amico
31Harvard Radiation Oncology Program, Brigham and Woman’s Hospital and Department of Radiation Oncology,
Dana-Farber Cancer Institute, 75 Francis Street, Boston, MA 02115, USA
2Department of Statistics, University of Connecticut, Storrs, CT 06269, USA
3Department of Radiation Oncology, Brigham and Women’s Hospital and Dana-Farber Cancer Institute, Boston, MA 02115, USA
Correspondence should be addressed to Kristina Mirabeau-Beale; kmirabeau-beale@partners.org Received 18 November 2013; Accepted 16 December 2013; Published 30 January 2014
Academic Editors: T. I. Al-Saleem, G. Kovacs, and C. A. Perez
Copyright © 2014 Kristina Mirabeau-Beale et al. This is an open access article distributed under the Creative Commons Attribution License, which permits unrestricted use, distribution, and reproduction in any medium, provided the original work is properly cited.
Purpose. We evaluated the impact a prior cancer diagnosis had on the risk of prostate-cancer-specific mortality (PCSM) and all-cause mortality (ACM) in men with PC.Methods. Using the SEER data registry, 166,104 men (median age: 66) diagnosed with PC between 2004 and 2007 comprised the study cohort. Competing risks and Cox regression were used to evaluate whether a prior cancer diagnosis impacted the risk of PCSM and ACM adjusting for known prognostic factors PSA level, age at and year of diagnosis, race, and whether PC treatment was curative, noncurative, or active surveillance (AS)/watchful waiting (WW).Results. At a median followup of 2.75 years, 12,453 men died: 3,809 (30.6%) from PC. Men with a prior cancer were followed longer, had GS 8 to 10 PC more often, and underwent WW/AS more frequently (𝑃 < 0.001). Despite these differences that should increase the risk of PCSM, the adjusted risk of PCSM was significantly decreased (AHR: 0.66 (95% CI: (0.45, 0.97);𝑃 = 0.033), while the risk of ACM was increased (AHR: 2.92 (95% CI: 2.64, 3.23);𝑃 < 0.001) in men with a prior cancer suggesting that competing risks accounted for the reduction in the risk of PCSM.Conclusion. An assessment of the impact that a prior cancer has on life expectancy is needed at the time of PC diagnosis to determine whether curative treatment for unfavorable-risk PC versus AS is appropriate.
1. Introduction
While favorable-risk (PSA≤20; T2b category or less; Gleason score≤7 [1]) prostate cancer (PC) can have a long natural history [2] and is often curable, unfavorable-risk PC (which comprises approximately 20% of cases) accounts for the majority of prostate cancer deaths [3]. Men of PC bearing age are also at risk for a metachronous cancer (i.e., history of or subsequent diagnosis of another cancer). When consid-ering life expectancy in men with PC, competing risks are particularly relevant in men with favorable-risk disease [4– 10], in order to avoid overtreatment of PC where the potential toxicities of treatment can be sustained with no prolongation in survival.
To our knowledge, no study has investigated the impact that the comorbidity of a prior cancer has on the risk of PCSM.
Therefore, we used a SEER population database registry to evaluate the impact that a prior cancer had on the risk of PCSM and all-cause mortality (ACM) in men with newly diagnosed, node negative, nonmetastatic PC, adjusting for age at and year of diagnosis, race, initial treatment (curative or noncurative) or active surveillance (AS) or watchful waiting (WW), and known PC prognostic factors.
2. Methods
2.1. Patients Selection and SEER Data Registry. We used a population-based registry, SEER [11], in order to identify 166,104 men diagnosed with prostate cancer between 2004 and 2007. The inclusion period was limited to 2004–2007 when PSA data was available. The registries report infor-mation on age, date of diagnosis, demographics, tumor Volume 2014, Article ID 736163, 6 pages
2 ISRN Oncology
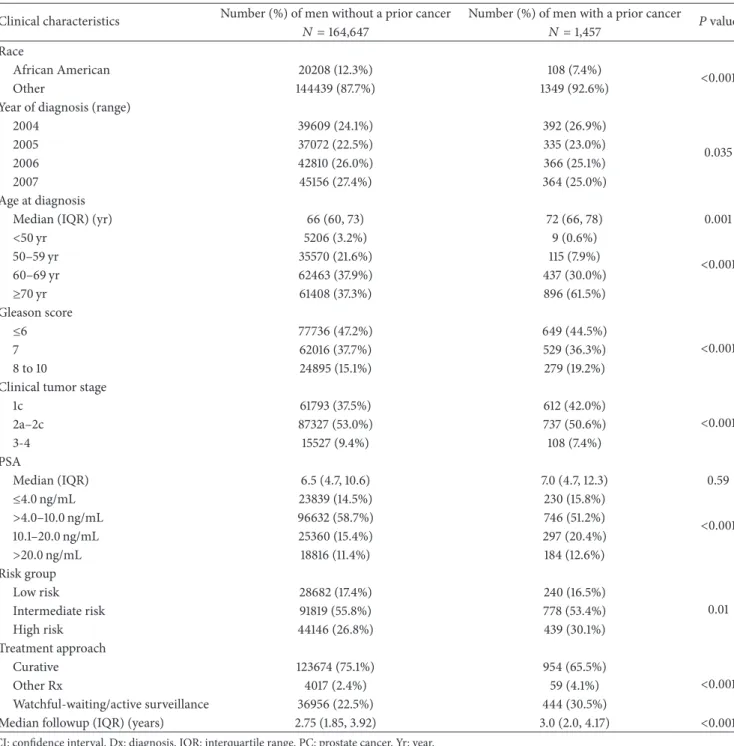
Table 1: Comparison of the distribution of clinical characteristics of the 166,104 men stratified by a history of cancer prior to the PC diagnosis versus no prior cancer.
Clinical characteristics Number (%) of men without a prior cancer Number (%) of men with a prior cancer 𝑃value
𝑁 =164,647 𝑁 =1,457
Race
African American 20208 (12.3%) 108 (7.4%) <
0.001
Other 144439 (87.7%) 1349 (92.6%)
Year of diagnosis (range)
2004 39609 (24.1%) 392 (26.9%) 0.035 2005 37072 (22.5%) 335 (23.0%) 2006 42810 (26.0%) 366 (25.1%) 2007 45156 (27.4%) 364 (25.0%) Age at diagnosis
Median (IQR) (yr) 66 (60, 73) 72 (66, 78) 0.001
<50 yr 5206 (3.2%) 9 (0.6%) <0.001 50–59 yr 35570 (21.6%) 115 (7.9%) 60–69 yr 62463 (37.9%) 437 (30.0%) ≥70 yr 61408 (37.3%) 896 (61.5%) Gleason score ≤6 77736 (47.2%) 649 (44.5%) <0.001 7 62016 (37.7%) 529 (36.3%) 8 to 10 24895 (15.1%) 279 (19.2%)
Clinical tumor stage
1c 61793 (37.5%) 612 (42.0%) <0.001 2a–2c 87327 (53.0%) 737 (50.6%) 3-4 15527 (9.4%) 108 (7.4%) PSA Median (IQR) 6.5 (4.7, 10.6) 7.0 (4.7, 12.3) 0.59 ≤4.0 ng/mL 23839 (14.5%) 230 (15.8%) <0.001 >4.0–10.0 ng/mL 96632 (58.7%) 746 (51.2%) 10.1–20.0 ng/mL 25360 (15.4%) 297 (20.4%) >20.0 ng/mL 18816 (11.4%) 184 (12.6%) Risk group Low risk 28682 (17.4%) 240 (16.5%) 0.01 Intermediate risk 91819 (55.8%) 778 (53.4%) High risk 44146 (26.8%) 439 (30.1%) Treatment approach Curative 123674 (75.1%) 954 (65.5%) <0.001 Other Rx 4017 (2.4%) 59 (4.1%) Watchful-waiting/active surveillance 36956 (22.5%) 444 (30.5%)
Median followup (IQR) (years) 2.75 (1.85, 3.92) 3.0 (2.0, 4.17) <0.001
CI: confidence interval. Dx: diagnosis. IQR: interquartile range. PC: prostate cancer. Yr: year.
characteristics, surgical treatment, radiation therapy, overall survival, and cancer specific survival [11].
2.2. Followup and Determination of the Cause of Death. The cut-off date for determination of death was December 31, 2008. A standard decision algorithm that uses International Classification of Diseases was used to process causes of death from death certificates [12]. This study was determined to be exempted from review by the Institutional Review Board
of the Dana-Farber Cancer Institute/Brigham and Women’s Hospital.
2.3. Statistical Methods
2.3.1. Comparison of the Distribution of Clinical Character-istics for the Study Cohort Stratified by Whether a History of Cancer Existed at the Time of the PC Diagnosis or Not.
We compared the distribution of clinical characteristics of the 166,104 men amongst those with a cancer diagnosis
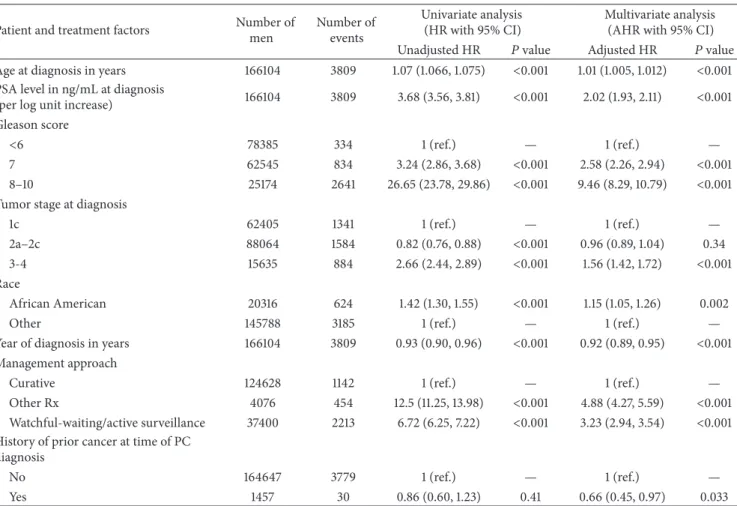
Table 2: Unadjusted and adjusted hazard ratios for prostate-cancer-specific mortality for patient and treatment factors.
Patient and treatment factors Number of men Number of events Univariate analysis (HR with 95% CI) Multivariate analysis (AHR with 95% CI) Unadjusted HR 𝑃value Adjusted HR 𝑃value Age at diagnosis in years 166104 3809 1.07 (1.066, 1.075) <0.001 1.01 (1.005, 1.012) <0.001 PSA level in ng/mL at diagnosis
(per log unit increase) 166104 3809 3.68 (3.56, 3.81) <0.001 2.02 (1.93, 2.11) <0.001 Gleason score
<6 78385 334 1 (ref.) — 1 (ref.) —
7 62545 834 3.24 (2.86, 3.68) <0.001 2.58 (2.26, 2.94) <0.001 8–10 25174 2641 26.65 (23.78, 29.86) <0.001 9.46 (8.29, 10.79) <0.001 Tumor stage at diagnosis
1c 62405 1341 1 (ref.) — 1 (ref.) —
2a–2c 88064 1584 0.82 (0.76, 0.88) <0.001 0.96 (0.89, 1.04) 0.34 3-4 15635 884 2.66 (2.44, 2.89) <0.001 1.56 (1.42, 1.72) <0.001 Race
African American 20316 624 1.42 (1.30, 1.55) <0.001 1.15 (1.05, 1.26) 0.002
Other 145788 3185 1 (ref.) — 1 (ref.) —
Year of diagnosis in years 166104 3809 0.93 (0.90, 0.96) <0.001 0.92 (0.89, 0.95) <0.001 Management approach
Curative 124628 1142 1 (ref.) — 1 (ref.) —
Other Rx 4076 454 12.5 (11.25, 13.98) <0.001 4.88 (4.27, 5.59) <0.001 Watchful-waiting/active surveillance 37400 2213 6.72 (6.25, 7.22) <0.001 3.23 (2.94, 3.54) <0.001 History of prior cancer at time of PC
diagnosis
No 164647 3779 1 (ref.) — 1 (ref.) —
Yes 1457 30 0.86 (0.60, 1.23) 0.41 0.66 (0.45, 0.97) 0.033
HR: hazard ratio. CI: confidence interval. Dx: diagnosis. HR: hazard ratio. PC: prostate cancer. Ref: reference. Rx: treatment.
preceding their PC diagnosis versus those without a prior cancer. The Wilcoxon rank-sum test [13] was used to compare the distribution of the continuous clinical characteristics and a Mantel-Haenszel chi square test [14] was used to compare the distribution of categorical covariates.
2.3.2. Risk of PCSM and ACM. We used a Fine and Gray [12] competing risks and Cox regression [15] to assess whether there was an association between risk of PCSM and ACM, respectively, in men diagnosed with a prior cancer versus no prior cancer adjusting for known PC prognostic factors, curative, noncurative treatment or AS/WW, race, and age at and year of diagnosis of PC. Time zero was defined as the date of the PC diagnosis.
Adjusted (𝐴)and unadjusted hazard ratios (HR) were calculated and are reported along with their 95% confidence intervals (CI) and associated𝑃values. A two-sided𝑃value
<0.05 was considered statistically significant.𝑅was used for all calculations related to Fine and Gray and SAS version 9.3 (SAS Institute, Cary, North Carolina) was used for all remaining statistical analyses.
2.3.3. Estimates of PCSM and ACM. The cumulative inci-dence method [16] was used to calculate estimates of PCSM
stratified by whether the patient had a history of cancer or not at the time of his PC diagnosis. Age adjusted com-parisons of the estimates were performed using Fine and Gray’s regression. ACM was defined as one minus overall survival. Estimates of ACM were calculated using the method of Kaplan and Meier [17] and age adjusted estimates [18] stratified by whether the patient had a history of cancer or not at the time of his PC diagnosis were compared using an age adjusted log rank𝑃value.
3. Results
3.1. Comparison of the Distribution of Clinical Characteristics for the Study Cohort Stratified by Whether a History of Cancer Existed at the Time of the PC Diagnosis or Not. After a median followup of 2.75 years, 12,453 men died: 3,809 (30.6%) from PC. Prior to the diagnosis of PC, 1,457 malignancies occurred at a median of 4.8 years. As shown in Table1, men with a prior cancer were significantly older at diagnosis (median age: 72 versus 66 years,𝑃 = 0.001), were followed longer (median follow up: 3.0 versus 2.75 years,𝑃 < 0.001), were more likely to have high-risk PC (30.1% versus 26.8%,𝑃 = 0.01) based on the occurrence of Gleason 8 to 10 PC (19.2% versus 15.1%,
𝑃 < 0.001), and underwent WW or AS more frequently (30.5% versus 22.5%, 𝑃 < 0.001). In addition, they were
4 ISRN Oncology
Table 3: Unadjusted and adjusted hazard ratios for all-cause mortality for patient and treatment factors.
Patient and treatment factors Number of men Number of events Univariate analysis (HR with 95% CI) Multivariate analysis (AHR with 95% CI) Unadjusted HR 𝑃value Adjusted HR 𝑃value Age at diagnosis in years 166104 12453 1.09 (1.089, 1.093) <0.001 1.05 (1.046, 1.051) <0.001 PSA level in ng/mL at diagnosis
(per log unit increase) 166104 12453 2.09 (2.06, 2.13) <0.001 1.38 (1.36, 1.41) <0.001 Gleason score
<6 78385 3571 1 (ref) — 1 (ref) —
7 62545 4048 1.49 (1.42, 1.56) <0.001 1.35 (1.29, 1.42) <0.001 8–10 25174 4834 4.76 (4.56, 4.97) <0.001 2.46 (2.34, 2.58) <0.001 Tumor stage at diagnosis
1c 62405 5198 1 (ref.) — 1 (ref.) —
2a–2c 88064 5726 0.75 (0.73, 0.78) <0.001 0.98 (0.94, 1.02) 0.28 3-4 15635 1529 1.17 (1.11, 1.24) <0.001 1.30 (1.22, 1.38) <0.001 Race
African American 20316 1950 1.36 (1.30, 1.43) <0.001 1.45 (1.38, 1.52) <0.001
Other 145788 10503 1 (ref.) — 1 (ref.) —
Year of diagnosis in years 166104 12453 0.94 (0.92, 0.96) <0.001 0.96 (0.94, 0.98) <0.001 Management approach
Curative 124628 5077 1 (ref.) — 1 (ref.) —
Other Rx 4076 1023 6.90 (6.45, 7.37) <0.001 3.50 (3.25, 3.75) <0.001 Watchful-waiting/active surveillance 37400 6353 4.62 (4.46, 4.80) <0.001 2.61 (2.50, 2.72) <0.001 History of prior cancer at time of PC
diagnosis
No 164647 12050 1 (ref.) — 1 (ref.) —
Yes 1457 403 4.08 (3.69, 4.50) <0.001 2.92 (2.64, 3.23) <0.001
HR: Hazard ratio. CI: Confidence Interval. Dx: diagnosis. HR: Hazard ratio. PC: prostate cancer. Ref: reference. Rx: treatment.
also less likely to be African American (7.4% versus 12.3%,
𝑃 < 0.001) and they were more likely to have clinical tumor stage T1c (42.0 versus 37.5%,𝑃 < 0.001) and were more likely to be diagnosed earlier in time (𝑃 = 0.035).
3.2. Risk of PCSM and ACM. As shown in Table2, for men with a history of cancer at the time of the PC diagnosis versus not having the risk of PCSM was significantly decreased (AHR: 0.66 (95% CI: (0.45, 0.97);𝑃 = 0.033), whereas the risk of ACM was significantly increased (AHR: 2.92 (95% CI: 2.64, 3.23);𝑃 < 0.001) as shown in Table3. Given the differences shown in Table1that should have led to an increase in the risk of PCSM amongst men with versus without a prior cancer, these results suggest competing risks and non curative PC treatment accounted for the observed reduction in the risk of PCSM.
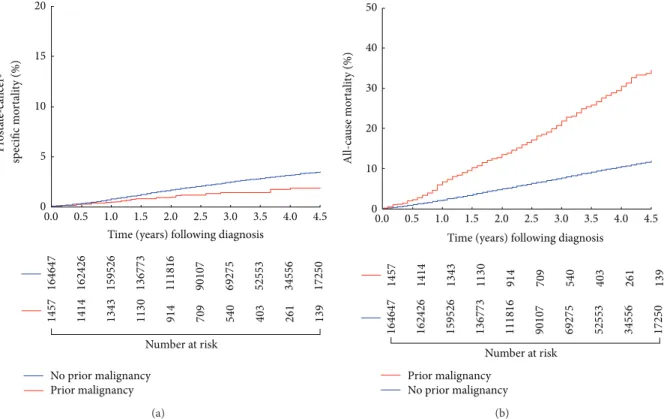
3.3. Estimates of PCSM and ACM Stratified by Prior History of Cancer. As shown in Figure1(a), the age-adjusted cumulative incidence of PCSM was significantly lower for men with a prior cancer as compared to those without a history of cancer prior to the PC diagnosis (𝑃 = 0.012) However, age adjusted estimates of all-cause mortality were significantly higher
(𝑃 < 0.001) for men with a prior cancer as compared to no prior cancer, as shown in Figure1(b).
4. Discussion
Overtreatment remains an issue in the United States for men with low-risk PC; a target population for whom greater use of AS may be more appropriate particularly in men with significant comorbidity [19]. Our results indicate that men who had a history of cancer prior to the diagnosis of PC were followed longer, were older, and were more likely to have GS 8 to 10 PC and undergo WW or AS compared with those who did not have a history of cancer. However, despite the less frequent use of curative treatment in these men who had more aggressive PC that should have led to an increased risk of PCSM, these men had a significant decrease in the risk of PCSM while their risk of ACM increased significantly, suggesting that competing risks (prior cancer and other comorbidities) and not curative PC treatment accounted for the reduction of PCSM. The clinical significance of these findings is that AS should be more judiciously employed in men with competing risks. Specifically, while men with low risk PC are offered AS if their life expectancy is less than 10 years as per the 2013 NCCN guidelines [20] for men with unfavorable-risk PC (i.e., intermediate or high-risk) where
20 15 10 5 0 No prior malignancy Prior malignancy
Time (years) following diagnosis
Number at risk 0.0 0.5 1.0 1.5 2.0 2.5 3.0 3.5 4.0 4.5 16 4647 16 24 26 15 95 26 13 6773 111816 90107 6927 5 52 55 3 34556 1725 0 14 57 14 14 13 43 113 0 91 4 70 9 540 403 261 139 P rost at e-ca n cer -sp ecific mo rt ali ty (%) (a) 20 10 0 Prior malignancy No prior malignancy
Time (years) following diagnosis
0.0 0.5 1.0 1.5 2.0 2.5 3.0 3.5 4.0 4.5 30 40 50 All-ca u se mo rt ali ty (%) Number at risk 16 46 47 16 24 26 15 95 26 13 6773 111816 90107 6927 5 52 55 3 34556 1725 0 14 57 14 14 13 43 113 0 91 4 70 9 540 403 261 139 (b)
Figure 1: (a) Age adjusted cumulative incidence estimates of prostate-cancer-specific mortality following prostate cancer diagnosis in men with or without a history of a prior malignancy𝑃 = 0.012. (b) Age adjusted estimates of overall survival or all-cause mortality estimates following prostate cancer diagnosis in men with or without a history of a prior malignancy𝑃 < 0.001.
AS would not be the preferred strategy by the existing NCCN guidelines, those who have had a prior cancer diagnosis should be considered for AS if the expected rate of cure of the prior CA is low.
Several points require further discussion. First, a recent study has shown that men with low-risk PC are more likely to be offered AS when seen in concurrent multidisciplinary setting rather than sequentially [21]. These results suggest that when a multidisciplinary team of physicians consult on a patient AS is more likely to be recommended. Second, investigators have attempted to define novel assays such as circulating tumor cell burden [22] and gene profiling [23, 24] that can stratify patients with castration resistant PC into cohorts with longer or shorter median survivals. Such tools are needed in men with low-risk PC in order to more appropriately select men for AS.
Third, men with a prior history of cancer as shown in Table1were more likely to be diagnosed with Gleason score 8 to 10 prostate cancer (19.2% versus 15.1%;𝑃 < 0.001). This likely reflects the fact that they were also significantly older at prostate cancer diagnosis (median age: 72 versus 66;𝑃 <
0.001) and advancing age has been shown to be associated with higher grade prostate cancer [25]. Also these men were more likely to be diagnosed at an earlier tumor stage (42% versus 37.5% T1c,𝑃 < 0.001), which may reflect more active medical monitoring with PSA screening given the history of the prior malignancy.
Potential limitations of this study include the inherent limitations associated with a SEER analysis, including lim-ited information about the biopsy specimen (number and extent of positive cores, tertiary Gleason grade 5, perineural invasion). Also, data on comorbidity other than a prior history of cancer is lacking. Nevertheless, the results of our analysis add to the ongoing dialogue about quantifying the impact competing risks can have on life expectancy when deciding on whether curative treatment is likely to benefit a patient with favorable-risk PC. Conversely, some men who are otherwise healthy with favorable-risk PC may require immediate curative treatment of PC as opposed to AS in order to avoid PCSM. In order to ascertain who these men are randomized controlled trials evaluating curative treatment compared to AS should employ a prerandomization strati-fication by comorbidity using a validated metric of comor-bidity [9] in order to assess whether treatment compared to AS benefits all men or only those with no or minimal comorbidity.
In conclusion, while an attempt is being made to offer men AS, the degree to which this has been occurring in the United States between 2004 and 2007 in men with a prior cancer does not appear to be adequate to avoid overtreatment. Therefore, an assessment of the impact that the prior cancer has on life expectancy is needed at the time of PC diagnosis to determine whether curative treatment for unfavorable-risk PC versus AS is appropriate.
6 ISRN Oncology
Conflict of Interests
The authors have no conflict of interests.
Acknowledgment
The authors would like to thank and acknowledge Dr. Leon Sun for providing them with the database and the description of the fields.
References
[1] A. V. D’Amico, R. Whittington, S. Bruce Malkowicz et al., “Biochemical outcome after radical prostatectomy, external beam radiation therapy, or interstitial radiation therapy for clinically localized prostate cancer,”The Journal of the American Medical Association, vol. 280, no. 11, pp. 969–974, 1998. [2] C. R. Pound, A. W. Partin, M. A. Eisenberger, D. W. Chan, J. D.
Pearson, and P. C. Walsh, “Natural history of progression after PSA elevation following radical prostatectomy,”The Journal of the American Medical Association, vol. 281, no. 17, pp. 1591–1597, 1999.
[3] D. C. Miller, K. S. Hafez, A. Stewart, J. E. Montie, and J. T. Wei, “Prostate carcinoma presentation, diagnosis, and staging: an update from the National Cancer Data Base,”Cancer, vol. 98, no. 6, pp. 1169–1178, 2003.
[4] T. Cassetti, F. Stracci, L. Minelli, M. Scheibel, I. E. Sapia, and F. La Rosa, “Metachronous malignancies in men with previous prostate cancer in Umbria, Italy, 1994–2003,”Tumori, vol. 94, no. 1, pp. 7–10, 2008.
[5] M. E. Charlson, P. Pompei, K. A. Ales, and C. R. MacKenzie, “A new method of classifying prognostic comorbidity in longitu-dinal studies: development and validation,”Journal of Chronic Diseases, vol. 40, no. 5, pp. 373–383, 1987.
[6] S. J. Freedland, W. J. Aronson, C. J. Kane et al., “Impact of obesity on biochemical control after radical prostatectomy for clinically localized prostate cancer: a report by the shared equal access regional cancer hospital database study group,”Journal of Clinical Oncology, vol. 22, no. 3, pp. 446–453, 2004.
[7] S. J. Freedland, L. Sun, C. J. Kane et al., “Obesity and oncolog-ical outcome after radoncolog-ical prostatectomy: impact of prostate-specific antigen-based prostate cancer screening: results from the shared equal access regional cancer hospital and Duke prostate center databases,”BJU International, vol. 102, no. 8, pp. 969–974, 2008.
[8] T. Ho, L. Gerber, W. J. Aronson et al., “Obesity, prostate-specific antigen nadir, and biochemical recurrence after radical prosta-tectomy: biology or technique? Results from the SEARCH database,”European Urology, vol. 62, no. 5, pp. 910–916, 2012. [9] J. F. Piccirillo, R. M. Tierney, I. Costas, L. Grove, and E.
L. Spitznagel Jr., “Prognostic importance of comorbidity in a hospital-based cancer registry,”The Journal of the American Medical Association, vol. 291, no. 20, pp. 2441–2447, 2004. [10] M. Van Hemelrijck, L. Drevin, L. Holmberg, H. Garmo, J.
Adolfsson, and P. Stattin, “Primary cancers before and after prostate cancer diagnosis,”Cancer, vol. 118, no. 24, pp. 6207– 6216, 2012.
[11] E. Surveillance and End Results (SEER) Program, National Cancer Institute, DCCPS, Surveillance Research Program, Cancer Statistics Branch, SEER∗Stat Database: Incidence— SEER 17 Regs Research Data + Hurricane Katrina Impacted
Louisiana Cases, Nov 2010 Sub (1973–2008 varying)—Linked To County Attributes—Total U.S., 1969–2009 Counties, 2010,
http://www.seer.cancer.gov/.
[12] J. P. Fine and R. J. Gray, “A proportional hazards model for the sub distribution of a competing risk,”Journal of the American Statistical Association, vol. 94, no. 446, pp. 496–509, 1999. [13] M. Hollander and D. A. Wolfe’s, Nonparametric Statistical
Methods, John Wiley & Sons, New York, NY, USA, 2nd edition, 1999.
[14] A. Agresti,Categorical Data Analysis, John Wiley & Sons, New York, NY, USA, 2nd edition, 2002.
[15] J. P. Klein and M. L. Moeschberger,Survival Analysis, Springer, New York, NY, USA, 2nd edition, 2003.
[16] J. J. Gaynor, E. J. Feuer, C. C. Tan et al., “On the use of cause-specific failure and conditional failure probabilities: examples from clinical oncology data,”Journal of the American Statistical Association, vol. 88, pp. 400–409, 1993.
[17] E. L. Kaplan and P. Meier, “Nonparametric estimation from incomplete observations,” Journal of the American Statistical Association, vol. 53, pp. 447–457, 1958.
[18] L. A. Cupples, D. R. Gagnon, R. Ramaswamy, and R. B. D’Agostino, “Age-adjusted survival curves with application in the Framingham Study,”Statistics in Medicine, vol. 14, no. 16, pp. 1731–1744, 1995.
[19] D. C. Miller, S. B. Gruber, B. K. Hollenbeck, J. E. Montie, and J. T. Wei, “Incidence of initial local therapy among men with lower-risk prostate cancer in the United States,”Journal of the National Cancer Institute, vol. 98, no. 16, pp. 1134–1141, 2006. [20] J. L. Mohler, A. J. Armstrong, R. R. Bahnson et al., “Prostate
can-cer, version 3.2012: featured updates to the NCCN guidelines,”
Journal of the National Comprehensive Cancer Network, vol. 10, no. 9, pp. 1081–1087, 2012.
[21] A. A. Aizer, J. J. Paly, A. L. Zietman et al., “Multidisciplinary care and pursuit of active surveillance in low-risk prostate cancer,”
Journal of Clinical Oncology, vol. 30, no. 25, pp. 3071–3076, 2012. [22] D. T. Miyamoto, R. J. Lee, S. L. Stott et al., “Androgen receptor signaling in circulating tumor cells as a marker of hormonally responsive prostate cancer,”Cancer Discovery, vol. 2, no. 11, pp. 995–1003, 2012.
[23] M. L. Liong, C. R. Lim, H. Yang et al., “Blood-based biomarkers of aggressive prostate cancer,”PLoS One, vol. 7, no. 9, Article ID e45802, 2012.
[24] D. Olmos, D. Brewer, J. Clark et al., “Prognostic value of blood mRNA expression signatures in castration-resistant prostate cancer: a prospective, two-stage study,”The Lancet Oncology, vol. 13, no. 11, pp. 1114–1124, 2012.
[25] A. L. Russo, M. H. Chen, A. A. Aizer, J. A. Hattangadi, and A. V. D’Amico, “Advancing age within established Gleason score categories and the risk of prostate cancer-specific mortality (PCSM),”BJU International, vol. 110, no. 7, pp. 973–979, 2012.