GENETIC DETERMINANTS OF TAC
CHEMOTHERAPY RESPONSE IN TRIPLE
NEGATIVE BREAST CANCER PATIENTS
AHMAD AIZAT BIN ABDUL AZIZ
UNIVERSITI SAINS MALAYSIA
GENETIC DETERMINANTS OF TAC
CHEMOTHERAPY RESPONSE IN TRIPLE
NEGATIVE BREAST CANCER PATIENTS
by
AHMAD AIZAT BIN ABDUL AZIZ
Thesis submitted in fulfillment of the requirements for the degree of
Doctor of Philosophy
ii
ACKNOWLEDGEMENTS
I would like to say Alhamdulillah, for giving me the strength, good health and patience in completing this study
I would like to express my greatest appreciation and gratitude to my supervisor, Professor (Dr) Ravindran Ankathil, Human Genom Centre, USM for his supervision, continuous support and also for his trust in me throughout my study. Thank you for being a great supervisor in giving a lot of opportunities and encouragement for me to improve my skills and gaining new knowledge during my study period. May God bless you.
I also would like to convey my gratitude to my co-supervisors, Professor Gan Siew Hua, Assoc Professor Dr Md Salzihan Md Salleh and Dr VMK Bhavaraju for their encouragement, kind supervision and assistance during this study. My sincere thanks also goes to the co-researches in this study, Assoc.Prof Dr Andee Dzulkarnaen Zakaria, Dr Maya Mazuwin Yahaya, Dr Ibtisam Mohamad and also Professor Dr Norsa’adah Bachok and Dr Ismail Ibrahim for their help in statistical analysis. Also i would like to the HUSM staff, Pn Roziatun Bt Mohd Ghani, Pn Jamaliah Lin and Engku Syera for their contribution and assistance in TNBC patients recruitment and sample collection.
I also would like to acknowledge Assoc. Prof Dr Sarina Sulong, Director of Human Genome Centre and lecturers, Dr Nazihah Yunus, Dr Tan Huay Lin for their valuable discussion on laboratory works, skills and knowledge in area of study.
iii
This study was supported partially by Research University (Team) (RUT) (1001/PPSP/853005) grant of Universiti Sains Malaysia. I am also deeply indebted to School of Medical Sciences (especially Human Genome Centre) for providing all the research facilities in order to complete this study. I am also grateful to the Ministry of Education for awarding me the MyBrain 15-My Phd scholarship from 2014-2017. Many thanks to Human Genome Centre staff Mr Mohd Ros, Ms Nor Atifah, Mr Chia, Ms Siti Mariam, Ms Alia, Ms Hidayah, Mr Nik, Mr Qais, Mr Zaki, Ms Hafizah, Pn Zulaikha, Ms Asraihan, Cik Faten and HGC students, Dr Murtala, Dr Aziati, Dr Fatimah, Dr Eva, Dr Rose, Dr Tan Shing Cheng, Najlaa, Maziras, Kak Yati, Kak Sha, Sathiya, Roslina, Sabrina, Fazreen, Syidah, Ninie, Sarifah, Ameirah, Pei and other students for their continuous supports, stimulating discussion and knowledge throughout my study period.
I would to express my special thanks to my father Abdul Aziz B Ab Ghani, my mother, Noriah Bt Omar, my wife (Ms Ashuvila), my daughter (Nur Iman Damia’), my siblings (Nur Izzati, Ahmad Faris, Ahmad Firdaus and Nur Ainun) as well as my friends for their understanding and being supportive and encouraging throughout my study.
Finally, I would like to thank every person (if I had left out to name) who had contributed and involved in this study.
iv
TABLE OF CONTENTS
Acknowledgements ii
Table of Contents iv
List of Tables xiv
List of Figures xviii
List of Appendices xxiii
List of Abbreviations xxiv
Abstrak xxxi
Abstract xxxiii
CHAPTER 1 INTRODUCTION 1
1.1 Breast cancer 1
1.2 The incidence and prevalenve of breast cancer 2
1.3 Breast cancer subtypes 3
1.4 Breast cancer risk factors 3
1.5 Screening and diagnosis of breast cancer 6
1.6 Histological staging and grading 7
1.7 Management and treatment of breast cancer 10
1.8 Breast cancer prevention 12
1.9 Present study: Problem statement 13
1.9.1 Genetic determinants of variable chemotherapy response
and recurrence risk
15
1.9.2 Objective(s) of the study 20
v
CHAPTER 2 LITERATURE REVIEW 22
2.1 Triple negative breast cancer (TNBC) 22
2.1.1 Incidence of TNBC 23
2.1.2 Risk factors associated with TNBC 24
2.1.3 Molecular, histological subtypes and clinical presentation of TNBC
26
2.1.4 Treatment for TNBC 27
2.2 Adjuvant chemotherapy: docetaxel, doxorubicin and
cyclophosphamide (TAC) regimen
28
2.3 Drug resistance 30
2.4 Cytochrome P450 enzymes (CYPs) 37
2.4.1 Cytochrome P450 family 1 subfamily B member 1 38
2.4.1(a) CYP1B1 polymorphisms and their
associationwith drug response/resistance
39
2.4.1(b) CYP1B1 mRNA expression and its association
with drug response/resistance
41
2.4.2 Cytochrome P450 (CYP) family 3 subfamily A (CYP3A) 42
2.4.2(a) CYP3A4 and CYP3A5 polymorphisms and their
association with drug response/resistance
43
2.4.2(b) CYP3A4 and CYP3A5 mRNA expression and
association with drug response/resistance
45
2.5 Adenosine triphosphate (ATP) binding cassette (ABC) subfamily B
member 1 (ABCB1)
vi
2.5.1 ABCB1 polymorphisms and their association with drug
response/resistance
48
2.5.2 ABCB1 mRNA expression and its association with
treatment response 51 2.6 MicroRNA (miRNA) 52 2.6.1 miR-21 54 2.6.2 miR-27b 57 2.6.3 miR-34a 58 2.6.4 miR-182 60 2.6.5 miR-200c 61 2.6.6 miR-451 62
CHAPTER 3 MATERIALS AND METHODS 64
3.1 Study design 64
3.2 Sample size calculation 64
3.3 Patients recruitment 65
3.4 Collection of pathological data and evaluation of treatment response 66
3.5 Sample collection 68
3.6 Genetic association study 68
3.6.1 Genomic DNA extraction 68
3.6.2 DNA concentration and quality 69
3.6.3 Single nucleotide polymorphisms (SNPs) genotyping 70
3.6.3(a) Allele specific PCR (AS-PCR) 73
3.6.3(b) Restriction Fragment Length Polymorphism (RFLP)
vii
3.7 Agarose gel preparation 74
3.8 Gel electrophoresis protocol 76
3.9 PCR product purification and DNA sequencing 76
3.10 mRNA and miRNA expression levels 77
3.10.1 Total RNA extraction 77
3.10.2 Total RNA extraction concentration and quality 79
3.10.3 cDNA synthesis 79
3.10.4 Pre-amplification of cDNA 80
3.10.5 Quantitative reverse transcription polymerase chain reaction (qRT-PCR)
82
3.10.6 mRNA expression analysis of CYP1B1, CYP3A4, CYP3A5
and ABCB1 83 3.10.7 miRNA RT-PCR 84 3.10.8 miRNA pre-amplification PCR 85 3.10.9 miRNA qRT-PCR 87 3.11 Statistical analysis 88 CHAPTER 4 RESULTS 90
4.1 Characteristics of study subjects 90
4.2 Results for AS-PCR and PCR-RFLP analysis 91
4.2.1 Visualization of AS-PCR of CYP1B1 142 C>G
polymorphism
92
4.2.2 Visualization of PCR-RFLP of CYP1B1 4326 C>G
polymorphism
viii
4.2.3 Visualization of PCR-RFLP of CYP1B1 4390 A>G
polymorphism
94
4.2.4 Visualization of PCR-RFLP of CYP3A4 878 T>C
polymorphism
95
4.2.5 Visualization of PCR-RFLP of CYP3A5 6986A>G
polymorphism
96
4.2.6 Visualization of PCR-RFLP of ABCB1 1236 C>T
polymorphism
97
4.2.7 Visualization of PCR-RFLP of ABCB1 2677 G>T/A
polymorphism
98
4.2.8 Visualization of PCR-RFLP of ABCB1 3435 C>T
polymorphism
99
4.3 Genotype and allele frequencies of investigated polymorphisms in
chemotherapy response and chemoresistant groups of TNBC patients
100
4.3.1 Genotype and allele frequencies of CYP1B1 142 C>G, 4326 C>G and 4390 A>G polymorphisms in chemotherapy response and chemoresistant groups of TNBC patients
100
4.3.2 Genotype and allele frequencies of CYP3A4 878 T>C and
CYP3A5 6986 A>G polymorphisms in chemotherapy
response and chemoresistant groups of TNBC patients
103
4.3.3 Genotype and allele frequencies of ABCB1 1236 C>T, 2677
G>T and 3435 C>T polymorphisms in chemotherapy
response and chemoresistant groups of TNBC patients
105
ix
4.4.1 Association of CYP1B1 142 C>G, 4326 C>G and 4390 A>G polymorphisms with chemotherapy response
108
4.4.2 Association of CYP3A4 878 T>C and CYP3A5 6986 A>G
polymorphisms with chemotherapy response
111
4.4.3 Association of ABCB1 1236 C>T, 2677 G>T and 3435 C>T polymorphisms with chemotherapy resistance
113
4.4.4 Association of 21 combination polymorphic genotypes with
chemotherapy response
115
4.5 LD and haplotype analysis 127
4.5.1 Haplotype frequencies in chemoresistant and
chemoresponse groups
128
4.5.2 Association of haplotypes with chemotherapy response 128
4.6 Analysis of gene expressions in cancerous and normal adjacent tissues of triple negative breast cancer patients
131
4.6.1 Clinicopathological data of TNBC tissues 131
4.6.2 CYP1B1, CYP3A4, CYP3A5 and ABCB1 mRNA expression
analysis
132
4.6.3 Relative expression of CYP1B1, CYP3A4, CYP3A5 and
ABCB1 in cancerous versus normal adjacent tissues
134
4.6.4 Relative expression level of CYP1B1 with
clinicopathological parameters
135
4.6.5 Relative expression level of ABCB1 with
clinicopathological parameters
135
4.6.6 Difference in relative expression of CYP1B1 and ABCB1 in cancerous tissues based on clinicopathological variables
x
4.6.7 Relative expression level of CYP1B1 and ABCB1 in
chemoresistant versus chemoresponder groups
138
4.6.8 Relationship between genetic polymorphisms and gene
expression levels
141
4.7 miRNAs expression analysis 142
4.7.1 The relative miRNAs expression in cancerous and normal
adjacent tissues of triple negative breast cancer patients
143
4.7.2 The relative expression levels of candidate miRNAs in cancerous versus normal adjacent tissues of different histological subtypes
144
4.7.3 The relative expression levels of miRNAs in cancerous versus normal adjacent tissues of patients with different stages of TNBC
144
4.7.4 The relative expression levels of miRNAs in cancerous versus normal adjacent tissues of TNBC patients with different histology grading
147
4.7.5 The relative expression levels of the miRNAs in cancerous
versus normal adjacent tissues of premenopausal and postmenopausal TNBC patients
147
4.7.6 The relative expression levels of miRNAs in cancerous versus normal adjacent tissues based on lymph node metastasis
150
4.7.7 Relative expression levels of miRNAs among different
clinicopathological variables
xi
4.7.8 The relative expression of miRNAs in chemotherapy
resistant versus chemoresponder groups
155
4.8 Survival analysis: Patient demographic details, polymorphism,
clinicopathological variables on relape-free survival (RFS) and overall survival (OS) of TNBC patients
156
4.8.1 RFS of TNBC patients 156
4.8.2 OS of TNBC patients 177
CHAPTER 5 DICUSSION 196
5.1 Age, incidence and clinicopathological data of TNBC patients 196
5.2 PCR-RFLP and AS-PCR methods 199
5.3 Genetic variation and chemotherapy response 200
5.3.1 CYP1B1 polymorphisms and chemotherapy response 201
5.3.2 CYP3A4 and CYP3A5 polymorphisms and chemotherapy
response
205
5.3.3 ABCB1 polymorphisms and chemotherapy response 209
5.3.4 Genotype combination of the polymorphisms and
association with treatment response
214
5.4 LD and haplotype analysis 215
5.4.1 LD and haplotype analysis of CYP1B1 216
5.4.2 LD and haplotype analysis of CYP3A4 and CYP3A5 217
5.4.3 LD and haplotype analysis of ABCB1 218
5.5 Expression analysis 220
5.5.1 Techniques used: Total RNA extraction from FFPE
samples
xii
5.5.2 qRT-PCR method 222
5.5.3 mRNA expression 223
5.5.3(a) CYP1B1 mRNA expression and treatment
response
225
5.5.3(b) CYP3A4 and CYP3A5 mRNA expressions 227
5.5.3(c) ABCB1 mRNA expression and treatment
response
229
5.5.4 Influence of genetic variations on gene expression 232
5.6 miRNA expression 234
5.6.1 miR-21 and chemotherapy response 235
5.6.2 miR-27b and chemotherapy response 238
5.6.3 miR-34a and chemotherapy response 240
5.6.4 miR-182 and chemotherapy response 243
5.6.5 miR-200c and chemotherapy response 245
5.6.6 miR-451 and chemotherapy response 247
5.7 Survival analysis based on clinicopathological variables, candidate
polymorphisms, mRNA and miRNA expression levels in TNBC patients
250
5.7.1 Association between clinicopathological variables and RFS
and OS in TNBC patients
251
5.7.2 Association between genetic polymorphisms and RFS and
OS
252
5.7.3 Association of mRNA and miRNA expression levels with
RFS and OS in TNBC patients
xiii
CHAPTER 6 SUMMARY AND CONCLUSION 263
6.1 Summary of findings 263
6.2 Limitations of the present study 266
6.3 Strengths and novelty of the study 268
6.4 Future recommendations 269 6.5 Conclusion 272 REFERENCES 273 APPENDICES LIST OF PRESENTATIONS LIST OF PUBLICATIONS LIST OF AWARDS RECEIVED
xiv
LIST OF TABLES
Page
Table 1.1 American Joint Commission on Cancer (7th Edition, 2009)
guidelines-tumour node metastasis (TNM) classification
8
Table 1.2 Clinical staging- American Joint Commission on Cancer
(7th Edition, 2009) guidelines
9
Table 3.1 Composition of PCR mixture 71
Table 3.2 PCR conditions for genotyping of the selected SNPs 71
Table 3.3 List of primer sequences and amplicon sizes 72
Table 3.4 Composition of RFLP reaction mixture 74
Table 3.5 List of restriction enzymes, incubation temperatures, time
and expected band sizes in RFLP analysis
75
Table 3.6 Composition of reaction mixture for reverse transcription
of total RNA
80
Table 3.7 ABI inventoried Taqman ® gene expression assays 81
Table 3.8 Composition of pre-amplification reaction mixture 81
Table 3.9 cDNA pre-amplification PCR conditions 82
Table 3.10 Composition of qRT-PCR reaction mixture 84
Table 3.11 qRT-PCR thermal cycling conditions 84
Table 3.12 ABI inventoried Taqman® miRNA expression assays 85
Table 3.13 Composition of miRNA RT-PCR reaction mixture 86
Table 3.14 Composition of miRNA pre-amplification reaction mixture
86
Table 3.15 miRNA pre-amplification thermal cycling conditions 86
xv
Table 3.17 miRNA qRT-PCR thermal cycling conditions 88
Table 4.1 Clinicopathological data of TNBC patients 90
Table 4.2 Genotype and allele frequency of CYP1B1 142 C>G, 4326
C>G and 4390 A>G polymorphisms in chemotherapy resistant and chemoresponder groups of TNBC patients
102
Table 4.3 Genotype and allele frequency of CYP3A4 878 T>C and
CYP3A5 6986 A>G polymorphisms in chemotherapy
response and chemoresistant groups of TNBC patients
104
Table 4.4 Genotype and allele frequency of ABCB1 1236 C>T,
2677G>T and 3435 C>T polymorphisms in chemotherapy response and chemoresistant groups of TNBC patients
107
Table 4.5 Genetic association of CYP1B1 polymorphisms with
chemotherapy response
110
Table 4.6 Genetic association of CYP3A4 878 T>C and CYP3A5
6986 A>Gpolymorphisms with chemotherapy response
112
Table 4.7 Genetic association of ABCB1 1236 C>T, ABCB1 2677
G>T and ABCB1 3435 C>T polymorphisms with
chemotherapy response
114
Table 4.8 Association of 21 combinations of the investigated
polymorphisms with chemotherapy response
116
Table 4.9 Haplotype frequencies in chemotherapy resistant and
chemoresponse groups of TNBC patients
129
Table 4.10 Association of investigated haplotypes with chemotherapy response in TNBC patients
130
xvi
Table 4.12 The PCR efficiency, slope and correlation for mRNA expression
133
Table 4.13 The number of Ct value (40 cycles) detected in cancerous and normal adjacent tissues of TNBC patients
133
Table 4.14 Relative expression of CYP1B1 and association with
clinicopathological parameters
136
Table 4.15 The relative expression of ABCB1 and their association with the clinicopathological parameters
137
Table 4.16 Relative expression of CYP1B1 and ABCB1 in cancerous
tissues on clinicopathological variables
139
Table 4.17 Relationship between genetic polymorphisms and gene expression levels
141
Table 4.18 The PCR efficiency, slope and correlation for miRNA expressions
142
Table 4.19 Relative expression level ratio of the miRNAs in cancerous versus normal adjacent tissues based on different histological subtypes
145
Table 4.20 Relative expression levels of miRNAs in cancerous versus normal adjacent tissues at different stages
146
Table 4.21 Relative expression levels of the miRNAs in cancerous vs. normal adjacent tissues of TNBC patients with different histological grading
148
Table 4.22 Relative expression levels of the miRNAs in cancerous vs.
normal adjacent tissues of premenopausal and
postmenopausal TNBC patients
xvii
Table 4.23 Relative expression levels of miRNAs in cancerous vs. normal adjacent tissues of patients with axillary lymph node metastasis
151
Table 4.24 Relative expression level of miRNAs among different clinicopathological variables
153
Table 4.25 Univariate analysis on clinicopathological variables and SNPs of TNBC patients and risk of relapse
171
Table 4.26 Univariate Cox analysis on mRNA and miRNA expression levels of TNBC patients and risk of relapse
174
Table 4.27 Multivariate Cox analysis on clinicopathological variables and genetic variables of TNBC patients and risk of relapse
175
Table 4.28 Univariate analysis on clinicopathological variables and SNPs of TNBC patients and risk of death
191
Table 4.29 Univariate Cox analysis on mRNA and miRNA expression
levels of TNBC patients and risk of death
194
Table 4.30 Multivariate Cox analysis of TNBC patients and risk of death
xviii
LIST OF FIGURES
Page
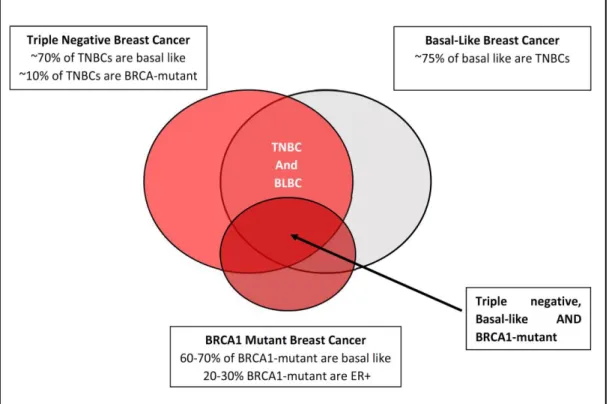
Figure 2.1 Similarities of TNBC, BLBC and BRCA-1 breast cancer 23
Figure 2.2 Six mechanisms involved in TNBC chemoresistance 36
Figure 3.1 Flow chart of the study design 67
Figure 4.1 Gel picture showing AS-PCR amplicons of CYP1B1 142
C>G polymorphism
92
Figure 4.2 Gel picture showing different genotype patterns of
CYP1B1 4326 C>G polymorphism
93
Figure 4.3 Gel picture showing the homozygous wildtype genotype
of CYP1B1 4390 A>G polymorphism
94
Figure 4.4 Gel picture showing different genotype patterns of
CYP3A4 878 T>C polymorphism
95
Figure 4.5 Gel picture showing different genotype patterns of
CYP3A5 6986 A>Gpolymorphism
96
Figure 4.6 Gel picture showing different genotype patterns of
ABCB1 1236 C>T polymorphism
97
Figure 4.7a Gel picture showing different genotype patterns of
ABCB1 2677 G>T polymorphism
98
Figure 4.7b Gel picture showing different genotype patterns of
ABCB1 2677 G>A polymorphism
98
Figure 4.8 Gel picture showing different genotype patterns of
ABCB1 3435 C>T polymorphism
99
xix
Figure 4.10 Box plot showing relative expression of CYP1B1,
CYP3A4, CYP3A5 and ABCB1 in cancerous versus
normal adjacent tissues.
134
Figure 4.11 Box plot showing the relative expression levels of
CYP1B1 and ABCB1 with chemotherapy response
140
Figure 4.12 Box plot showing the relative expression of miRNA
levels in cancerous and normal adjacent tissues
143
Figure 4.13 Box plot showing the relative expression of miRNAs in
chemoresistant versus chemoresponder group of TNBC patients
155
Figure 4.14 5-year cumulative RFS analysis of TNBC patients using
Kaplan-Meier survival analysis
158
Figure 4.15 Kaplan Meier curve of RFS probability of TNBC patients
according to age groups
158
Figure 4.16 Kaplan Meier curve of RFS probability of TNBC patients
according to histology types
159
Figure 4.17 Kaplan Meier curve of RFS probability of TNBC patients
according to tumour histograde
159
Figure 4.18 Kaplan Meier curve of RFS probability of TNBC patients
according to tumour stage
160
Figure 4.19 Kaplan Meier curve of RFS probability of TNBC patients
according to axillary lymph node metastasis
160
Figure 4.20 Kaplan Meier curve of RFS to menopausal status 161
Figure 4.21 Kaplan Meier curve of RFS probability of TNBC patients
according to CYP1B1 142 C>G polymorphism
xx
Figure 4.22 Kaplan Meier curve of RFS probability of TNBC patients
according to CYP1B1 4326 C>G polymorphism
162
Figure 4.23 Kaplan Meier curve of RFS probability of TNBC patients
according to CYP3A4 878 T>C polymorphism
162
Figure 4.24 Kaplan Meier curve of RFS probability of TNBC patients
according to CYP3A5 6986 A>G polymorphism
163
Figure 4.25 Kaplan Meier curve of RFS probability of TNBC patients
according to ABCB1 1236 C>T polymorphism
163
Figure 4.26 Kaplan Meier curve of RFS probability of TNBC patients
according to ABCB1 2677 G>T polymorphism
164
Figure 4.27 Kaplan Meier curve of RFS probability of TNBC patients
according to ABCB1 3435 C>T polymorphism
164
Figure 4.28 Kaplan Meier curve of RFS probability of TNBC patients
according to CYP1B1 expression level
165
Figure 4.29 Kaplan Meier curve of RFS probability of TNBC patients
according to ABCB1 expression level
165
Figure 4.30 Kaplan Meier curve of RFS probability of TNBC patients
according to miR-21 expression level
166
Figure 4.31 Kaplan Meier curve of RFS probability of TNBC patients
according to miR-27b expression level
166
Figure 4.32 Kaplan Meier curve of RFS probability of TNBC patients
according to miR-34a expression level
167
Figure 4.33 Kaplan Meier curve of RFS probability of TNBC patients
according to miR-182 expression level
xxi
Figure 4.34 Kaplan Meier curve of RFS probability of TNBC patients
according to miR-200c expression level
168
Figure 4.35 Kaplan Meier curve of RFS probability of TNBC patients
according to miR-451 expression level
168
Figure 4.36 5-year cumulative OS of TNBC patients using Kaplan-Meier survival analysis
179
Figure 4.37 Kaplan Meier curve of OS probability of TNBC patients
according to age groups
179
Figure 4.38 Kaplan Meier curve of OS probability of TNBC patients
according to histology types
180
Figure 4.39 Kaplan Meier curve of OS probability of TNBC patients
according to histology grade
180
Figure 4.40 Kaplan Meier curve of OS probability of TNBC patients
according to tumour staging
181
Figure 4.42 Kaplan Meier curve of OS probability of TNBC patients
according to axillary lymph node metastasis
181
Figure 4.42 Kaplan Meier curve of OS probability of TNBC patients
according to menopausal status
182
Figure 4.43 Kaplan Meier curve of OS probability of TNBC patients
according to CYP1B1 142 C>G polymorphism
182
Figure 4.44 Kaplan Meier curve of OS probability of TNBC patients
according to CYP1B1 4326 C>G polymorphism
183
Figure 4.45 Kaplan Meier curve of OS probability of TNBC patients
according to CYP3A4 878 T>C polymorphism
xxii
Figure 4.46 Kaplan Meier curve of OS probability of TNBC patients
according to CYP3A5 6986 A>G polymorphism
184
Figure 4.47 Kaplan Meier curve of OS probability of TNBC patients
according to ABCB1 1236 C>T polymorphism
184
Figure 4.48 Kaplan Meier curve of OS probability of TNBC patients
according to ABCB1 2677 G>T polymorphism
185
Figure 4.49 Kaplan Meier curve of OS probability of TNBC patients
according to ABCB1 3435 C>T polymorphism
185
Figure 4.50 Kaplan Meier curve of OS probability of TNBC patients
according to CYP1B1 expression level
186
Figure 4.51 Kaplan Meier curve of OS probability of TNBC patients
according to ABCB1 expression level
186
Figure 4.52 Kaplan Meier curve of OS probability of TNBC patients
according to miR-21 expression level
187
Figure 4.53 Kaplan Meier curve of OS probability of TNBC patients
according to miR-27b expression level
187
Figure 4.54 Kaplan Meier curve of OS probability of TNBC patients
according to miR-34a expression level
188
Figure 4.55 Kaplan Meier curve of OS probability of TNBC patients
according to miR-182 expression level
188
Figure 4.56 Kaplan Meier curve of OS probability of TNBC patients
according to miR-200c expression level
189
Figure 4.57 Kaplan Meier curve of OS probability of TNBC patients
according to miR-451 expression level
xxiii
LIST OF APPENDICES
APPENDIX A Ethical Approval From Hospital USM
APPENDIX B Ethical Approval From NMRR
APPENDIX C Patients Information and Consent Form
APPENDIX D Polymorphic Genotype of the Study Subjects
APPENDIX E Clinicopathological Variables of Study Subjects
APPENDIX F Research Questionaire
xxiv LIST OF ABBREVIATIONS oC ‘Degree Celcius’ % Percent µL Microlitre µM Micromolar 5-FU 5-Fluorouracil
A260/230 Absorbance At 260 Nm And 230 Nm
A260/280 Absorbance At 260 Nm And 280 Nm
ABC ATP-Binding Cassette
ABCB1 ATP-Binding Cassette Subfamily B Member 1
AC Adriamycin And Cyclophosphamide
AC-T Adriamycin, Cyclophosphamide, Taxane
ADR Adriamycin
AE Elution Buffer
AhRR Aryl Hydrocarbon Receptor Repressor
AKT Protein Kinase B
AL Lysis Buffer
AP-1 Activator Protein 1
ARNT Aryl Receptor Nuclear Translocator
AS-PCR Allele Specific-Polymerase Chain Reaction
ATP Adenosine Triphosphate
AUC Area Under Curve
AW1 Washing Buffer 1
xxv
BCl2 B-Cell Lymphoma 2
BLAST Basic Local Alignment Search Tool
BLBC Basal Like Breast Cancer
BMI Body Mass Index
BmiI Polycomb Complex Protein
bp Base Pair
BRCA 1 Breast Cancer Gene 1
BRCA 2 Breast Cancer Gene 2
CAF Cyclophosphamide, Adriamycin and Fluorouracil
CBLB E3 Ubiquitin-Protein Ligase
CCND1 Cyclin-D1
CCNG1 Cyclin-G1
CDK6 Cell Division Protein Kinase 6
cDNA Complementary Deoxyribonucleic Acid
CIs Confidence Intervals
CMF Cyclophosphamide, Methotrexate, and Fluorouracil
COX Cyclooxygenase
COX-1 Cyclooxygenase-2
CREB1 Camp Responsive Element Binding Protein 1
Ct Cycle Threshold
CT scan Computed Tomography scan
CYP1B1 Cytochrome P450 Family 1 Subfamily B Member 1
CYP3A4 Cytochrome P450 Family 3 Subfamily A Member 4
CYP3A5 Cytochrome P450 Family 3 Subfamily A Member 5
xxvi
D’ Coefficient of Linkage Disequilibrium
DCIS Ductal Carcinoma In Situ
DFS Disease-Free Survival
DNA Deoxyribonucleic Acid
dNTPs Deoxyribonucleotide Triphosphate
DOX Doxorubicin
DPD Dihydropyrimidine Dehydrogenase
EB Elution Buffer
EDTA Ethylenediaminetetraacetic Acid
EMT Epithelial-Mesenchymal Transition
ENPP1 Ectonucleotide Pyrophosphatase/Phosphodiesterase 1
ER Oestrogen receptor
FAS-L First Apoptosis Signal Ligand
FB-XW7 F-Box And WD Repeat Domain-Cointaning 7
FEC Fluorouracil (5FU), Epirubicin And Cyclophosphamide
FFPE Formalin-Fixed Paraffin Embedded
FOX1 Forkhead Box 1
FOXF2 Forkhead Box F2
FOXO1 Forkhead Box Protein O1
FOXO3 Forkhead Box O3
FRA17B Fragile Site, Aphidicolin Type, Common, Fra(17)(Q23.1)
g Gram
GAPDH Glyceraldehyde 3-Phosphate Dehydrogenase
GRB2 Growth Factor Receptor-Bound Protein 2
xxvii
HOTAIR Hox Antisense Intergenic RNA
HR Hazard Ratio
HSF2 Heat Shock Transcription Factor 2
HVP16 Human Papillomavirus 16
IDC-NOS Invasive Ductal Carcinoma-No Otherwise Specified
JFCR Japanese Foundation of Cancer Research
kb Kilobase
LD Linkage Disequilibrium
mA Milliampere
MDR Multidrug Resistance
MgCl2 Magnesium Chloride
MIM Missing In Metastasis
miRNAs MicroRNAs
MITF Melanogenesis Associated Transcription Factor
mL Millilitre
MLH1 MutL protein homolog 1
mM Millimolar
MMIF Macrophage Migration Inhibitory Factor
MREC Medical Research and Ethics Committee
MRI Magnetic Resonance Imaging
mRNAs Messenger RNAs
MSH2 MutS protein homolog 2
MSI Microsatellite Instability
MTSS1 Metastasis Suppressor 1
xxviii
NF-κB Nuclear Factor-Kappa B
ng Nanogram
NOTCH1 Notch Homolog 1
NR5A2 Nuclear Receptor Subfamily 5, Group A, Member 2
NW Washing buffer
OR Odds Ratio
OS Overall Survival
PARP1 Poly-ADP Ribose Polymerase 1
PB Binding buffer
pCR Pathological Complete Response
PCR Polymerase Chain Reaction
PCR-RFLP
Polymerase Chain Reaction- Restriction Fragment Length Polymorphism
PDCD4 Programmed Cell Death 4
P-gp Permeability-Glycoprotein
PR Progesterone receptor
PRC2 Polycomb Repressive Complex 2
PRKD1 Protein Kinase D1
PTEN Phosphatase And Tensin Homolog
qRT-PCR Quantitative Reverse Transcription-Polymerase Chain Reaction
r2 Coefficient of Determination
RAB14 Ras-Related Protein
RECK Reversion Inducing Cysteine Rich Protein With Kazal Motifs
REST Relative Expression Software Tools
xxix
RIN RNA Integrity Number
RNA Ribonucleic Acid
rpm Revolutions Per Minute
SD Standard Deviation
SE Standard Error
SNPs Single Nucleotide Polymorphisms
SPSS Statistical Package For The Social Sciences
TAC Taxane, Adriamycin, Cyclophosphamide
TBE Tris-Boric Acid EDTA
TCGA The Cancer Genome Atlas
TE Tris EDTA
TGF-β1 Transforming Growth Factor Beta 1
TIMP1 Timp Metallopeptidase Inhibitor 1
TMEM49 Transmembrane Protein-49
TNBC Triple Negative Breast Cancer
TNM Tumour-Node-Metastasis
TPM1 Tropomyosin 1
TrKB Tropomyosin Receptor Kinase B
TSS Transcription Start Site
TUBB3 Tubulin Beta 3 Class III
U Unit
UTR Untranslated Region
UV Ultra Violet
V Voltage
xxx YWHAZ
Tyrosine 3-Monooxygenase/Tryptophan 5-Monooxygenase Activation Protein Zeta
ZEB1 Zinc Finger E-Box Binding Homeobox 1
xxxi
PENENTU GENETIK DALAM TINDAK BALAS TAC KEMOTERAPI DALAM PESAKIT KANSER PAYUDARA TIGA KALI NEGATIF
ABSTRAK
Kanser payudara tiga kali negatif (TNBC), salah satu subtip dalam kanser payudara yang dikategorikan sebagai fenotip yang agresif, kadar ulangan yang tinggi dan prognosis yang buruk dan merupakan cabaran klinikal yang penting kerana kekurangan terapi yang khusus. Walaupun, pesakit TNBC dirawat dengan regimen kemoterapi taxane, adriamycin dan cyclophosphamide (TAC), kerintangan ubatan dan pertumbuhan tumor ulangan adalah halangan utama dalam rawatan TNBC. Penanda prognostik bagi TNBC masih sukar difahami. Kajian ini dijalankan untuk menyelidik
kesan SNP yang dipilih CYP1B1 142 C> G (rs10012), 4326 C> G (rs1056836) dan
4390 A> G (rs1800440), CYP3A4 878 T> C (rs28371759), CYP3A5 6986 A > G (rs776746), ABCB1 1236 C> T (rs1128503), 2677 G> T / A (rs2032582) dan 3435 C> T (rs1045642) dan ekspresi gen serta tahap ekspresi miRNA yang dipilih (miR-21, miR-27b, miR-34a, miR-182, miR-200c dan miR-451) dalam memodulasi tindak
balas kemoterapi TAC serta hasil rawatan pada pesakit TNBC.
Tujuh puluh enam (76) sampel darah and 41 tisu blok FFPE dari pesakit yang sama disahkan secara klinikal dan histopatologi pesakit TNBC. DNA (sample darah) dan keseluruhan RNA (tisu blok FFPE) diekstrak. Pengenotipan dilakukan menggunakan kaedah PCR-RFLP and AS-PCR seterusnya penjujukan DNA. Tahap ekspresi mRNA dan miRNA diukur dengan menggunakan kaedah qRT-PCR. Kesan terhadap rawatan dan penyakit dinilai setelah selesai kemoterapi. Berdasarkan respon kemoterapi, Pesakit dibahagikan kepada kerintangan kemoterapi dan respon kemoterapi. Dalam analisis perkaitan genetik, genotip homozigot dan alel mutasi CYP1B1 4326 C>G dan
xxxii
ABCB1 3435 C>T polimorfisme, gabungan genotip CYP1B1 142 GG + CYP3A4 878
TT dan CYP1B1 4326 GG + ABCB1 1236 CT dan haplotip CYP1B1 4326G / 142C,
ABCB1 3435T / 2677G / 1236T dan ABCB1 3435T / 2677T / 1236T dikaitkan dengan risiko yang lebih tinggi untuk kerintangan kemoterapi. Manakala, genotip CYP1B1
142 CG secara signifikan dikaitkan dengan respon kemoterapi yang baik. Untuk analisis ekspresi mRNA dan miRNA, tahap ekspresi tinggi bagi CYP1B1 dikaitkan secara signifikan dengan kerintangan kemoterapi. Lebih-lebih lagi, regulasi yang tinggi bagi miR-21 dan miR-182 didapati berkaitan dengan peningkatan risiko pengulangan penyakit menjadi lebih teruk dan menjadi faktor prognosis dalam pesakit
TNBC yang menjalani kemoterapi TAC. Sebaliknya, genotip CYP1B1 142 CG
dijumpai sebagai faktor prognostik yang baik untuk meramalkan kelangsungan hidup
dalam pesakit TNBC. Oleh itu, genotip CYP1B1 4326 GG, ABCB1 3435 TT, tahap
regulasi CYP1B1 mRNA yang tinggi dan tahap regulasi miR-21 dan miR-182 yang
tinggi menjadi penentu genetik terhadap tindak balas kemoterapi TAC didalam pesakit TNBC. Penentu genetik ini boleh dipertimbangkan sebagai penanda bio yang berpotensi yang mungkin akan membantu pegawai perubatan, terutamanya dalam risiko berulang dan / atau prognosis yang berulang dan seterusnya meningkatkan pengurusan pesakit TNBC.
xxxiii
GENETIC DETERMINANTS OF TAC CHEMOTHERAPY RESPONSE IN TRIPLE NEGATIVE BREAST CANCER PATIENTS
ABSTRACT
Triple negative breast cancer (TNBC), one of the breast cancer subtypes is characterised by aggresive phenotype, high rates of recurrence and poor prognosis and is an important clinical challenge due to lack of specific targeted therapy. Although, TNBC patients are treated with taxane, adriamycin and cyclophosphamide (TAC) chemotherapy regimen, drug resistance and tumour recurrence are major obstacles in TNBC treatment. Reliable prognostic marker of TNBC remains elusive. The present study was undertaken to investigate the impact of selected SNPs of CYP1B1 142 C>G (rs10012), 4326 C>G (rs1056836) and 4390 A>G (rs1800440), CYP3A4 878 T>C
(rs28371759), CYP3A5 6986 A>G (rs776746), ABCB1 1236 C>T (rs1128503), 2677
G>T/A (rs2032582) and 3435 C>T (rs1045642) and their respective gene expressions as well as expression levels of selected miRNAs (21, 27b, 34a, miR-182, miR-200c and miR-451) in modulating TAC chemotherapy response and treatment outcome in TNBC patients. Seventy six (76) blood samples and 41 match paired FFPE tissues blocks available from the same group of clinically and histopathologically confirmed TNBC patients, who had undergone surgery and completed six cycles of TAC chemotherapy regimen were included in the study. DNA (blood samples) and total RNA (FFPE tissues blocks) were extracted. Genotyping was carried out using PCR-RFLP and AS-PCR methods followed by DNA sequencing. mRNA and miRNA expression levels were determined using qRT-PCR. The treatment response and disease outcome of the patients were evaluated after completion of chemotherapy. Based on chemotherapy response, patients were
xxxiv
categorized into chemoresistant and chemoresponse groups. In genetic association analysis, homozygous variant genotype and variant allele of CYP1B1 4326 C>G and
ABCB1 3435 C>T polymorphisms, combination of CYP1B1 142 GG + CYP3A4 878
TT and CYP1B1 4326 GG + ABCB1 1236 CT genotypes, CYP1B1 4326G/142C,
ABCB1 3435T/2677G/1236T and ABCB1 3435T/2677T/1236T haplotypes were
associated with significantly higher risk for chemoresistance. Whereas, CYP1B1 142
CG genotype was significantly associated with good chemoresponse. For mRNA and miRNA expression levels analysis, high expression level of CYP1B1 was significantly associated with chemoresistance. Moreover, up regulation of miR-21 and miR-182 were found to be associated with increased risk of relapse and to be a prognosis factor
in TNBC patients undergoing TAC chemotherapy. On the other hand, CYP1B1 142
CG genotype was found to be a good prognostic factor for predicting survival in TNBC
patients. Thus, CYP1B1 4326 GG, ABCB1 3435 TT genotypes, high CYP1B1 mRNA
expression level and up regulation of miR-21 and miR-182 expression levels emerged as genetic determinants of TAC chemotherapy response in TNBC patients. These genetic determinants could be considered as potential biomarkers that might help the clinician, especially in predicitng recurrence risk and/or prognosis and thus improve management of TNBC patients.
1
CHAPTER 1
INTRODUCTION
1.1 Breast cancer
Breast cancer is a type of cancer that develops in the cell lining of milk ducts as well as the lobules that supply the duct with milk. Breast cancer develops from normal breast epithelial cells that evolve via atypical hyperplasia (and eventually dysplasia) to ductal carcinoma in situ (DCIS) and subsequently to invasive breast cancer. The process involves multiple molecular alterations involving genetic and epigenetic alterations in precursor and neoplastic cells, subsequently turning to metastatic breast cancer (Rivenbark et al., 2013).
Generally, breast cancer can be divided into two (2) types; sporadic and hereditary forms. The most common form of breast cancer is the sporadic form which accounts for more than 85% of cases. Sporadic breast cancer results from genetic changes that occur only in breast cancer cells (somatic mutation) due to exposure or interaction with environmental factors. However, hereditary breast cancer which accounts for less than 15% of breast cancer cases, results from inherited germline mutations in high penetrant breast cancer susceptibility genes including breast cancer genes 1 and 2 (BRCA1 and
2
1.2 The incidence and prevalence of breast cancer
Breast cancer is a global health issue and is the commonest form of cancer and the leading cause of cancer-related deaths in women (Beiki et al., 2012; Shah et al., 2014). The incidence is increasing worldwide over the years with high mortality rate. More than one million new breast cancer cases were reported which accounts for 25% of all cancer types (Ferlay et al., 2015).
According to Globocan, the standardized incidence rate of breast cancer was 43.1 per 100,000 population while the mortality rate was 12.9 per 100,00 population. The highest incidence was in Belgium (111.9 per 100,000), followed by Denmark (105 per 100,000), Bahamas (98 per 100,000) and Netherlands (96 per 100,000). Continent wise, the incidence rate was highest in Northern America (91.6 per 100,000), followed by Western Europe (91.1 per 100,000), Middle Africa (26.8 per 100,000) and Eastern Asia (27 per 100,000) respectively (Ghoncheh et al., 2016a). Among South East Asian countries, Singapore had a higher incidence rate (65.7 per 100,000) followed by Brunei (48.6 per 100,000) and Philippines (47 per 100,000) (Youlden et al., 2014).
According to the National Cancer Registry Malaysia report from 2007 to 2011, breast cancer was the commonest cancer type in women in Malaysia with a total of 18,343 (17.1%) cases reported followed by colorectal (13.2%) and lung (10.2%). Breast cancer accounts for 32.1% of all cancer in females with life time risk of 1 in 30 individuals and an age standardized rate of 31.1 per 100,000 in Malaysia (Azizah et al., 2016).
3
1.3 Breast cancer subtypes
Breast cancer is a heterogenous malignancy and has many subtypes with different biological behaviour, clinic-pathological features and molecular characteristics (Yersal and Barutca, 2014). There are four major molecular subtypes of breast cancer; Oestrogen (ER) positive/luminal, Human epidermal growth receptor 2 (HER2) positive (HER2-enriched), basal-like and normal breast-like. However, recent study on the gene expression profiling revealed that breast cancer can be divided further into luminal A (ER positive and/or Progesterone (PR) positive, HER-2 negative), luminal B (ER positive and/or PR positive, HER-2 positive), HER-2 over expression (ER negative, PR negative, HER-2 positive) basal-like (ER negative, PR negative, HER-2 negative, cytokeratin 5/6 positive and/or epidermal growth factor receptor 1 (HER-1) positive) as well as normal breast-like(Boyle, 2012).
1.4 Breast cancer risk factors
Several epidemiological studies have shown that genetic and environmental or interactions between these two factors play an important role in increasing the risk of breast cancer. Factors such as age, breast pathology, family history and genetic predisposition as well as environmental factors have been reported as risk factors for
breast cancer development. However, other factors such as exposure to endogenous
and exogenous hormone such as oral contraceptive pills as well as life style related factors also contribute to increased risk of breast cancer development (Abdulkareem, 2013; Gotzsche and Jorgensen, 2013; Shah et al., 2014).
4
Age, gender and personal history: The risk of developing breast cancer increases with age as well as being a female gender. Breast cancer is uncommon before age of 20 years. A study reported a rate of 10/100,000 for breast cancer in women aged below 25 years and the risk increased up to 100 times in women by the age 45 years (Dumitrescu and Cotarla, 2005). Women have been reported to have a higher risk for breast cancer development as compared to men. However, men who are shown to express ER, PR and androgen receptors as well as men with Klinefelter’s syndrome
have been reported to have a higher chance of breast cancer development (Murphy et
al., 2006). Personal history such as diagnosed DCIS, stage IIB and hormone receptor
negative are shown to pose a higher risk of breast cancer (Buist et al., 2010). So, also women who do not breast feed, pregnancy at early age, late menarche and early menopause are also reported to be at higher risk for breast cancer development (Collaborative Group on Hormonal Factors in Breast, 2002; Ritte et al., 2012).
Breast pathology: Proliferative breast lesion without atypia, including usual ductal hyperplasia, intraductal papillomas, sclerosing adenosis and fibroadenomas may increase the risk of breast cancer development. Some studies showed that women with atypia had 4.3 folds higher risk of developing breast cancer as compared to a normal individual (Hartmann et al., 2005; Shah et al., 2014).
Family history: History of breast cancer in the family especially among first/second degree relatives is one of the most important risk factors for the development of breast cancer (Martin et al., 2010a). Women with strong a family history of breast cancer may inherit some gene mutation that might influence the risk of breast cancer
5
development. In general, women with positive family history show early onset of breast cancer, bilateral breast cancer, advanced stage, positive lymph node, negative hormone receptors and a poorer prognosis (Verkooijen et al., 2006). Genetic factor is the most important factor that contribute to familial breast cancer development. A
study showed that, women with inherited mutations in genes such as BRCA1, BRCA2,
TP53, PTEN, STK1 had a higher risk for development of familial breast cancer (van der Groep et al., 2011). In fact, women with inherited mutations in BRCA1 had 40% to 85% lifetime risk of developing breast cancer and 25% to 65% for risk of developing
ovarian cancer. On the other hand, those who have inherited BRCA2 mutation pose
similar risk of breast cancer, with an ovarian cancer risk estimated to be 15% to 20% (Pruthi et al., 2010).
Lifestyle and habits: Due to modernization, lifestyle habits are changing. Several epidemiological studies have shown that lack of physical activities, alcohol consumption, tobacco smoking, high fat diet, obesity and high cholesterol may increase the risk of breast cancer development (Khan et al., 2010). Alcohol consumption and tobacco smoking consist of various genotoxic agents such as reactive oxygen species (ROS), polycyclic aromatic hydrocarbon (PAH) and heterocyclic amines (HCA) that will lead to DNA damage in the cell. On the other hand, lack of physical activities and high fat diet increase the ER level in the body and thus increase the risk of breast cancer development and growth.
Endogenous and exogenous exposure: Women who are exposed to ionizing
6
higher risk of breast cancer. In addition, hormone replacement therapy (HRT) and usage of oral contraceptives are reported to increase the risk of breast cancer (Abdulkareem, 2013; Dumitrescu and Cotarla, 2005). Contraceptives pill contain the female sex hormones such ER and progestogens. These hormones prevent pregnancy by stopping the ovaries releasing eggs (called ovulation). However, these hormones can increase the growth of some breast cancers, which might explain why taking the pill slightly increases the risk of breast cancer.
1.5 Screening and diagnosis of breast cancer
Breast self-examination (BSE) and clinical breast examination (CBE) are the first line screening processes for breast cancer detection. Most clinicians encourage women to perform BSE monthly. These techniques will help to detect early signs of breast cancer including the presence of lump in the breast, a change of breast shape, dimpling of the skin, nipple discharge or presence of red scaly patch of the skin. Besides that, bony pain, malaise and loss of weight are other general signs of breast cancer.
Advanced technique using automated machines such as mammography, ultrasound and magnetic resonance imaging are also being used in the screening and diagnosis of breast cancer. Mammography is an important technique in early detection of non-palpable masses. However, routine mammography leads to undue stress and uncertainty in case of false positive results. Ultrasound helps clinician to screen breast cancers that could not be detected by mammography. However, MRI increase the
modality in detection, assessment, staging and management of breast cancer (Shah et
7
to determine tumour growth and the metastatic spread to the lymph nodes, liver or other organs (Veronesi et al., 2005). For diagnosis, tissue biopsies are taken followed by staining and observation under a microscope. Based on the findings, the tissues, if cancerous will be classified according to the Tumour (T), Nodes (N), Metastasis (M) (TNM) system (see section 1.7).
1.6 Histological staging and grading
In breast cancer staging and grading, TNM system is used based on the size of tumour (T) and whether tumour has spread to the lymph nodes or not (N) or whether the tumour has metastasized to other parts of the body (M). Following breast cancer diagnosis, the patients are clinically staged using the American Joint Commission on Cancer (AJCC) (7th Edition, 2009) guidelines, whereas tumour is histologically graded
according to the Scaff Bloom and Richardson (SBR) histological system (Tables 1.1 and 1.2). Tumour grading compares breast cancer cells to the normal breast tissues and can be divided into three types; well differentiated (low grade), moderately differentiated (intermediate grade) and poorly differentiated (high grade) where the cells lose their features as compared to the normal breast cells.
8
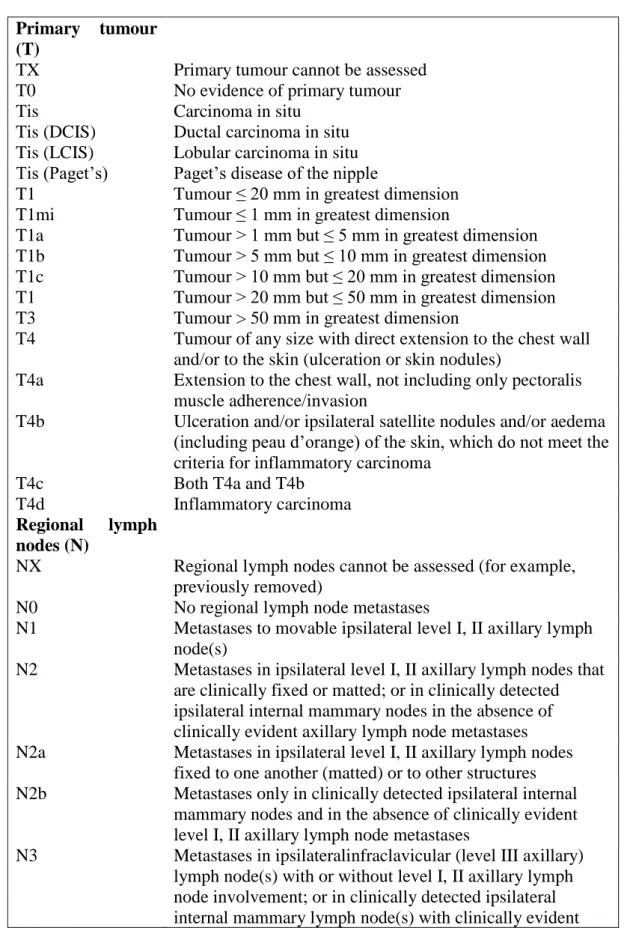
Table 1.1: American Joint Commission on Cancer (7th Edition, 2009) guidelines
-tumour node metastasis (TNM) classification
Primary tumour (T)
TX Primary tumour cannot be assessed
T0 No evidence of primary tumour
Tis Carcinoma in situ
Tis (DCIS) Ductal carcinoma in situ
Tis (LCIS) Lobular carcinoma in situ
Tis (Paget’s) Paget’s disease of the nipple
T1 Tumour ≤ 20 mm in greatest dimension
T1mi Tumour ≤ 1 mm in greatest dimension
T1a Tumour > 1 mm but ≤ 5 mm in greatest dimension
T1b Tumour > 5 mm but ≤ 10 mm in greatest dimension
T1c Tumour > 10 mm but ≤ 20 mm in greatest dimension
T1 Tumour > 20 mm but ≤ 50 mm in greatest dimension
T3 Tumour > 50 mm in greatest dimension
T4 Tumour of any size with direct extension to the chest wall
and/or to the skin (ulceration or skin nodules)
T4a Extension to the chest wall, not including only pectoralis
muscle adherence/invasion
T4b Ulceration and/or ipsilateral satellite nodules and/or aedema
(including peau d’orange) of the skin, which do not meet the criteria for inflammatory carcinoma
T4c Both T4a and T4b
T4d Inflammatory carcinoma
Regional lymph
nodes (N)
NX Regional lymph nodes cannot be assessed (for example,
previously removed)
N0 No regional lymph node metastases
N1 Metastases to movable ipsilateral level I, II axillary lymph
node(s)
N2 Metastases in ipsilateral level I, II axillary lymph nodes that
are clinically fixed or matted; or in clinically detected ipsilateral internal mammary nodes in the absence of clinically evident axillary lymph node metastases
N2a Metastases in ipsilateral level I, II axillary lymph nodes
fixed to one another (matted) or to other structures
N2b Metastases only in clinically detected ipsilateral internal
mammary nodes and in the absence of clinically evident level I, II axillary lymph node metastases
N3 Metastases in ipsilateralinfraclavicular (level III axillary)
lymph node(s) with or without level I, II axillary lymph node involvement; or in clinically detected ipsilateral internal mammary lymph node(s) with clinically evident
9
level I, II axillary lymph node metastases; or metastases in ipsilateral supraclavicular lymph node(s) with or without axillary or internal mammary lymph node involvement
N3a Metastases in ipsilateralinfraclavicular lymph node(s)
N3b Metastases in ipsilateral internal mammary lymph node(s)
and axillary lymph node(s)
N3c Metastases in ipsilateral supraclavicular lymph node(s)
Distant metastases (M)
M0 No clinical or radiographic evidence of distant metastases
cM0 (i+) No clinical or radiographic evidence of distant metastases,
but deposits of molecularly or microscopically detected tumour cells in circulating blood, bone marrow, or other nonregional nodal tissue that are no larger than 0.2 mm in a patient without symptoms or signs of metastases
M1 Distant detectable metastases as determined by classic
clinical and radiographic means and/or histologically proven larger than 0.2 mm
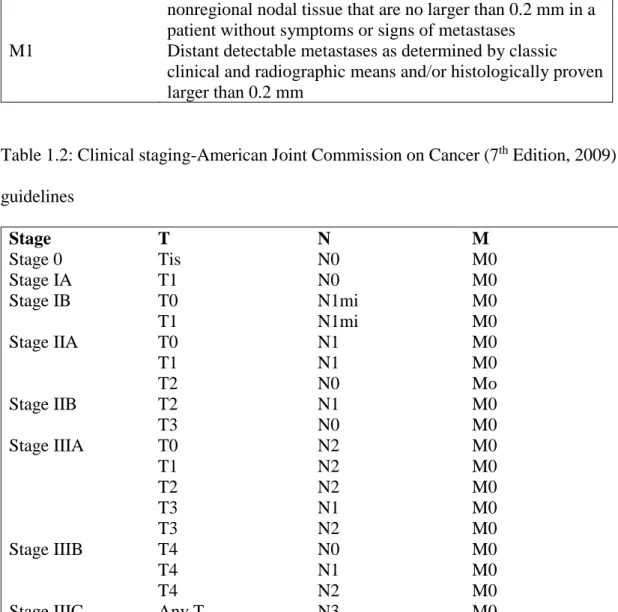
Table 1.2: Clinical staging-American Joint Commission on Cancer (7th Edition, 2009)
guidelines Stage T N M Stage 0 Tis N0 M0 Stage IA T1 N0 M0 Stage IB T0 N1mi M0 T1 N1mi M0 Stage IIA T0 N1 M0 T1 N1 M0 T2 N0 Mo Stage IIB T2 N1 M0 T3 N0 M0 Stage IIIA T0 N2 M0 T1 N2 M0 T2 N2 M0 T3 N1 M0 T3 N2 M0 Stage IIIB T4 N0 M0 T4 N1 M0 T4 N2 M0
Stage IIIC Any T N3 M0
Stage IV Any T Any N M1
10
1.7 Management and treatment of breast cancer
Breast cancer is curable and treatable if detected early. The management and treatment of breast cancer depends on several factors including physical and biological characteristics of the disease, age, overall health and personal preferences of the patient. In treatment options, breast cancer is usually treated with surgery, chemotherapy, radiotherapy, hormonal and targeted therapies (Kabel and Baali, 2015)
Surgery is the main treatment in breast cancer and depends on the type and stage of tumour. Patients will undergo lumpectomy or mastectomy. Lumpectomy is a surgical procedure in which only the part of the breast containing the cancer is removed, whereas mastectomy is a surgery in which the entire breast is removed, including all the breast tissue and sometimes other nearby tissues. On the other hand, a surgery such as sentinel lymph node biopsy (SLNB) or axillary lymph node dissection (ALSD) can also be done to determine the possibility of whether breast cancer has spread to axillary lymph nodes.
Chemotherapy is a treatment where cancer cells are killed using single or combination of cytotoxic drugs either via intravenous or oral route. Usually, chemotherapy is administered to patients before, after or in place of surgery based on the stage of cases. Neoadjuvant chemotherapy is given to the patients before surgery to reduce or shrink the tumour size before undergoing surgery. On the other hand, adjuvant chemotherapy is given after the patients undergo surgery to improve the disease-free survival (DFS) and overall survival (OS) rates.
11
Radiotherapy uses high energy rays such as X-ray or other particles to kill cancer cells or to stop the cancer cell from growing. There are two types of radiation given to breast cancer patients 1) external beam radiation and 2) internal radiation. Radiotherapy will be given to breast cancer patients following breast conserving surgery, mastectomy or when cancer cells has spread to other parts of the body.
Hormonal therapy is beneficial for breast cancer patients who are positive for oestrogen and progesterone receptor hormones. The therapy is given after or sometimes before surgery. Oestrogen has been known as an important factor for cancer cell growth and spread. Hormone therapy acts by lowering oestrogen levels or by stopping the oestrogen production, thus reducing the risk of cancer recurrence. It is recommended to breast cancer patients who are hormone positive (ER positive and/or PR positive) where tamoxifen is one of the drugs used in hormonal therapy acting by blocking the oestrogen receptors on breast cancer cells.
Researchers have developed a new drug that can be targeted or specific to the targeted cells or protein by blocking the growth and spread of cancer cells. Targeted therapy is generally less likely than chemotherapy to harm normal, healthy cells. Breast cancer patients who are positive for human epidermal growth factor-2 (HER2) are normally recommended for targeted hormone treatment.
12
1.8 Breast cancer prevention
Cancer prevention is the way to stop or reduce the risk of cancer development. One of the best ways to combat cancer is to prevent it from occurring by identifying and controlling the factors that may increase the risk for breast cancer development. As stated earlier, genetic and environmental factors or combinations of these two factors are closely related with higher risk of breast cancer.
By routine practice of physical activity and healthy diet, one can reduce the risk of breast cancer. Physical activities can increase the rate of metabolism and oxygen uptake. It can also can increase metabolic efficiency and capacity and help to reduce blood pressure, insulin resistance as well as obesity. Increased intake of vegetables, fruits with high antioxidant and phytochemicals in diet and avoiding fatty foods, cigarette smoking as well as alcohol may also help lower the risk of breast cancer.
Besides that, systematic screening and surveillance programmes could be addressed in order to fight against as well as reduce the mortality of breast cancer. Individuals who have family history of cancer, exposure to environmental carcinogens and common symptoms of breast cancer as mentioned earlier, should be more alertful and should take prudent steps to practise healthy lifestyles by monitoring their healths and undergoing routine medical check-up and cancer screening programmes. Breast cancer is treatable and curable if detected early. Early detection and early treatment may help to reduce the incidence and mortality rate of breast cancer.
13
1.9 Present study: Problem statement
Triple negative breast cancer (TNBC) is one of the breast cancer subtypes, characterized by lack of ER, PR expressions and no amplification of the HER-2 receptors. This subtype accounts for 15-20% of all breast cancer cases. TNBC is typically associated with high histological grade and stage, aggressive tumour phenotype showing only partial response to chemotherapy with lack of clinical established therapies (Kaplan et al., 2009). Moreover, TNBC is strongly associated with distant recurrence, visceral metastases and death when compared to other breast cancer types (Bauer et al., 2007; Dent et al., 2007). TNBC accounts for 15%-20% of the 500,000-breast cancer associated female deaths worldwide, each year and is considered as an international public health issue (Cancer Genome Atlas, 2012). In TNBC, recurrence often occurs within 1 to 3 years of diagnosis, while 5 years mortality rates appear to be increased following initial diagnosis. The median survival of advanced TNBC is at best 12 months, much lower than the median survival observed in other advanced breast cancer subtypes (Anders and Carey, 2009).
Due to lack of target receptors (ER, PR and HER2) and lack of specific targets for treatment, patients diagnosed with TNBC do not benefit from hormonal or targeted therapy and has a high probability of having early tumour relapse following diagnosis. There has always been continuous search for novel therapeutic targets. Although effective tailored therapies have been developed for patients with hormone positive and HER-2 positive disease, TNBC patients are unlikely to benefit from currently available systemic therapy. At Hospital Universiti Sains Malaysia (Hospital USM) and several other centres, TNBC patients are treated with Taxane, Adriamycin and
14
Cyclophosphamide (TAC) chemotherapy regimen. TNBC seems to be particularly chemosensitive to taxanes and anthracyclines which is part of the standard regimens used for high risk patients. Since this subtype is associated with high risk of recurrence and metastasis, adjuvant chemotherapy using TAC regimen is given for early TNBC cases after the patients undergo primary surgical resection of their breast tumour and axillary nodes. Nevertheless, TNBC is generally susceptible to chemotherapy initially where early complete response does not correlate with overall survival. The risk of relapse within 3-5 years is higher than other breast cancer subtypes (Cheang et al., 2008; Hudis and Gianni, 2011).
TNBC is particularly lethal when it recurs. Drug resistance or disease recurrence is a major clinical manifestation and is the principle cause of TNBC related deaths. Due to tumour heterogeneity and interindividual differences in TNBC patients, the efficacy and toxicity of TAC chemotherapeutic drugs vary across individuals. As a result, a significant number of TNBC patients fail to respond or acquire resistance to the introduced TAC chemotherapeutic agents that usually leads to a relapse and worsening of prognosis. It has been shown that one out of two patients will fail to respond to initial treatments or will rapidly acquire resistance to chemotherapeutic drugs (O'Driscoll and Clynes, 2006). Since TNBC lacks specific target and clinical therapies, the availability of markers or signals that reliably differentiates between TAC chemotherapy sensitive and resistant patients are required to improve the chemotherapy.
15
In predicting the disease progression, the prospect of recurrence and treatment response, traditional clinical risk factors such as tumour size, patient’s age, regional lymph node spread, and ER receptor status are commonly used (Early Breast Cancer Trialists' Collaborative et al., 2008). However, the information derived from all these parameters are often unreliable in identifying who will respond better with TAC chemotherapy from others and who may end up with poor outcomes and recurrences. The causes for TNBC recurrence remain unknown. There is no acceptable module to investigate drug resistance and disease recurrence in TNBC. Hence, there is a pressing need to identify markers for TAC chemotherapy response in TNBC patients. This study aimed to investigate few putative genetic markers for their possible role in determining the TAC chemotherapy response, recurrence risk and treatment outcomes.
1.9.1 Genetic determinants of variable chemotherapy response and recurrence risk
Once the chemotherapeutic drugs enter a patient’s system and transits through the body to interact with cancer cell, the drugs interact with a diversity of molecular entities. During this process, patient’s genetics, especially germline-based variations can affect the pharmacokinetics of chemotherapeutic drugs and thus influence the bioavailability of these drugs. Pharmacokinetic variability also accounts for suboptimal therapeutic drug levels which results in decreased response. The factors accounting for suboptimal drug levels include variable metabolizing activities as well as different transporter activities. Genetic variations in the form of single nucleotide polymorphism (SNPs) that affect gene expression or function in individuals can cause interindividual differences in the metabolism and disposition of medications. Genetic variations in
16
genes encoding drug metabolizing enzymes and drug transporters could affect expression of corresponding proteins and can impact pharmacokinetics of chemotherapeutic drugs in patients and thereby may influence the intracellular delivery, effectiveness and response to those drugs.
To date, genomic assays may be helpful in differentiating interpatient variability in identifying breast cancer patients who are likely to benefit (or not) and also in predicting disease recurrence. Genetic and epigenetic factors have been shown to be attributable to TNBC chemoresistance (O'Reilly et al., 2015; Ouyang et al., 2014). Differences in genetic variation among breast cancer patients have been identified to be important factors that contribute to differences in treatment response. SNPs of pharmacogenes might lead to absence or altered enzyme activity and show an impact on individual’s response or resistance to the treatment (Dumont et al., 2015). SNPs may affect drug toxicity and efficacy in a variety of ways. For example, SNPs located in coding sequence of a gene may result in amino acid change that may alter protein function when compared to wildtype protein.
Drug transporters regulate the influx and efflux of drugs in cells. Genetic polymorphisms of transporters can have profound impact on drug disposition, drug efficacy and drug safety and thereby impact pharmacokinetics (Franke et al., 2008). Of particular interest has been on the pharmacogenetic relevance due to genetic variation in efflux transporters of the ATP-binding cassette (ABC) subfamily member B1 (ABCB1). As a transporter, ABCB1 has a broad affinity spectrum for different anticancer drugs including docetaxel, paclitaxel, doxorubicin etc.
17
Metabolism of a drug can also contribute to therapy resistance. The cytochrome P450 (CYPs) enzymes facilitate the metabolism and elimination of nearly 50% of all chemotherapeutics drugs. In the metabolism of the drugs used in TAC chemotherapy regimen, the CYP3A4, CYP3A5 and CYP1B1 play major role. Genetic variations in the above CYP genes also can have profound effect on enzymes activity and thereby contribute to the variations in response to the chemotherapeutic drugs used for TNBC patients.
Because genetic polymorphisms may affect the expression and activity of encoded proteins, it is a key covariate that is responsible for variability in drug metabolism, drug transport and for determining pharmacodynamics of drug effects. Cytochrome
P450 (CYP1B1, CYP3A4 and CYP3A5) are drug metabolism enzymes and ABCB1 is
drug efflux transporter that have been widely studied. SNPs in these drug metabolism and transport genes that may alter protein function are suggested to play an important role in determining the effectiveness of drugs and also in determining why some individuals are responsive or resistant to chemotherapeutic drugs. Since no reports are available on the impact of genetic variations in these drug metabolising or transporter genes on TAC chemotherapy response in TNBC patients, it was of interest to investigate whether genetic variations [SNPs] in CYP1B1 [142 C>G (rs10012), 4326 C>G (rs1056836) and 4390 A>G (rs1800440)], CYP3A4 [878 T>C (rs28371759)],
CYP3A5 [6986 A>G (rs776746)], ABCB1 [1236 C>T (rs1128503), 2677 G>T/A (rs2032582) and 3435 C>T (rs1045642)] have any impact in modulating TAC chemotherapy response and treatment outcome in TNBC patients.