Department of Computer Graphics Technology
Degree Theses Department of Computer Graphics Technology
4-18-2013
The Effects Of Parallax Scrolling On User
Experience And Preference In Web Design
Dede M. Frederick
Purdue University, [email protected]
Follow this and additional works at:http://docs.lib.purdue.edu/cgttheses Part of theScience and Technology Studies Commons
This document has been made available through Purdue e-Pubs, a service of the Purdue University Libraries. Please contact [email protected] for additional information.
Frederick, Dede M., "The Effects Of Parallax Scrolling On User Experience And Preference In Web Design" (2013).Department of Computer Graphics Technology Degree Theses.Paper 27.
THE EFFECTS OF PARALLAX SCROLLING ON USER EXPERIENCE AND PREFERENCE IN WEB DESIGN
A Thesis
Submitted to the Faculty of
Purdue University by
Dede Frederick
In Partial Fulfillment of the Requirements for the Degree
of
Master of Science
May 2013 Purdue University West Lafayette, Indiana
ii
ACKNOWLEDGEMENTS
First and foremost I would like to thank God for his incredible blessings and mercies. It is through his grace that I’ve received wisdom and knowledge that have equipped me to write this thesis. Secondly I want to thank my committee, Dr. James Mohler (chair), Dr. Mihaela Vorvoreanu and Professor Ronald Glotzbach for offering advice that provided guidance for this research study. I would also like to express my sincere gratitude to Jason Francis for devoting substantial time and effort to help me conduct my research experiment. Most of all I want to thank my family for the support and
encouragement they have given me throughout my graduate school experience. Most importantly I want to say thank you to my wife Shanta who has been my greatest supporter and best friend. Your encouragement helped me start this journey, and I am exhilarated to know that you are here to finish it with me. I love you Shanta.
iii
TABLE OF CONTENTS
Page
LIST OF TABLES ... vi
LIST OF FIGURES ...vii
ABSTRACT ... viii CHAPTER 1. INTRODUCTION ... 1 1.1 Scope of Research ... 2 1.2 Significance of Problem ... 2 1.3 Statement of Purpose... 4 1.4 Research Question ... 5 1.5 Assumptions ... 5 1.6 Delimitations... 6 1.7 Limitations ... 6 1.8 Definitions ... 6 1.9 Summary ... 7
CHAPTER 2. REVIEW OF LITERATURE ... 8
2.1 Influence of Usability on User Experience ... 9
2.2 Aesthetics and the user experience... 11
2.3 Emotions and the user experience ... 12
2.4 Novelty and aesthetic response ... 13
2.5 Why focus on novelty in design ... 15
2.6 Novelty and user experience ... 16
2.7 Parallax scrolling and user experience ... 18
iv page CHAPTER 3. METHODOLOGY ... 20 3.1 Research Framework ... 20 3.2 Hypotheses ... 20 3.3 Population ... 21 3.4 Experiment Setup ... 22 3.5 Procedure ... 24 3.6 Instruments... 26 3.7 Data Analysis ... 27 3.8 Summary ... 28 CHAPTER 4. RESULTS... 29 4.1 Demographics of participants ... 29 4.2 Reliability Analysis ... 33
4.3 Analysis and hypotheses testing ... 33
4.3.1 Usability ... 33
4.3.2 Enjoyment ... 35
4.3.3 Fun ... 37
4.3.4 Satisfaction... 39
4.3.5 Visual Appeal ... 41
4.3.6 User experience and preference... 43
4.3.7 Summary ... 43 CHAPTER 4. DISCUSSION ... 45 5.1 Limitations ... 48 5.2 Conclusion ... 48 REFERENCES ... 50 APPENDICES Appendix A: IRB Approval Letter.. ... 55
Appendix B: Research Participant Consent Form … ... 56
Appendix C: Research Survey... ... 59
v
LIST OF TABLES
Table Page
Table 3.1 Specifications for the computers used in the experiment………..…... 25
Table 4.1 Items from survey instrument measuring website usability………... 34
Table 4.2 Results of the Mann-Whitney test for survey questions 1, 2 and 3... 35
Table 4.3 Mean rank scores for survey questions 1, 2 and 3………...35
Table 4.4 Items measuring website enjoyment……….……...36
Table 4.5 Results of the Mann-Whitney test for survey questions 4, 5 and 6………...36
Table 4.6 Mean rank scores for survey questions 4, 5 and 6 ………...37
Table 4.7 Items measuring website fun …………...………...……….……...37
Table 4.8 Results of the Mann-Whitney test for survey questions 7, 8 and 9………...38
Table 4.9 Mean rank scores for survey questions 7, 8 and 9……….……...39
Table 4.10 Items measuring website satisfaction……….……... 39
Table 4.11 Results of the Mann-Whitney test for survey questions 10, 11 and 12…...40
Table 4.12 Mean rank scores for survey questions 10, 11 and 12 ………...40
Table 4.13 Items measuring website visual appeal ……….……... 41
Table 4.14 Results of the Mann-Whitney test for survey questions 13, 14 and 15…...42
vi
LIST OF FIGURES
Figure Page
Figure 3.1 Figure of the hotel websites used in the experiment………... 24
Figure 4.1 Research participants by department ….………... 30
Figure 4.2 Research participants by ethnicity...31
Figure 4.3 Participants by academic status ………... 32
v
ii
ABSTRACT
Frederick, Dede M. M.S., Purdue University, May 2013. The effects of parallax scrolling on user experience and preference in web design. Major Professor: Dr. James Mohler.
Parallax scrolling is becoming an increasingly popular strategy in web design. In addition to its ability to engage users with a website, advocates of the technique argue that it also improves the overall user experience. This study was therefore conducted to investigate whether parallax scrolling can support these claims.
Researchers have attributed a pleasurable user experience to the fulfillment of the following variables: usability, satisfaction, enjoyment, fun and visual appeal. The goal of this study was to establish whether or not parallax scrolling can influence these variables and subsequently the user experience.
Eighty six individuals were randomly selected and assigned to one of two experimental groups. Participants from each group completed three tasks on one of two websites, which were identical in all respects except for scrolling effects. While group 1 interacted with a website utilizing the parallax scrolling effect, group 2 saw a website not using the effect. All participants completed a survey after completing their tasks.
A Mann-Whitney test was performed to compare participants’ survey responses with respect to the five measured variables. However, it failed to return any significant differences between the groups, except for ‘fun’ and professional design of the website. Participants believed that the website utilizing parallax scrolling was significantly more
v
iii
fun and looked more professionally designed. Overall parallax scrolling did not
significantly improve overall user experience; however it did enhance certain aspects of the user experience.
1
CHAPTER 1. INTRODUCTION
How do we influence product preference or a consumer’s experience with a product or website? In the early days of the internet and web design, attention was particularly placed on website usability, and most research focused on elements such as font size, ease of use, button size and so on. Today however, the emphasis on user centered design has shifted the focus from the functionality and pragmatic qualities of a product to the emotional experience derived when interacting with that product. This experience is considered an essential element for the success of any product or information system.
In consideration of this, many marketers are utilizing the design of their products to distance themselves from their competitors and gain an advantage in the marketplace (Cox & Cox, 2002; Cruesen & Schoormans, 2005). Product designers are continually seeking to improve the visual appeal and subsequently the hedonic qualities of their products all in an effort to influence consumer preference and experience. Research has shown that visual appeal is highly correlated with the user’s emotions and feelings (Desmet & Hekkert, 2007; Lindgaard, 2007; Norman, 2003); moreover these emotions determine the user experience (Hassenzahl, 2004, 2007; Lavie & Tractinsky, 2004; Mahlke & Thüring). Visual appeal can directly and indirectly influence the user experience.
2
Another important design factor considered in this study is novelty. Veryzer and Hutchinson (1998) argued that novelty not only affects product attractiveness, it also affects users’ emotions by creating positive responses. Novelty has been shown to be very influential in product marketing, which is attributed to our desire for pleasure (Baumgartner & Steenkamp, 1996; Biederman & Vessel, 2006). This study examines the influence of a relatively novel design (parallax scrolling) in web design. It investigates the effects of parallax scrolling on user experience and product preference.
1.1 Scope of Research
Over the years website design has transformed in proportion to users’ expectations. No longer are users satisfied with simply surfing a website to find information or accomplish a particular task; they expect to enjoy the experience while doing so. This pleasurable experience has been shown to be strongly linked with the visual appeal of a website (Hassenzahl & Tractinsky, 2006; Jordan, 1998). Moreover novelty has been shown to increase visual appeal and consequently user experience (Brave & Nass, 2003; Veryzer & Hutchinson, 1998).
In view of the previous information, this study examines how website novelty affects user experience. This study investigates how parallax scrolling within a website can affect user experience and consequently user preference.
1.2 Significance of Problem
Historically most research has been focused on website usability. Such research focused on design aspects such as font size, font type, word density, size of input boxes,
3
button sizes and so on. This was very useful because it ensured that users were able to use the websites efficiently and achieve their goals. However recent research has revealed that visual appeal also influences users’ perception of a website (Hassenzahl, 2001; Jordan, 1999; Karapanos, Martens, & Hassenzahl, 2009). In fact visual appeal actually affects perceived usability (Papachristos & Avouris, 2011). On the other hand, other studies have shown that usability and aesthetics are equally important in design, and whether one or the other is dominant in the interaction depends on the users goals (Hassenzahl, Kekez, & Burmester, 2002). Nevertheless there are other studies that argue that visual appeal is dominant even when the task to be performed is highly practical (Schrepp, Held, & Laugwitz, 2006). Yamamoto and Lambert (1994) showed that even in industrial products, visual appeal is favored above price and performance.
Based on these results, more aesthetically pleasing websites have a greater chance of attracting visitors. In areas such as e-commerce and online retailing this could mean the difference between a successful website or business and one that is not. Li and Yeh (2010) showed that website aesthetics can influence customers’ trust in e-commerce websites and subsequently their purchase intentions. Website owners, irrespective of their niche, are continually seeking ways to turn website visitors into loyal clients. Due to its visual appeal and saliency (Loken & Ward, 1990), novelty has been regarded as a means of capturing users’ attention and loyalty (Woll & Graesser, 1982). Marketers are now utilizing novelty in their product designs to help differentiate themselves from the competition (Cox & Cox, 2002; Cruesen & Schoormans, 2005).
According to Brave and Nass (2003) novelty can have a significant impact on the user’s emotional experience. Lindgaard and Dudek (2002) also demonstrated that a
4
pleasant experience is connected with the emotions and will create user satisfaction. Garrett (2006) asserts that this positive user experience builds customer loyalty.
How can one improve user experience and consequently customers’ preference for a website? How does a website owner increase the chances that website visitors experience pleasant emotions when interacting with their website? How does one improve user satisfaction? The objective in this study is to investigate how a relatively novel website design technique (parallax scrolling) can affect the user experience.
1.3 Statement of Purpose
In the early days of website design people were content with just being able to surf the internet to browse the relatively few websites that were available. Many of the usability problems that they experienced were thought to be part of the process. As the internet and website design evolved, designers and researchers focused on the
improvement of website usability in an effort to make it easier for users to achieve their goals. Today with our advances in technology, research has revealed that usability alone is inadequate to create an enjoyable user experience.
Veryzer and Hutchinson (1998) found that there was a correlation between visual appeal and user experience; however this relationship is curvilinear (Blijlevens, Carbon, Mugge, & Schoormans, 2011; Hung & Chen, 2012; Mandler, 1982). Berlyne (1974) also demonstrated a curvilinear relationship between novelty and preference. Lindgaard and Dudek (2002) showed that a pleasant experience is connected with the emotions, which in fact determines the user experience. Li and Yeh (2010) found that visual appeal had a strong influence on customer trust in e-commerce websites. This is important because a
5
high level of trust is a necessary component for customer purchases and retention (Siau & Shen, 2003).This research seeks to investigate the relationship between novelty,
particularly parallax scrolling and user experience.
1.4 Research Question The research questions in this study included:
1. Can parallax scrolling in website design improve user experience and consequently user satisfaction?
2. Do users show more preference for websites with greater novelty than simple and more typical websites?
1.5 Assumptions
The following assumptions were associated with this study: 1. Participants responded honestly to the survey
2. The sample was random and the participants were representative of the population 3. The results of the study can be generalized to the wider population
4. The statistical techniques selected were appropriate for analysis of the data 5. The sample size was large enough to allow the researcher to detect significant
differences in the population.
6. The survey was reliable and the scales were actually measuring the dependent variables
6
1.6 Delimitations Delimitations of the study:
1. Participants are required to be regular internet users
2. Only one aspect of website design (scrolling technique) will be investigated
1.7 Limitations Limitations of the study:
1. The study was limited to students from Purdue University, which may not have been truly representative of the population
2. The results of this research was based on participants’ subjective responses 3. Participants completed the experiment in an open area and could have been
distracted during the experiment
4. Participants completed the experiments at different periods of time and
consequently environmental conditions may not have been equal for everybody 5. Although all experiments were completed using the same web browser,
participants completed the experiment on two workstations which differed in physical specifications
1.8 Definitions
expressive aesthetics- this refers to the “design attributes of a website or product which stresses on originality, novelty, special effects or the designers’ creativity” (Lavie & Tractinsky, 2004, p. 280).
7
classical aesthetics- “refers to design attributes of a website such as the organization of the website, clearness, cleanness of the website and symmetrical design of the website” (Lavie & Tractinsky, 2004, p. 280).
usability - the extent to which a product allows a user to effectively utilize it, in respect to its intended purpose with ease and satisfaction (ISO 9241-11, 1998).
user experience -the reactions (emotional or psychological) that an individual experiences through an interaction with a product or service (ISO FDIS 9241-210 , 2009). novelty- an individuals’ perceived newness of a product based on his/her comparison of
the current form of that product with forms of past experience (Fiore & Kimle, 2010, p. 381).
1.9 Summary
The purpose of this chapter was to provide an overview of the research project. Here the researcher gave a statement of the problem and the significance of undertaking research to solve this problem. The researcher defined his research question, and
highlighted his assumptions, limitations, and delimitations. The section concluded with a definition of the key terms.
8
CHAPTER 2. LITERATURE REVIEW
Over the past few years, the field of HCI has seen a shift of focus from product utility to the affective experience users have when interacting with a product. This relationship, which has been dubbed ‘user experience’, has evolved into a core principle of design and product development. Proponents of user experience regard it essential for the success of any product (Kujala, Roto, Väänänen-Vainio-Mattila, Karapanos, & Sinnelä, 2011). Garrett (2006) proposed user experience as an instrument for creating customer loyalty and thus should be the objective of every product. Taking this into account, marketers are going to great lengths in the design of their products to ensure a pleasurable user experience. Yet in spite of its growing popularity in the HCI domain, a common definition for user experience is yet to be accepted.
According to Hassenzahl and Tractinsky (2006) the word user experience has several different meanings, which include usability, aesthetics, hedonic qualities, and the overall experience one has using a product. Hassenzahl (2005) perceives user experience as “encompassing all aspects of interacting with a product” (p.41). The ISO (2008) defines user experience as the reactions (emotional or psychological) that an individual experiences through an interaction with a product or service (ISO FDIS 9241-210, 2009). Finally, Garrett (2006) defines it as “the subjective perception of a particular moment in time” (p. 36) and therefore is very subjective. Hassenzahl and Tractinsky (2006) relate
9
user experience to emotions such as fun, happiness, beauty, pleasure, enjoyment and pride that may emerge in a human-product relationship. In light of the previous definitions, we will consider user experience as the emotions that are aroused in an interaction with a product or technology.
2.1 Influence of Usability on User Experience
Historically website usability was regarded as the means for attracting and keeping visitors, but research in user centered design has revealed that pragmatic qualities alone cannot create the user experience that will influence customers’ preferences. However this by no means excludes the influence of usability from the design process or the user experience. The ISO (1998) defined usability as the degree to which a user can effectively utilize a product, in respect to its intended purpose with ease and satisfaction (ISO 9241-11, 1998). Usability is associated with the effectiveness, efficiency and satisfaction of a product or website. Hassenzahl (2001) defines usability as the ‘quality of use’ which also refers to its efficiency and effectiveness. Effectiveness is the capability of a product to produce a desired result; efficiency is the minimum effort required for the product to accomplish a desired goal; and satisfaction is the user’s level of acceptance and contentment with the product (Hassenzahl, 2001).
Although an essential aspect of product development, Jordan (1999) argues that usability is limited because it is task oriented. From a usability viewpoint a product is just a tool to complete a task, when in reality a product is a “living object with which people have relationships. Objects can cause the user to feel happy, angry, proud, ashamed,
10
secure or anxious” (Jordan, 1999, p. 208). Hassenzahl (2001) argues that usability neglects fun and enjoyment and their influence on user satisfaction and preference.
Tractinsky et al. (2000) identified two major components in a user’s interaction with a product; usability and aesthetics. Both factors seem to influence the overall user experience; however the extent to which each feature affects the user experience is highly inconsistent among researchers. It might be inferred from these studies that the extent to which one is preferred over the other is dependent on the user’s intention to use the system, whether it is for hedonic or utilitarian purposes. Hassenzahl, Kekez, and Burmester (2002) conducted a study that showed a positive relationship between visual appeal and usability when participants were asked to complete tasks on a website; however the relationship vanished when participants were asked to “just have fun”.
In a recent study Karapanos, Martens and Hassenzahl (2009) found that usability has a dominant influence on the user experience, but only in the initial interaction with a product. Their research showed that as the relationship between the user and the product developed; the hedonic qualities of a product became more significant, thus shaping the overall user experience. In light of this fact a number of studies are emerging, which suggests studying user experience over an extended time frame rather than the brief period of a typical research study (Kujala, Roto, Väänänen-Vainio-Mattila, & Sinnelä, 2011). This gives the researcher a more accurate analysis of the true determinants of user experience, considering that such elements change over time.
11
2.2 Aesthetics and the user experience
Mahlke and Thüring (2007) identified three components of user experience: instrumental, non-instrumental and emotion. Instrumental qualities refer to the system’s usability while non-instrumental qualities refer to its visual appeal. The authors argue that both instrumental and non-instrumental qualities affect the user’s emotions and
consequently the user experience. Today, interactive systems are no longer designed to be just usable, thy also need to be aesthetically appealing. This is supported by Hasseszahl (2004) who considers visual appeal as a requirement for product preference and loyalty.
Despite its widespread support in design, visual appeal does not offer any cognitive benefits to product usage. “The purpose of visual appeal in design is not to allow users to complete their task quicker, but to provide enjoyment, pleasure and fulfillment when doing so” (Vyas, Heylen, Eliens & Nijholt 2007, p. 2). Lavie and Tractinsky (2004) view the role of aesthetics as “satisfying the human requirements.” They argue that “visual appeal can make products more acceptable thus increasing their commercial value” (p. 275). Hassenzahl (2005) argues that visual appeal offer emotional benefits by “emphasizing the individuals' psychological well-being” (p. 35), thus
consistent with the view that aesthetics performs the function of satisfying the human requirements. Lindgaard et al. (2006) found that users are more forgiving of usability problems in websites which are visually appealing.
Research shows visual appeal to be strongly linked to hedonic feelings (Lindgaard, 2007; Desmet & Hekkert, 2007). Hassenzahl (2002) found visual appeal to be more
highly correlated with the hedonic attributes of a product than with pragmatic attribute. By hedonic attributes we mean the pleasurable emotions that are derived in an interaction
12
with a product or system. Norman (2003) argues that attractive things create pleasurable emotions by “making people feel good, relaxed, happy and in a pleasant mood” (p. 26). Influencing users’ emotions through visual appeal is important to product design because as Kahneman (1991) shows, customers’ decisions are influenced by their emotions. Schrepp, Held, and Laugwitz (2006) also conducted a study that showed that hedonic qualities have a greater influence on people’s preference for business management software than pragmatic qualities. Taking this one step further Li and Yeh (2010) demonstrated that website aesthetics can also influence customers’ trust in e-commerce websites. In essence, although it offers neither cognitive nor pragmatic qualities,
aesthetics play a pivotal role in shaping the user experience because of its effects on the emotions.
2.3 Emotions and the user experience
Isen (1994) demonstrated that positive affect promoted efficient cognitive organization and creative thinking. In one study, participants who were exposed to variables that stimulated positive emotions showed more creativity and performed significantly better at problem solving tasks than those who were not. Applying this concept to design, Norman (2003) argues that visually appealing products creates positive affect in users, which make them more creative. Therefore when a user encounters a problem with a product or interactive system, rather than being solely fixed on the problem at hand, these happy emotions helps the user to think of more innovative methods of solving the problem. Thus, rather than attempting to repeat the same
13
operation repeatedly, the user avoids frustration by finding an alternative solution to the problem.
Norman (2003) argues that life would be incomplete without emotions, and certainly user experience would be impossible without it. Jordan (1999) argues that products should be designed to create pleasure because as humans “we always have and will always seek pleasure” (p. 206). As discovered earlier, this pleasure is produced through the aesthetic appeal of a product (Desmet & Hekkert, 2007; Lindgaard, 2007; Norman, 2003). Hasseszahl (2004) describes the hedonic qualities of a product as having the ability to stimulate the user and fostering identification. Stimulation is achieved through novelty and aesthetics whereas “identification allows the user to express himself or herself through the product and communicates important personal values to relevant others” (p. 322).
2.4 Novelty and aesthetic response
Emotions are strongly influenced by aesthetics. However research has also shown aesthetics to be strongly correlated with novelty and in fact partly influenced by novelty. Novelty can be defined as “the perceived newness of the units and their organization, based on comparison of the present form with forms of past experience” (Fiore & Kimle, 2010, p. 381). According to Hekkert and Leder (2008), “based on our knowledge and previous experiences, we qualify something as familiar or novel, typical or strange, original or outdated” (p. 266). Novelty affects product attractiveness and creates a positive response in individuals (Veryzer & Hutchinson, 1998).
14
As human beings we take pleasure in acquiring new information and interacting with unfamiliar objects and therefore people are always searching for novel product designs (Baumgartner & Steenkamp, 1996; Biederman & Vessel, 2006). This behavior can also be explained by the human need for pleasure. Since novelty is correlated with visual appeal, we may always seek novelty in design because it looks more attractive and this appeal creates pleasure. As Desmet & Hekkert (2007) stated, because aesthetics influences pleasure “we are motivated to seek products that provide pleasure and avoid products that provide displeasure” (p. 62).
However the relationship between novelty and aesthetics is curvilinear. Although newer products are rated higher on visual appeal than typical product designs, aesthetical appeal is significantly decreased if the design deviates significantly from the typical. Moderately novel products were considered more aesthetically pleasing than extremely novel designs. The further a product deviates from the typical, the more difficult it becomes for the brain to fit it into existing knowledge and consequently that decreases its aesthetic appeal (Mandler, 1982). The solution is a balance between novelty and
typicality; it is balance that produces high levels of pleasure and increases the user experience. (Hekkert & Leder, 2008).
This behavior can be explained with Berlyne’s hypothesis that there is an
inverted-U curve between novelty and preference. According to this theory, an individual has preference for novel products, but only when the novelty is at a moderate level. If the design is excessively unusual, it is perceived to be less appealing (Berlyne, 1974). Hung and Chen (2009) demonstrated a similar behavior by presenting participants with a variety of chair designs. Highly typical and novel chair designs were rated lower in
15
aesthetics and appearance while those designs which received the highest scores were those with medium novelty. The results of their study confirmed an inverted-U function between preference and typicality. This extends beyond just users’ perception of
aesthetics. Mugge and Schoormans (2012) found that there was a negative correlation between products with a high degree of novelty and customer expectations. People perceive the usability of a product based on its level of novelty. This is especially true for less experienced users. The higher the level of novelty, the lower its perceived usability and the lower its aesthetic appeal.
2.5 Why focus on novelty in design
Novelty can be utilized as a powerful tool in product design and marketing. It has a significant impact on the user’s emotional experience (Brave & Nass, 2003), “creates curiosity and encourages exploration” (Lazzaro, 2003, p. 696). Novelty has a high aesthetic appeal and has the ability to attract attention (Hekkert, Snelders, & Van
Wieringen, 2003). In their study of consumer responses to product novelty, Radford and Bloch (2011) found that people exhibited more positive responses to novel products. Due to its visual appeal, novelty in design can be used as a tool to help marketers differentiate themselves from the competition and gain an advantage in the marketplace. (Cox & Cox, 2002; Cruesen & Schoormans, 2005). Designers are constantly exploiting this
relationship to create novel designs that appeal to consumers (Hung & Chen, 2012). According to Woll and Graesser (1982), innovative products catch attention and are better remembered. An explanation may be that consumers view newer or non-typical products as having higher saliency when compared to other products (Loken & Ward,
16
1990). Products are remembered in two ways: they are typical and encountered
frequently or they are atypical and therefore grab attention. For an e-commerce website competing with hundreds of other websites selling similar products, novelty offers far greater advantages. It takes the average internet user about 50 milliseconds to make a first impression of a website and decide whether to continue or move on to another webpage (Lindgaard, Fernandes, Dudek & Brown, 2006). The number of websites that the average internet user encounters every day is numerous and it is highly improbable that one particular website will be encountered enough to be remembered. In such situations novelty is the tool which sets one website apart from the competition.
As human beings, we have an innate preference for novelty. We take pleasure in acquiring new information and interacting with unfamiliar objects (Biederman & Vessel, 2006). As a result, people are always searching for novel product designs. Holbrook and Hirschman (1982) attribute this attraction to novelty as the individual’s need for variety. We can observe this behavior when we see people standing hours in line to buy the newest version of iPhone, iPad or one of the high end Android smart phones.
Baumgartner and Steenkamp (1996) demonstrated this in their research by presenting participants a succession of images. They observed that preference for images declined with each repetition.
2.6 Novelty and user experience
What is the role of novelty in the user experience? Using deductive reasoning, one can argue that since visual appeal influences the emotions and novelty affects visual appeal, it could be said that novelty affects the user experience. In fact Brave and Nass
17
(2003) sees novelty to have a significant impact on the emotional experience. Novelty affects product attractiveness and creates a positive response in individuals (Veryzer & Hutchinson, 1998). In their study of consumer responses to product novelty, Radford and Bloch (2011) found that people exhibited more positive responses to novel products. Berlyne (1974) attributes people’s positive reactions to novelty because it creates
pleasure. When an individual interacts with a novel design, it creates pleasure and that in turn positively influences the user experience.
A number of researchers have demonstrated a relationship between novelty and aesthetic appeal (Blijlevens et al., 2011; Hung & Chen, 2012; Mandler, 1982; Mugge, & Schoormans, 2011). It has also been demonstrated that high levels of visual appeal creates positive emotions (Hassenzahl & Tractinsky, 2006; Jordan, 1998; Norman, 2003; Tractinsky, 1997). Norman (2003) argues that attractive things create pleasurable
emotions by “making people feel good, relaxed, happy and in a pleasant mood” (p. 26). According to Biederman and Vessel (2006), humans take pleasure in acquiring new information and interacting with unfamiliar objects. As an individual interacts with a new unfamiliar product, the enjoyment of the activity creates a pleasant mood which allows him to overlook and forgive its faults and usability problems, thereby ensuring that he enjoys the experience. Novelty in design is really designing for the emotions and as stated by Sears and Jacko (2007) “emotional design seeks to make interactive products not only more efficient but also more pleasant” (p. 1285).
18
2.7 Parallax scrolling and user experience
Parallax scrolling has become a very popular technique in web design over the past few years. At the time of this writing, a quick search on Google for the term
“parallax scrolling” will yield multiple pages showing websites currently exploiting this technique to enhance the appearance and interactivity of their website and engage their visitors. The parallax scrolling effect allows multiple backgrounds in a webpage to move simultaneously at different speeds to create a 3D perception, thus enriching the browsing experience. In addition to its aesthetic appeal, parallax scrolling offers web designs an opportunity to directly draw the users’ attention and guide them to their products or ‘call to actions’. For example designers can create stories that can be revealed to users while scrolling down the webpage or in other cases, show users the functionality of a product in animated fashion. Many web designers acclaim parallax scrolling as a tool suited for enhancing the user experience, but due to its performance others argue otherwise.
Research shows that it generally takes a user 50 milliseconds to develop an impression of a website and decide whether he or she likes it (Lindgaard, Fernandes, Dudek, & Brown, 2006). However, in order for the parallax scrolling effect to work, all page elements and files must be loaded from the server unto the webpage before the user can start viewing the webpage. Compared to a typical website where a few images and elements are loaded to a webpage, all elements are loaded to a single webpage in parallax scrolling. Depending on the size and number of page elements, the page loading can last from a few seconds to over a minute. Depending on the user’s intention to use the website, this can determine whether he/she continues on the webpage or navigate to a new website. Although a relationship was discovered between usability and aesthetics
19
when a website was used for utilitarian purposes, the research show a different outcome when the purposes of use is hedonic (Hassenzahl, Kekez, & Burmester, 2002). Taking into account the shortcomings of parallax scrolling, this research seeks to investigate how parallax scrolling can influence the user experience.
2.8 Summary
A genuine pleasurable user experience seems to be determined by several factors intertwined and working together. Among these, visual appeal seems to be very dominant, and this is particularly due to its hedonic attributes. Taking this into consideration, this research study seeks to examine parallax scrolling, a particularly visually appealing web design technique and how it affects the user experience. This design technique seem to possess the traits to create a pleasurable user experience, however it lacks good usability. In view of this limitation, this research seeks to investigate how parallax scrolling will influence user experience and preference.
20
CHAPTER 3. METHODOLOGY
3.1 Research Framework
Research has revealed that a pleasurable user experience can create loyalty and determine the success of a product or technology (Garrett, 2006). An enjoyable user experience creates pleasure and as human beings we always seem to gravitate towards pleasure while migrating away from displeasure (Jordan, 1999). The purpose of this research is to find how novelty in web design affects preference and user experience. In this study the author seek to investigate the effects of parallax scrolling on subjective user experience.
3.2 Hypotheses
This study seeks to investigate the effects of parallax scrolling on web design. Group 1 contains the website utilizing parallax scrolling and group 2 contains the website with no parallax scrolling. The following hypotheses will be tested:
HO1: There are no significant differences in perceived usability between the two groups
HA1: There are significant differences in perceived usability between the two groups
21
HA2: There are significant differences in perceived enjoyment between the two groups
HO3: There are no significant differences in the fun user experience between the two
groups
HA3: There are significant differences in the fun user experience between the two groups
HO4: There are no significant differences in user satisfaction between the two groups
HA4: There are significant differences in user satisfaction between the two groups
HO5: There are no significant differences in visual appeal between the two groups
HA5: There are significant differences in visual appeal between the two groups
HO6: There are no significant differences in overall user experience between the two
groups
HA6: There are significant differences in overall user experience between the two groups
HO7: There are no significant differences in user preference between the two groups
HA7: There are significant differences in user preference between the two groups
3.3 Population
Participants for this study were recruited from Stewart Center at Purdue
22
hallway of Stewart Center. Participants who opted to take part in the research experiment were offered a chance to enter in a raffle for three gift cards of $20.00.
A sample size of 86 participants was used in the research experiment. This was consistent with previous research conducted in the field (Dudek, & Brown, 2006; Lindgaard, Fernandes, Hung & Chen, 2012; Sauer & Sonderegger, 2011). In keeping with other research (Al-Shamaileh & Sutcliffe, 2012; Lindgaard, Fernandes, Dudek, & Brown, 2006), a between group design was employed and participants were randomly assigned to one of two groups (43 in each condition).
3.4 Experiment Setup
The objective of this research experiment was to investigate how the independent variable (scrolling technique) affected the dependent variables (satisfaction, usability, enjoyment, visual appeal, and fun). These five variables have been shown to contribute to the overall user experience (Hassenzahl & Tractinsky, 2006; Norman, 2003). The
researcher decided to utilize a between-subject research design where scrolling technique was manipulated at two levels. An advantage of the between-subject design is that it prevents any carry over effects such as fatigue, boredom or practice that can affect and skew the results of the study. Since each participant was exposed to only one of two treatments, participants’ decisions were not affected by such extraneous factors (Gravetter & Forzano, 2011).
The control group in the experiment was assigned to work with the website not using parallax scrolling while the treatment group used the website employing the parallax scrolling technique. The parallax scrolling effect uses multiple backgrounds all
23
moving at different speeds to create a 3D perception, thus enriching the browsing experience. In order to limit the effects of other confounding variables, all other design elements in the websites were kept constant. The webpages in both experimental conditions looked exactly the same; with the only difference being the websites’ technique of scrolling.
All webpages contained the same content, same fonts and font sizes, same color and design, similar symmetry, overall the same level of visual appeal and usability. All web pages were highly designed in classic aesthetics, but expressive aesthetics varied depending on the experimental condition. Expressive aesthetics refers to elements of the website such as creativity and originality (Wang, Minor, & Wei, 2011) and because the experimental condition varied in scrolling effect, expressive aesthetics was not equal for both conditions. For example although the websites for both groups were visually identical, one utilized parallax scrolling while the other did not. This effect is only noticed when the user starts interacting with the website. The parallax effect is an example of expressive aesthetics and inevitable could not be equal for both groups. Parallax scrolling is a novel control that was be tested in this research experiment. By controls we mean a “manipulable, self-contained screen object through which the user interacts with the website” (Cooper, 2007, p. 439). Today, although many will consider page scrolling a necessary component of web design, there is debate on whether websites should continue scrolling or adopt paging. The purpose of this research was to make scrolling more fun and test whether it enhanced the user experience.
24
3.5 Procedure
Two hotel websites, identical in all respects apart from scrolling method were created by the author for use in this research experiment (see Figure 3.1). In order to test the websites in a real world environment, both websites were uploaded unto a server over the internet where participants accessed them. Two laptop computers with internet access were set up on a table in the lobby at the Stewart Center to conduct the experiment. (see Table 3.1 for the specifications of the computers).
Figure 3.1
25
Table 3.1
Specification for the computers used in the experiment
Computer specifications Laptop 1 Laptop 2
Computer model Asus K42JR Dell Latitude E6500
Operating System Windows 7 professional Windows 7 professional
Processor Intel core i5 Intel Core 2 Duo
Memory installed 6GB DDR3 4GBDDR2
Hard drive 320 GB 500 GB
Screen resolution 1366x768 1920x1200
Web browser used Mozilla Firefox 19.0.2 Mozilla Firefox 19.0.2
Students were intercepted as they passed by and asked to participate in the
experiment, which lasted no more than five minutes. Individuals who opted to participate in the experiment were randomly assigned to one of two experimental conditions.
Participants in each condition were presented with one version of the website.
Participants in condition 1 were presented with the website version utilizing the parallax scrolling effect while participants in group 2 interacted with the website without parallax scrolling. Prior to starting the experiment, participants were given a sheet containing the instructions to guide them through the experiment. Upon reading the instructions, participants navigated to a web address that was provided to them on the computer by directly clicking on the link or entering the provided URL in the address bar.
Participants were asked to spend between 30 seconds to a minute browsing the websites before they completed the two tasks. Upon browsing, participants from each experimental condition completed the tasks. The first task asked participants to complete a web form with their demographic information. Upon completion, participants were
26
presented with a notification that an error has occurred and were asked to repeat the process. This failed task was implemented to influence participants’ emotional response. This allowed the researcher to measure whether user attitudes and experience for the two experimental conditions were significantly different. For the second task, participants were asked to make a reservation on the website. The order of the two tasks was
randomized in order to reduce or eliminate any confounding variables not accounted for by the researcher. Each participant performed the experiment under the supervision of an instructor.
When the tasks were completed, participants answered a ‘fifteen- item posttest survey to measure their overall experience with the website. All survey items were measured on a 6-point Likert scale ranging from “strongly disagree” (1) to “strongly agree” (6). This survey instrument can be found in Appendix C.
3.6 Instruments
The validation of the research instrument is an integral part of any research project because it accounts for the reliability of the results. If the instruments used in a study are not validated, the results of the study cannot be trusted. “Validated instruments allow researchers to measure the same research constructs in the same way, which results in improved measurements of the dependent and independent variables” (Straub, 1989, p. 148).
The researcher referenced two validation guidelines in the validation of the research instrument used in this study. These included face validity and content validity. Face validity is the easiest form of validation and can be determined by looking at the
27
instrument with respect to clarity and organization and deciding whether it looks valid (Lord, French, & Crow, 2009). This was determined by the researcher before distribution of the survey instrument. Content validity examines whether the questions included in the instrument are representative of the area of study (Li & Yeh, 2010). In observation of this guideline, the researcher opted to use items from previously validated studies in the following arrangements: usability (Flavián, Guinalíu, & Gurrea, 2006), enjoyment (Cyr, Head, & Ivanov, 2006; Van der Heijden, 2004), fun (Cyr, Head, & Ivanov, 2006; Van der Heijden, 2004), satisfaction (Cyr, Bonanni, Bowes, & Ilsever, 2005; Sauer &
Sonderegger, 2011), and visual appeal (Cyr, Head, & Ivanov, 2006; Li, & Yeh, 2010). Survey questions were measured using a 6-point Likert scale and the subscales
(subcategories) within the survey were randomized to prevent response biases.
Cronbach's alpha was used to assess the reliability of scales and was measured against the reliability coefficient threshold of 0.6 as outlined in the literature (Hair, Anderson,
Tatham, & Black, 1998; Nunnaly, 1978).
3.7 Data Analysis
Data analysis was accomplished using the Statistical Package for Social Sciences (SPSS) software program. The experiment involved research participants responding to a questionnaire containing Likert scale items, which meant that analysis was performed on ranked data rather than numerical data. In order to adequately carry out this analysis, the Mann-Whitney non-parametric test was used to analysis the data. The Mann-Whitney test is the non-parametric equivalent of the independent samples t-test and was used to test the differences between the two experimental groups (Field & Hole, 2003). The
Mann-28
Whitney test was used because Likert scale items contain ordinal data rather than interval or ratio. In such instances parametric test methods cannot be used because of their strict assumptions.
3.8 Summary
The reliability of the results of a research project is dependent on the research framework. This chapter explains the overall design of this research project: hypothesis, variables, data analysis, instruments used, procedure, experimental set and the population sample. It gives the reader the opportunity to replicate the research if he/she so desires.
29
CHAPTER 4. RESULTS
The purpose of this research study was to analyze whether parallax scrolling, which has become a very popular strategy in web design can improve the user experience and preference of a website. In order to achieve this, the researcher designed two hotel websites which were identical in every respect except scrolling strategy and utilized a survey to analyze the differences in participants’ responses between them. This analysis was achieved through three processes. The first process involved documentation of the participants’ demographics to assess those who participated in the experiment. The second process involved running a reliability analysis on the survey instrument to analyze the reliability of the scales and the consistency of the items within those scales. Finally the Mann-Whitney test was used to test whether the differences that emerged between the groups were significant. This section provides a comprehensive overview of these
processes.
4.1 Demographics of participants
The following section describes the demographics of the participants in this research. A total of 86 individuals participated in the research experiment and completely filled out the survey. The experiment was conducted at the Stewart Center at Purdue University which is a central location, thus providing an equal opportunity for students
30
from all majors to be included in the research experiment. The majority of participants were from the College of Engineering and Liberal Arts, respectively representing 20.9% and 18.6% of the total sample. Of the remaining participants 12.7% were from the College of Health and Human Sciences, followed by the College of Science (11.6 %), College of Agriculture (8.1 %), College of Technology (8.1 %), College of Pharmacy (5.8 %), College of Education (5.8 %), Krannert School of Management (4.6 %), and the last three individuals were not affiliated with any department at the school. Figure 4.1 gives a detailed breakdown of this information.
Figure 4.1. Research participants by department.
With respect to age, 65.1 % of participants were 21 years old or younger, 33.7% ranged between 22 and 34 years and the last participant was between 55 and 64 years of
18 16 11 10 7 7 5 5 4 3 0 2 4 6 8 10 12 14 16 18 20 Represented Departments
Participants by Department
Frequency31
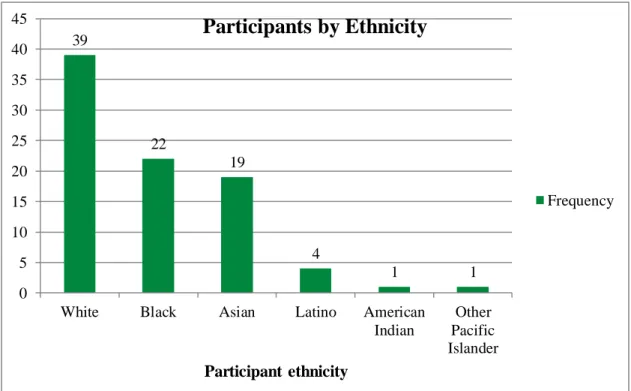
age. Overall there were a total of 40 male and 46 female participants in this research study, majority being white (45.3 %). Of the remaining participants, (25.6 %) were black, (22.1 %) were Asian, (4.7 %) Latino and the last two participants were American Indian and Pacific Islander. Figure 4.2 gives the numeric representation of research participants by ethnicity.
Figure 4.2. Research participants by ethnicity.
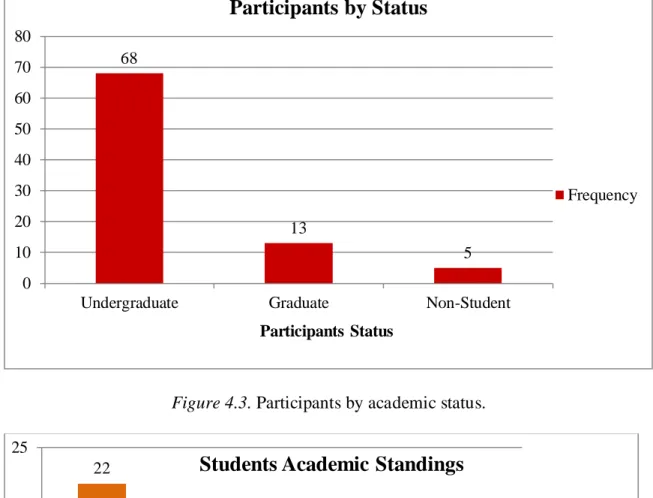
Seventy-one percent of participants were undergraduate students, 15.1% were graduate, while the other 5.8 % were non-students. Among the undergraduate participants, 26.5% were freshmen, 32.4% sophomores, 20.6 % juniors and 20.6% seniors. A detailed representation of participants in regards to academic status can be found in Figure 4.3 and Figure 4.4. 39 22 19 4 1 1 0 5 10 15 20 25 30 35 40 45
White Black Asian Latino American
Indian Other Pacific Islander Participant ethnicity
Participants by Ethnicity
Frequency32
Figure 4.3. Participants by academic status.
Figure 4.4. Students by classification.
68 13 5 0 10 20 30 40 50 60 70 80
Undergraduate Graduate Non-Student
Participants Status
Participants by Status
Frequency 22 18 14 14 0 5 10 15 20 25Sophomore Freshman Junior Senior
Undergraduate Classification
Students Academic Standings
33
4.2 Reliability analysis
Chronbach’s Alpha was used to assess the reliability and internal consistency of the items in the scales. Each value was measured against the reliability coefficient threshold of α = 0.6. The following are the results computed from the Cronbach's alpha for the items within each sub-category: usability, α = .806; enjoyment, α = .947; fun, α
= .860; satisfaction, α = .922; visual appeal, α = .899. The inter item correlation matrix also revealed consistently high correlations between the items within each scale; further validating the reliability of the survey instrument.
4.3 Analysis and hypotheses testing
It was assumed that parallax scrolling in web design would affect user experience and preference. As a result, seven hypotheses were formulated in support of this
postulation. These hypotheses along with the data analysis in their support or rejection will be found in this section. The Mann-Whitney test was used to find differences in participant responses between the two groups on the five dependent variables: usability,
enjoyment, fun, satisfaction, and visual appeal.
4.3.1 Usability
It was hypothesized that parallax scrolling would positively influence the perceived usability of the website. This was measured by the first three items of the survey instrument which can be found in table 4.1 below. The Mann-Whitney test failed to return any significant differences in participants’ ratings with regard to these items.
34
Table 4.1
Items from survey instrument measuring website usability
Q1. This website is simple to use, even when using it for the first time Q2. Downloading pages from this website is quick
Q3. The structure and contents of this website are easy to understand
Concerning Q1, participants thought that the website with no parallax scrolling (Mdn=6) was simpler to use than the website using the parallax scrolling effect (Mdn=5). From this point forward, ‘website 1’ or ‘group 1’ refers to the website utilizing the
parallax scrolling strategy whilst ‘website 2’ or ‘group 2’ alludes to the website with no parallax scrolling. Website 2 also received a slightly higher mean rank score (mean rank: 44.85) than website 1 (mean rank: 42.15) suggesting that users responded a bit more favorably to website 2. This result however was not statistically significant, U = 866.5,
p=.58, r = -.06. Participants from both groups believed the websites to load equally quickly, (Mdn=5), U = 879.5, p=.68, r = -.04. The mean rank for website 1 was 44.55 while website 2 had a mean rank of 42.45, but this difference is not significant
considering that the effect size was tiny (-.04). With regard to the Q3, participants
believed both websites were equally understandable, (Mdn=6), U = 900.5, p=.82, r = -.03. Table 4.3 confirms that overall user responses to the two websites were somewhat similar, considering that the mean rank differences between both groups was only 2. There was no evidence suggesting that website 1 significantly differed in usability from website 2. Therefore hypothesis 1 was rejected. For more detailed analysis, the Mann-Whitney test statistic is reported below in Table 4.2.
35
Table 4.3
Mean rank scores for groups 1 and 2. The group with the higher mean rank received higher scores from research participants.
Group N Mean Rank Sum of Ranks
Website is simple to use
ParallaxScrolling 43 42.15 1812.50
NonparallaxScrolling 43 44.85 1928.50
Total 86
Downloading pages is quick
ParallaxScrolling 43 44.55 1915.50
NonparallaxScrolling 43 42.45 1825.50
Total 86
Content is easy to understand
ParallaxScrolling 43 42.94 1846.50
NonparallaxScrolling 43 44.06 1894.50
Total 86
4.3.2 Enjoyment
The results returned from the Mann-Whitney test indicated that the two website versions did not differ significantly with respect to overall user enjoyment. Table 4.3 lists the items from the survey measuring this variable.
Table 4.2
Results of the Mann-Whitney test statistic with respect to Q1,Q2 and Q3
Website is simple to use Downloading pages is quick Content is easy to understand Mann-Whitney U 866.500 879.500 900.500 Wilcoxon W 1812.500 1825.500 1846.500 Z -.550 -.418 -.230
Asymp. Sig. (2-tailed) .583 .676 .818
36
Table 4.4
Items measuring website enjoyment
Q4. This website is pleasant to use Q5. I liked using this website
Q6. I found using this website to be enjoyable
With reference to Q4, website 1 (Mdn =6), was preferred slightly more than website 2 (Mdn =5). However this difference between the two websites was not
significant, U = 881, p=.68, r = -.04. Participants also seemed to like website 1 (Mdn =5) a bit more than website 2, (Mdn =5). Once again, the Mann-Whitney test failed to return any significant differences between the two websites, U = 829, p=.37 r = -.1. With respect to Q6, users’ seemed to have enjoyed website 1 (mean rank: 46.37) more than they did website 2 (mean rank: 40.63). However the user responses between the two groups did not significantly differ (Mdn =5), U = 801, p=.25 r = -.12. Therefore the hypothesis that parallax scrolling will improve perceived enjoyment was rejected. The SPSS output of the Mann-Whitney test statistic and mean rank scores are reported below in Tables 4.5 and 4.6.
Table 4.5
Results of the Mann-Whitney test statistic with respect to hypothesis 2
The website is pleasant to use I liked using this website This website is enjoyable Mann-Whitney U 881.000 829.000 801.000 Wilcoxon W 1827.000 1775.000 1747.000 Z -.411 -.890 -1.155
Asymp. Sig. (2-tailed) .681 .373 .248
37
Table 4.6
Mean rank scores for groups 1 and 2. The group with the higher mean rank received higher scores from research participants.
Group N Mean Rank Sum of Ranks
This website is pleasant to use
ParallaxScrolling 43 44.51 1914.00
NonparallaxScrolling 43 42.49 1827.00
Total 86
I liked using this website
ParallaxScrolling 43 45.72 1966.00
NonparallaxScrolling 43 41.28 1775.00
Total 86
This website is enjoyable
ParallaxScrolling 43 46.37 1994.00
NonparallaxScrolling 43 40.63 1747.00
Total 86
4.3.3 Fun
Hypothesis 3 predicted that users would have more fun interacting with website 1.
The Mann-Whitney test revealed a significant difference in the amount of fun users had interacting with website 1 relative to website 2. Table 4.7 lists the items measuring this dependent variable (fun).
Table 4.7
Items measuring how much fun users had interacting with the website
Q7. This website is interesting Q8. Using the website was exciting Q9. I had fun interacting with this website
38
Parallax scrolling significantly affected how interesting user believed website 1 was (Mdn =6), compared to website 2 (Mdn =5), U = 557, p = .001, r = -.37. With regard to Q8, the Mann-Whitney test also returned significant differences between group 1(Mdn
=5) and group 2 (Mdn =5), U = 592, p = .003, r = -.32. The analysis also showed medium sized effects for both items, confirming that the differences between the groups were substantial. With respect to Q9, users had significantly more fun interacting with website 1 (Mdn =5) than they did with website 2 (Mdn =5), U = 701, p = .043, r = -.22. However the effect size was smaller (.22), indicating that the difference between the groups was not as substantial as Q8 and Q9. Table 4.9 reports the mean scores from the two groups and it reveals a significant difference in the scores entered by the two groups. All three items returned significant results, thereby supporting the hypothesis that parallax scrolling is more fun. Table 4.8 below provides the SPSS output of the Mann-Whitney test for these three items.
Table 4.8
Results of the Mann-Whitney test statistic with respect to hypothesis 3
Website was interesting
Website was exciting
I had fun interacting with this website
Mann-Whitney U 557.000 592.500 701.000
Wilcoxon W 1503.000 1538.500 1647.000
Z -3.442 -3.007 -2.023
Asymp. Sig. (2-tailed) .001 .003 .043
39
Table 4.9
Mean rank scores for groups 1 and 2. The group with the higher mean rank received higher scores from research participants.
Group N Mean Rank Sum of Ranks
Website was interesting
ParallaxScrolling 43 52.05 2238.00
NonparallaxScrolling 43 34.95 1503.00
Total 86
Website was exciting
ParallaxScrolling 43 51.22 2202.50
NonparallaxScrolling 43 35.78 1538.50
Total 86
I had fun interacting with this website ParallaxScrolling 43 48.70 2094.00 NonparallaxScrolling 43 38.30 1647.00 Total 86 4.3.4 Satisfaction Table 4.10
Items measuring website satisfaction
Q10. I am satisfied with my performance on this website Q11. This website satisfies my particular needs well
Q12. The experience that I have had with this website has been satisfactory
The results of the Mann-Whitney test for the items in Table 4.10 were as follows and in the respective orders: U = 896, p=.8, r = -.02; U = 917.5, p=.95, r = -.006; U = 915.5, p=.94, r = -.008. The results returned no statistically significant differences between the two groups. Among the variables and hypotheses tested, the Mann-Whitney test reported the least differences between the groups with respect to user satisfaction.
40
Two of the items (Q11, Q12) returned a mean rank difference that was less than .5 confirming that users’ responses were particularly similar. Table 4.12 provides a detailed report of this information. The effect sizes were also relatively small (-.02, -.006, -.008)
providing further evidence that a difference did not exist between the groups.
Consequently the hypothesis that parallax scrolling would improve user satisfaction was rejected. The results of the Mann-Whitney test statistic on the items measuring
satisfaction can be found in Table 4.11.
Table 4.11.
Results of the Mann-Whitney test statistic with respect to hypothesis 4
Satisfied with my performance
Satisfies my particular needs
Website has been satisfactory
Mann-Whitney U 896.000 917.500 915.500
Wilcoxon W 1842.000 1863.500 1861.500
Z -.259 -.064 -.082
Asymp. Sig. (2-tailed) .796 .949 .935
a. Grouping Variable: Group
Table 4.12.
Mean rank scores for groups 1 and 2. The group with the higher mean rank received higher scores from research participants.
Group N Mean Rank Sum of Ranks
Satisfied with my performance
ParallaxScrolling 43 42.84 1842.00
NonparallaxScrolling 43 44.16 1899.00
Total 86
Satisfies my particular needs
ParallaxScrolling 43 43.66 1877.50
NonparallaxScrolling 43 43.34 1863.50
Total 86
Website has been satisfactory
ParallaxScrolling 43 43.71 1879.50
NonparallaxScrolling 43 43.29 1861.50
41
4.3.5 Visual appeal
Hypotheses 5 proposed that parallax scrolling would create greater visual appeal. Questions 13, 14 and 15 which are listed in Table 4.13 were used to test this hypothesis.
Table 4.13
Items measuring website visual appeal
Q13. The screen design (ie, colors, boxes, navigation bars, etc) is attractive Q14. The site looks professionally designed
Q15. The overall look and feel of the site is visually appealing
With respect to Q13, the Mann-Whitney test did not return any significant differences between group 1(Mdn=6) and group 2 (Mdn=6), U = 836, p=.39, r = -.09. Users however thought website 1(mean rank: 45.56) was slightly more attractive than website 2 (mean rank: 41.44) as defined by the differences in their mean rank scores.
On the other hand, the Mann-Whitney test returned statistically significant
differences in participants perception of the professional design of the websites, U = 633,
p=.005, r = -.31. Participants believed that website 1 (Mdn =6) looked more
professionally designed than website 2 (Mdn =5). The effect size (-.31) and the mean rank difference (13.26) was also moderately large, confirming that the differences in users’ opinions were significant. Table 4.15 reports the mean rank between the two groups.
With respect to the visual appeal of the two websites (Q15), users responses between website 1 (Mdn=6) and website 2 (Mdn=5) did not significantly differ, U =
42
759.5, p=.11, r = -.17. However the differences were noticeable. Group 1 reported a mean rank score of 47.34 while group 2 a mean rank of 39.66; a mean rank difference of 7.68. Although it is not significant, it does show that participants believed that website 1 was more visually appealing than website two. The results of the Mann-Whitney test statistic on the items measuring satisfaction can be found in Table 4.14.
Table 4.14
Results of the Mann-Whitney test statistic with respect to hypothesis 5
Screen design is attractive
Website is professionally designed
Look and feel is visually appealing
Mann-Whitney U 836.000 633.000 759.500
Wilcoxon W 1782.000 1579.000 1705.500
Z -.863 -2.833 -1.581
Asymp. Sig. (2-tailed) .388 .005 .114
a. Grouping Variable: Group
Table 4.15
Mean rank scores for groups 1 and 2. The group with the higher mean rank received higher scores from research participants.
Group N Mean Rank Sum of Ranks
Screen design is attractive
ParallaxScrolling 43 45.56 1959.00 NonparallaxScrolling 43 41.44 1782.00 Total 86 Website is professionally designed ParallaxScrolling 43 50.28 2162.00 NonparallaxScrolling 43 36.72 1579.00 Total 86
Look and feel is visually appealing
ParallaxScrolling 43 47.34 2035.50
NonparallaxScrolling 43 39.66 1705.50
43
While participants differed significantly in their opinions of the professional design of the website, the questions directly related to the visual appeal of the website did not return any significant results. In essence the participants from both groups believed the website to be equally attractive and as a result hypothesis 5 was rejected.
4.3.6 User experience and preference
Hypotheses 6 and 7 predicted that parallax scrolling would improve user experience and positively influence user preference. However, since a pleasurable user experience is dependent on website usability, enjoyment, fun, satisfaction, and visual appeal (Hassenzahl & Tractinsky, 2006; Norman, 2004), the other five hypotheses in this experiment would need to be true if these two hypotheses were to be supported. However four of those five hypotheses were rejected. Therefore hypothesis 6 and 7 were rejected. There was not sufficient evidence to show that parallax scrolling in a website will improve user experience and preference.
4.3.7 Summary
It was hypothesized that parallax scrolling would improve user experience and influence user preference. However the acceptance or rejection of these hypotheses depended on whether parallax scrolling improved perceived usability, enjoyment, fun, satisfaction, and visual appeal. These five variables have been claimed to directly affect overall user experience. With the exception of ‘fun’, the Mann-Whitney test failed to return any significant differences between the two experimental groups with respect to
44
these variables. Therefore the hypothesis that parallax scrolling improves user experience and preference was rejected.
45
CHAPTER 5. DISCUSSION
The objective of this research experiment was to analyze the effects of parallax scrolling on overall user experience. Seven hypotheses were made with the expectation that this upcoming web design practice would improve user experience and consequently user acceptance and preference of a website. However, the results of this research
experiment clearly revealed that this is not the case.
Hypothesis 1 predicted that users would perceive website 1(website using parallax scrolling effect) as more usable. This assumption was made based on the results of
previous studies claiming that there is a strong correlation between the visual appeal of an interface and its perceived usability (Kurosu & Kashimura 1995; Tractinsky, 1997; Tractinsky, Katz, & Ikar, 2000). Questions 1, 2, and 3 of the survey were designed to test this hypothesis; however users’ responses in regard to these items did not differ
significantly between the two groups. Although this was not significant, group 2 (no parallax scrolling) reported a higher mean rank than group 1(parallax scrolling),
suggesting that website 2 was simpler to use. This may be attributed to the fact that many of the participants had not had any experience with parallax scrolling in a website prior to this experience. This result is consistent with the claim that the apparent usability of a product is a function of the user’s expertise (Mugge & Schoormans, 2012).