Piracy in Commercial vs. Open-Source Software
Competition
∗Arne Rogde Gramstad† University of Oslo
May 15, 2014
Abstract
I develop a model to study competition between a commercial software provider and a free-of-charge open-source software substitute in the presence of network ex-ternalities and software piracy. Whenever the commercial software product is en-dowed with a large installed base of users relative to the open source competitor, it may be feasible to strategically set the price such that a critical mass of users is not attainable for the open source product. I coin this pricing strategy ”network strategic pricing”. The commercial software provider will take the entire relevant market whenever network strategic pricing is imposed. When piracy is included in the model, network strategic pricing turns out to be more likely to be the optimal pricing strategy relative to the no-piracy benchmark. This is because the cost of im-posing network strategic pricing (i.e, the price effect) is lower when piracy is present. I also provide empirical evidence suggesting that software piracy has a negative im-pact on usage of the open-source operating system Linux.
JEL classification: L13; L17; O34
Keywords: Piracy, open-source software, pricing strategies, duopoly ∗
I would like to thank Torben Mideksa, Tore Nilssen and Espen Stokkereit for helpful comments and suggestions.
†
1
Introduction
This paper analyzes optimal pricing strategies for a seller of a commercial software product facing competition from a free-of-charge open-source software product and illegal copies of the commercial product. The primary objective is to understand how incentives for strategically using network externalities in the pricing decision are affected by the presence of piracy.
According to the 2011 BSA Global Piracy study an estimated 42% of all commer-cial software used in 2011 was illegally pirated (Business Software Alliance, 2012). In addition to the substantial impact software piracy is likely to have on the profitability of software firms, the market structure will necessarily be affected given the size of this illicit economy.
The entry of successful free and open-source software (FOSS) products the recent decades has transformed the information technology industry. As the world has become increasingly connected, collaboration in the development of open-source software has been immensely facilitated. A wide range of free-of-charge software products are now able to compete with their proprietary counterparts, and have even come to dominate certain segments of the software markets, such as web servers (Apache) and operating systems for mobile phones (Android).
Commercial software products still dominate other segments of software markets, de-spite the availability of free-of-charge open-source substitutes. Office suites like OpenOf-fice and LibreOfOpenOf-fice are far less popular than the dominant Microsoft OfOpenOf-fice in user shares, and less than 2% of desktop computers run a Linux-based operating system.1
These large differences in market shares are likely to be explained by network ex-ternalities. That is, the value to consumers of some software products increases in the size of the installed base. Products may exhibit network externalities, either directly if individuals prefer to use the same products as those they interact with, or indirectly if the quantity and quality of compatible applications is increasing in the installed base.2 For products exhibiting network externalities, adoption can be ”tippy” in the sense that
1
Net Market Share. Desktop Operating System Market Share. http://www.netmarketshare.com/ operating-system-market-share.aspx?qprid=8&qpcustomd=0(accessed December 9, 2013).
2See e.g. Katz and Shapiro (1985) for a general treatment of network externalities. Products where the
quantity of compatible application increases in the installed base are typically ”two-sided” in the sense that there exists positive externalities between consumers and developers of compatible applications, see e.g. Rochet and Tirole (2006).
consumers demand the size of the installed base to exceed a threshold in order to be willing to obtain the good. In that case, there exists a so-called critical mass of users necessary for self-sustained adoption a product.3
Assuming the existence of a critical mass, this paper identifies a pricing strategy in which the seller of the commercial product deliberately sets the price such that a critical mass of users is not attained for the open source competitor, a strategy coined ”network strategic pricing”. In turn, the entire market is captured by the commercial software product. The optimality of imposing such a strategy depends among other things on the initial size of the installed bases of the products and the price reduction relative to ”passive” pricing where both products have installed bases exceeding the critical mass. When pirated versions of the commercial product are available to consumers, ”net-work strategic pricing” is more likely to be imposed. The explanation is two-fold: First, piracy increases the size of the installed base of commercial software. Second, competi-tion from illegal copies causes downward price pressure of legal copies. These two effects reduce the price reduction from ”passive” pricing to ”network strategic pricing” where the critical mass of the installed base is not attained for the open source product.
Therefore, based on the model presented in this paper, it can be argued that piracy may significantly affect the way commercial software vendors react to competition from free and open-source software products, and that the price reduction following competi-tion from software piracy is too large to be explained by piracy alone.
The observed behavior of seemingly low prices offered major software firms may partly be explained by the model in the present paper. In the United States v. Microsoft Corp. (2001) antitrust case, expert witnesses argued that the pricing of Microsoft Win-dows was ”too low (...) to be legally classified as a monopoly.”4 Although Microsoft exercises price discrimination of their products, low prices, especially to the non-business segment, remain today. For instance, the Windows 8 license to original equipment man-ufacturers (OEMs) is currently priced at just $15.5 One explanation for this pricing
3Economides and Himmelberg (1995) define a critical mass as the smallest network size supported in
equilibrium.
4”Pricing at Issue As U.S. Finishes Microsoft Case”. New York Times, January 6, 1999,
http://www.nytimes.com/1999/01/06/business/pricing-at-issue-as-us-finishes-microsoft-case. html(accessed April 29, 2014).
5
”Microsoft Said to Cut Windows Price 70% to Counter Rivals”. Bloomberg, February 22, 2014,
http://www.bloomberg.com/news/2014-02-22/microsoft-said-to-cut-windows-price-70-to-counter-rivals. html(accessed February 27, 2014).
behavior may be the threat of successful adoption of competing open-source products. Open-source software is the generic term for a class of software products released under a public copyright license, i.e., the users (or licensees) are given the right to freely copy or change the product. The source code (the ”recipe”) is publicly available, and the product will therefore usually be free of charge once a software product is released. Open source licenses may be ”restrictive” in the sense that licensees are restricted to release copies or modified versions under the same license as the original version, which ensures that the product remains open source (e.g. the General Public License (GPL)). Open source licenses can also be ”unrestrictive” in the sense that licensees are more or less unrestricted in the type of license modified and copied versions can take (e.g. the Berkeley Software Distribution (BSD) license).
Development of open source software happens both through contributions by volun-teers and in firms. Lerner and Tirole (2002) argue that voluntary contributions to open source development may be explained by peer recognition and job market signaling, while a survey by Lakhani and Wolf (2005) finds that enjoyment-based motivation is the most important factor. An extensive survey by Lerner and Schankerman (2010) sug-gests that there exist economies of scope between open source and closed source software development, explaining why open source development is more likely to take place in large firms. Also, firms engaging in development of customized software are more likely to develop under an open source license. In general, there might be cost savings and qualitative benefits for firms developing open source software since users can help iden-tify bugs in the code as well as contributing to the development themselves. However, by developing open source software, for-profit firms must be able to generate revenue from complementary products such as software applications, advertising, and customer support. Firms may also benefit from releasing unsuccessful proprietary (closed source) software products under an open source license.6
Related literature: The present paper relates to previous research on pricing of goods exhibiting network externalities as well as the literature concerning software piracy and commercial vs. open-source competition specifically. The concept of strategically taking advantage of network externalities in the pricing decision is explored by among others Fudenberg and Tirole (2000). They assume that the market has room for only one
6
The web browser Mozilla Firefox and the office suite OpenOffice are both examples of initial propri-etary products re-released under open source licenses (from Netscape Navigator and StarOffice, respec-tively). See Caulkins et al. (2013) for a theoretical approach to such firm behavior.
vendor of a network good, and that the incumbent may find it optimal to set a low price in order to discourage entry of a firm selling an incompatible network good. Cabral (2011) also finds that firms with large networks may choose to reduce the price. This is because larger firms have more to gain from increasing the network size, and may thus cut the price if the concern for future profits dominates present profits.
This paper is most closely related to the literature on pricing in commercial vs. open source software competition. The contribution by Casadesus-Masanell and Ghemawat (2006) is most likely the paper closest to the present one as they not only address com-mercial vs. open source software competition, but also extend the analysis to include software piracy. In a dynamic Windows vs. Linux duopoly model with network exter-nalities they show that Windows may use a forward-looking pricing strategy ensuring that the market does not tip to Linux dominance, despite an assumed competitive ad-vantage to Linux from user-development. By extending the model to an exogenously given piracy rate of Windows they find larger steady-state differences in user shares be-tween Windows and Linux. However, without an endogenous piracy rate, the scope of their analysis is limited.
Economides and Katsamakas (2006) consider a model of two-sided platform compe-tition between a proprietary and an open source platform, applicable to e.g. operating systems with compatible proprietary applications. By assuming higher relative switch-ing costs to the open source platform as well as low substitutability between platforms, they find that the proprietary platform is more likely to dominate the market.
While not explicitly modeling two-sided platforms Bitzer (2004) reaches a similar conclusion, that survival of proprietary software products is conditional on maintaining a high degree of product heterogeneity. In my own model I find that a high degree of heterogeneity (or product differentiation) is likely to yield an equilbrium with co-existence of the two products without piracy, while high product differentiation combined with the existence of piracy may incentivize the developer of the proprietary product to impose a pricing strategy that causes the proprietary software product to dominate the market.
Other papers explicitly take investment and development into consideration. Lanzi (2009) considers a duopoly model where the proprietary provider maximizes profits, while the open source community maximizes the number of users. In addition, he as-sumes that the technological skill level of consumers differ, and that higher skills are
needed to be able to use open source software. He finds that the market outcome de-pends on the difference in skill-level needed to be able to operate open source software compared to the proprietary competitor.
Lee and Mendelson (2008) model open source development as a function of consumer surplus and intrinsic value to contributors. The competitive outcome and level of in-vestment depend among other things on timing and product compatibility. One result is that the potential threat from open source may induce the commercial software firm to increase investments in development and lower prices.
Mustonen (2003) provides a model where programmers choose whether to be em-ployed by a commercial software firm or join the open source community to signal their skills. Co-existence of the two types of software products depends on implementation costs and whether the commercial software firms can attract a sufficiently large share of the programmers. He finds that market outcomes with dominance by both open source and commercial software may occur.
In the theoretical literature on software piracy it is argued that software piracy can be used as a commitment to intertemporal price discrimination (Takeyama, 1997), as a device for signaling of quality (Takeyama, 2003), and as a method of by-passing antitrust regulation on predatory pricing (Ben-Shahar and Jacob, 2004). Moreover, the impact from piracy on price and quality may differ substantially between short run and long run equilibria (Bae and Choi, 2006). Survey literature suggests that among students, price is the most important motivation for obtaining pirated products over legal copies (Cheng et al., 1997), while norms and fear of punishment are of equal importance among working adults (Peace et al., 2003).
Piracy and competition is adressed by among others Shy and Thisse (1999), Jain (2008), and Rasch and Wenzel (2013). This work suggests that limited copy protection can be optimal for the software industry if network externalities are strong (Shy and Thisse, 1999), and may be beneficial to firms even in the absence of network externalities since piracy might reduce price competition (Jain, 2008). Rasch and Wenzel (2013) address the trade-off between user surplus and software developers’ surplus of copy protection in two-sided platform competition. For a general treatment on piracy of digital products, excellent literature reviews are provided by Peitz and Waelbroeck (2006) and Belleflamme and Peitz (2012).
without software piracy, while the model is extended to include piracy in part 3. Part 4 discusses the model’s implications by comparing the results from the models in the two preceding parts. Empirical evidence is presented in part 5. Part 6 concludes.
2
Benchmark model: No piracy
As a benchmark, competition is analyzed without the availability of illegal copies. The first benchmark model is a simple location model in which a commercial software provider faces competition from a differentiated free-of-charge substitute. Network externalities are added to the model by imposing a restriction of users requiring that the total user share of a given software product must exceed a given critical mass in order to obtain the product.
There are two types of software products available, W (as in Windows) and L (as inLinux). As the choice of notation suggests, W is the commercial type and is sold at some price p, whileL is the open source type which is free of charge. The two products are substitutes, and customers can only choose to obtain one of the two types. Hence, there exist two products, but only one price.
We consider a population of software users of size normalized to one. There are two types of software users: new users, who make up a share σ of the population, and old users with a share of 1−σ. The new users will have to choose between purchasing W
and downloading L for free. The old users are assumed to have made their decisions on which product to obtain earlier, and will not revise their decision. Hence, it is not possible to extract further profits from the old user population.
Among the old user population a share (1 +λ)/2 belong to theW network, while the rest (1−λ)/2 belong to he Lnetwork. Since user shares only take non-negative values, we have λ∈[−1,1].
The measures of old users of W and Lare therefore given by
Wold= (1−σ)(1 +λ)/2 and
Lold= (1−σ)(1−λ)/2,
respectively. Clearly, ifλ= 1 the entire old user population will beW users. Likewise,
Wold and Lold can be interpreted as an exogenous installed base of each software product. For instance, as of January 2014 approximately 30% of all desktop computers run Windows XP, an operating system released in 2001.7 These numbers suggest there is a population of significant size contributing to the network size of all Windows ver-sions, while having a negligible direct effect on Microsoft’s revenue. Whenever network externalities are assumed away, the old users will not affect prices and can therefore be disregarded.
2.1 No network externalities
New users, the section of the population who choose between purchasingW or download-ingLfor free, are uniformly distributed over a line of lengtht. W is located at−t/2, and
L is located at t/2, where t >0. The valuation to the median consumer is denoted vW
andvL for each software type. A taste variableω uniformly distributed over [−t/2, t/2],
represents heterogeneity in preferences among consumers. Payoffs for a consumer with taste ω from purchasing W and downloading L are given by UW = vW −p− 12ω and UL=vL+12ω, respectively.
An increase in t will on average increase (decrease) the benefit of using W (L) for any consumer with a taste variable ω < 0. To take a concrete example this parameter can measure the differentiation between the product with regards to simplicity and customizability. Consumers with preferences leaning towards closed source software might prefer a simple system with little room for customizing, while consumers leaning towards open-source software will increase their benefit when the system becomes more customizable.8 Note that there is only one price given despite the existence of two products. A new user will choose to purchase W at pricepover downloadingL for free ifUW ≥UL, i.e., whenever:
(vW −p)−vL≥ω,
which implies that Lis preferred toW when the opposite is true: (vW −p)−vL< ω.
7
Net Market Share. Desktop Operating System Version Market Share.http://www.netmarketshare. com/operating-system-market-share.aspx?qprid=10&qpcustomd=0(accessed February 3, 2014).
8
Open-source operating systems like Android and Linux desktop distributions are known to be more customazible than proprietary substitutes like Windows and iOS. Increased customizability may to some degree be at the cost of simplicity for the end-user.
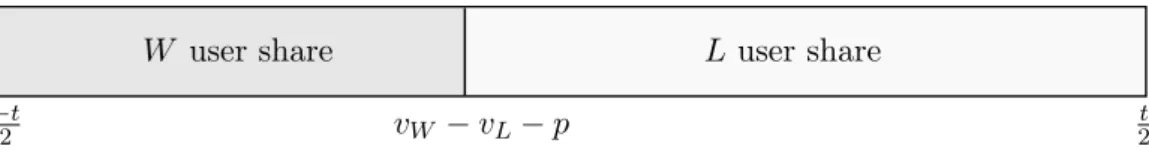
W user share L user share vW −vL−p −t 2 t 2
Figure 1: User shares among new users for a given level of quality and price
The consumer indifferent between the two products is given by the taste ¯ω=vW−p− vL. Demand forW as a function of the price is therefore the integral of all consumers with
tasteω ∈[−t/2,ω¯]. Likewise, demand for L as a function of the price ofW is integral of consumers with taste ω∈(¯ω, t/2]. The subscript ”0” in the demand functions below denotes absence of network externalities.
W0new(p) = 0 ifvW −p−vL≤ −2t σ(12 +vW−vL−p t ) if− t 2 ≤vW −p−vL≤ t 2 σ ifvW −p−vL≥ 2t (1) Lnew0 (p) = σ ifvW −p−vL≤ −2t σ(12 −vW−vL−p t ) if− t 2 ≤vW −p−vL≤ t 2 0 ifvW −p−vL≥ 2t. (2)
I will only focus on interior solutions for the study of the market without network externalities, i.e. t is assumed to be sufficiently large in order for the restriction −t
2 ≤
vW −p−vL ≤ t2 to be true for any profit maximizing price, p.9 Figure 1 provides a
graphical representation of the market shares at a given price.
Maintaining the assumption on interior solution, the profit maximizing price for the developer of W is straightforward.
p0= arg maxpW0new(p)p The first order condition solves the optimal price:
p0 =
t
4+ 1
2(vW −vL) (3) By inserting equation (3) into equations (1) and (2), equilibrium user shares for the new user population are found:
W0new(p0) =σ( 1 4 +
vW −vL
2t ) 9It will be clear shortly that this restriction specifically requires vW−vL
t ∈[−
1 2,
3 2].
Lnew0 (p0) =σ( 3 4 −
vW −vL
2t )
From the above expressions it is easily seen that, in the case of equal quality for the median consumer, the market will be divided with 1/4 of the new users users purchasing
W, while the rest 3/4 will downloadLfor free. This follows from the assumption of zero marginal cost and linear demand functions.10
The profits to the developer of W at optimal pricep0 is:
π(p0) =σ[ 1 4 + vW −vL 2t ][ t 4 + 1 2(vW −vL)] (4) The total user shares between the two software products as functions of price p, i.e. the sum of old and new users, are given by the following equations:
W0(p) =σ( 1 2 + vW −vL−p t ) + (1−σ) 1 +λ 2 (5) L0(p) =σ( 1 2− vW −vL−p t ) + (1−σ) 1−λ 2 . (6)
The total installed base for each software type is not of importance when network ex-ternalitites are absent. In the next subsection equations (5) and (6) turn out to be important when the developer ofW considers the optimal pricing strategy.
2.2 Network externalities
When modeling network externalities, the model assumes the existence of a critical mass, a minimum number of adopters of a technology sufficient for self-sustained further adoption, or following the definition of Economides and Himmelberg (1995): a critical mass is the smallest network supported in an equilibrium. Alternatively, the critical mass can be interpreted as atipping point in which the adoption converges to zero for a network size below the tipping point, while adoption converges to some positive number larger than the tipping point otherwise. As pointed out by among others Allen (1988), the outcome of such markets is difficult to predict since a prospective member of a network will decide to join the network only if it is expected that at least a critical mass of others also join. Hence, markets with the existence of a critical mass typically have multiple equilibria based on whether consumers are successfully able to coordinate their actions.
10
Such game theoretical considerations are avoided by implicitly assuming expectations based on market shares without network externalities. If e.g. a prospective L user observes that total user share forLin equation (6) is above the critical mass at a given price when network externalities are absent, she expects the situation to persist in the presence of network externalities. On the other hand, if this user share is below the critical mass, she will expect that no one will obtainL, and will therefore choose not to downloadL herself.
Network externalities are added to the model by introducing the parameter N ∈ [0,1/2] which represents the mentioned critical mass demanded by new users to be willing to obtain a piece of software in question. Technically, the model assumes that users’ valuation is zero for a piece of software with user share below critical mass. I denote the median new user’s valuation for the two software goods as uW and uL. A
new user at location ω will value the two products as follows:
uW − 1 2ω = ( vW −12ω ifW0(p)> N 0 ifW0(p)≤N uL+ 1 2ω= ( vL+12ω ifL0(p)> N 0 ifL0(p)≤N.
Hence, if the user share of a software good is above critical mass, the perceived quality is the same as in section 2.1 where there are no network externalities involved. Otherwise, the software good in question is perceived as worthless.
Demand functions for the two software types, depending on user shares being above critical mass, can be shown to be:
WNnew(p) = W0new(p) ifW0> N and L0 > N min{σ, σ(12+ vW−p t )} ifW0> N and L0 ≤N 0 ifW0≤N and L0 > N (7) LnewN (p) = Lnew0 (p) ifW0 > N and L0 > N 0 ifW0 > N and L0 ≤N min{σ, σ(12 +vL t )} ifW0 ≤N and L0 > N. (8)
The subscript ”N” in the demand functions denotes the presence of network exter-nalities.11 W0 and L0 are described in equations (5) and (6). Hence, if demand for
Lnew0 −1(p) N −Lold pN Wnew N −1(p) p−N p p L W
Figure 2: Network strategic pricing will lead to increased demand forW following lack of viable open source substitutes.
both software types exceeds the critical mass, then the demand functions are identical to those in the benchmark where network externalities are unimportant. Provided that
Lold< N, the developer of the commercial software type has an additional pricing strat-egy: To set the price such thatLnewN (p) = 0. From equations (7) and (8) it is clear that this pricing strategy will lead to a positive shift in demand for W, while demand for
L will be zero among new users. The effect on demand for W from network strategic pricing is illustrated in Figure 2: For prices less than or equal topN, the user share ofL
is below critical mass and is regarded as worthless. Therefore, a discontinuous increase in demand forW occurs at this exact price due to lack of valuable substitutes. In effect,
W is a monopolist whenL0(p)≤N. However, the monopoly power is constrained since
W is limited in the price setting since any price above the threshold such thatL0(p)> N would causeW to lose its monopoly position.
For the remainder of the paper I will assume that parameter values are such that
W0(p0)> N andL0(p0)> N.12 That is, at the profit maximizing prices where network externalities are absent, both software types have user shares above critical mass. Hence, the developer of W does not need to lower the price to ensure its own existence, and user shares ofLwill not fall below critical mass unless the seller ofW makes a strategic pricing decision with the attempt to pull demand forL below critical mass.
The network strategic price,pN, is given by the equalityLnew0 (pN) +Lold=N. The
12In other words,N−Lold< σ(3 4− vW −vL 2t ), andN−W old< σ(1 4+ vW −vL 2t ).
0 0.1 0.2 0.3 0 0.01 0.02 0.03 p π(p) (a) N=.26 0 0.1 0.2 0.3 0 0.02 0.04 p π(p) (b)N =.29
Figure 3: Profit functions with kinks. Network strategic pricing more likely for largerN. Parameter values: σ= 0.5, vW =vL=t=λ= 1. solution is: pN = t σ(N−L old) +v W −vL− t 2. (9)
As before, Lold= (1−σ)(1−λ)/2. Conditional on the network strategic price being imposed, the profits for the seller of W is given by:
π(pN) = min n σ, σ(1 + vL t )−N +L oldot σ(N −L old) +v W −vL− t 2 . (10)
Obviously, the output effect by imposing network strategic pricing is large. However network strategic pricing may also imply a large price reduction. As is clear from equa-tion (9), pN is increasing in N. Intuitively, the larger the critical mass is, the less the
price must be reduced in order to force demand forL below critical mass.
As Figure 3 illustrates, the size of N is crucial for the optimal pricing strategy. The profit function will have a kink at the network strategic price, pN: For p ≤ pN, new
users will not demandLfor any price, while for p > pN, both software types exist in the
market for new users, and demand forW will drop once the price exceed the threshold
pN. The larger N is, the smaller is the price differential between pN and p0, and pN is
more likely to be the profit maximizing price.
Among other parameters of interest it is easy to check that ∂π(pN)
∂λ > ∂π(p0) ∂λ = 0, and ∂π(pN) ∂t < ∂π(p0)
∂t for sufficiently small N.
13
13IfN−Lold≤σvL
t , then the restriction isN−L
old< σ[9 16−
(vW−vL)2 4t2 ].
Hence, in the absence of piracy, network strategic pricing is more likely to occur whenever W has the benefit of a large installed base (λ close to one) and when the degree of differentiation is small (smallt).
2.3 Welfare
Since long-run considerations from piracy and pricing strategies in OSS vs. commercial software competition is not considered in the model, a welfare analysis is somewhat limited. Within the model one unambiguous welfare result is derived: the social optimum will not be realized in the market solution. When network externalities are either not present or not important for the pricing decision, too few will use the commercial software type and too many will use open source software. When network strategic pricing is imposed the opposite is the case: too many will use commercial software and too few (none) will use open source software.
2.3.1 First best
Since marginal cost is assumed to be zero and investment costs are sunk, the social surplus is equivalent to the gross consumer surplus. The payoff of the old users is not defined, thus the welfare analysis will only apply to the gross welfare of new users. Accordingly, the welfare results will be normalized to σ, the new user population size. The gross value of usingW andLfor a consumer at locationω isvW−12ωand vL+12ω,
respectively. First best allocation is given by: max m Z m −t/2 (vW − 1 2ω)dω+ Z t/2 m (vL+ 1 2ω)dω,
wherem is the marginal user who values the two software products equally. The maxi-mization problem has the solution:
m∗ =vW −vL.
The first-best user shares among new users are then given by:
W∗ = 1 2 + vW −vL t L∗= 1 2 − vW −vL t . IfN−Lold>σvL
t , then the restriction isN−L
old< σ[3 4+ 1 2t p (vL−vW)(5vL−vW)].
The maximized social surplus becomes: W FF B = t 2 8 + t 2(vW +vL) + 1 2(vW −vL) 2.
First best is only implemented if the commercial software providers gives away the product for free. Arguably, the first best allocation is unlikely to be achieved. The rest of the welfare analysis will therefore focus on welfare in the market solution.
2.3.2 No network externalities
When network externalities are non-existent or is not accounted for in the pricing deci-sion, the profit maximizing price isp0 given by equation (3). It can be shown that under this price the consumer indifferent betweenW andL will be located at:
m0 = −t 4 + 1 2(vW −vL) = −t 4 + 1 2m ∗ The social surplus under price p0 is then:
W F0=W FF B − t 4(vW −vL)− 1 8(vW −vL−t/2) 2
Welfare result 1. The user share of commercial software is too small, and user share of open source software is too large in the market solution with price p0.
The reason for the welfare maximum not being attained is due to the market power the commercial software provider obtains from product differentiation. Marginal cost is zero, and the price is higher than the marginal cost at the profit maximizing price. Hence, some consumers will choose to download the open-source software product for free, even if the gross benefit from the commercial software type is higher.
2.3.3 Network strategic pricing
When network strategic pricing is imposed there are two opposing effects in play. On one hand, open source software will not be available which will reduce the payoff of individuals with high values of ω. On the other hand the commercial software product will be available at a lower price. The location of the worst-off consumers who will obtain
W is:
Note that if (N −Lold)t < σvL there will be no effects on aggregate consumption. The
social surplus when network strategic pricing is given by:
W FN = Z mN −t/2 (vW − 1 2ω)dω = ( tvW if (N −Lold)t≤σvL tvW −2t(vW −8t)− (N−L old)t σ −vL vW −14(N−L old)t σ if (N −Lold)t > σvL
Intuitively, the degree of differentiation matters, even if there are no aggregate effects on quantity. If the degree of differentiation is small, the negative welfare effects are not substantial sinceW is a close substitute toL. If the two products are more differentiated, welfare is more likely to be reduced. The following welfare result summarize the welfare effects relative to the price where network externalities are not directly accounted for in the price.
Welfare result 2. Network strategic pricing increases welfare relative to p0 if and only
if vW > vL and:
t <6(vW −vL).
This welfare result implies that network strategic pricing will always reduce welfare if there are no quality differences between the two products for the median user,vW =vL
sincetis strictly positive. When there are no quality differences, the pricep0 yields user shares of 1/4 and 3/4 betweenW and L. When network strategic pricing is imposed a share 1/4 will increase their gross surplus (user with ω < 0 who download L at price
p0), while a share 1/2 will be worse off (all users with ω >0).
Relative to the social optimum there will be over-consumption of commercial software and under-consumption (zero) of open source software.
Welfare result 3. The user share of commercial software is too large, and user share of open source software is too small in the market solution with price pN.
3
Piracy
3.1 No network externalities
Piracy is added to the model by allowing users to obtain a free-of-charge version of W. Despite W being available for free, there may be reasons for users rather to purchase
W legally. First, a pirated version may have some degree of quality degradation. This may for instance be due to lack of customer support or incompatibility with patches.14 Second, users may face constraints, for both technical and ethical reasons, of obtaining illegal copies of a piece of software. Moreover, such non-monetary costs may vary between individuals.
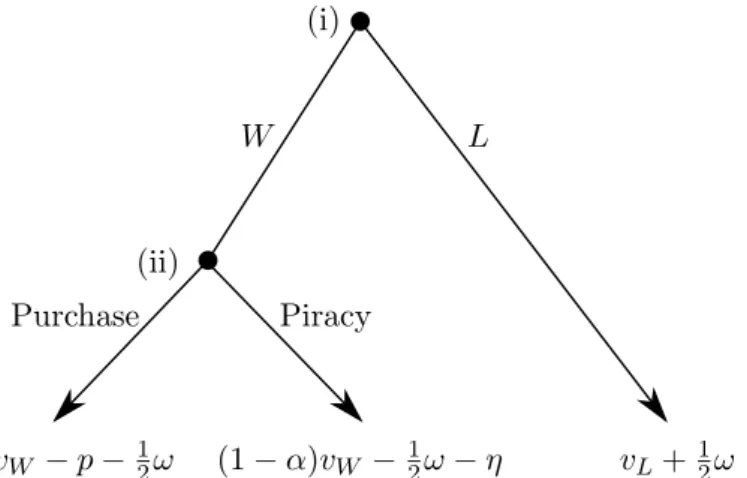
The timing of the choices of the new users is illustrated in Figure 4 and is as follows: (i) Users choose between joining the W network and joining the L network. (ii) Users in the W network choose whether to obtain a pirated or a legal version. In addition it is assumed that new users are unaware of their personal costs of obtaining pirated software before choosing network in stage (i). Instead, they will make their choices based on the expected value of choosing a software type at given price.15 Not being aware of one’s personal cost of copying is a fairly strong assumption, but can be partly justified with regard to swift changes in technology and legislation in this specific area. Since consumers not necessarily are updated on how to by-pass the latest type of copy protection, or what the consequences are of violating IP laws according to the latest legislation,16 the information of one’s personal cost-of-copying may be revealed only after one has decided to obtain a proprietary software product.
Legal and illegal versions ofW differ for new users in two ways: The pirated version is degraded in quality by a parameter α ∈ [0,1], where α = 0 means that there is no difference in quality between legal and illegal copies, andα = 1 means that the pirated version is of no value. Also, new users differ by the personal cost,η, of obtaining pirated copies which is uniformly distributed over the interval [0, z]. This parameter is meant to capture the above mentioned observation that individuals differ in their technical abilities and ethical constraints in obtaining pirated software.
Demand functions are found by solving the model backwards. Given that a user has chosen to join the W network, her value of η is revealed. A new user will choose to
14
A patch is a software update designed to fix bugs and security vulnerabilities.
15
Solving the model with full initial information on personal ”cost of copying” is feasible, but will in addition to the distributions ofωandη, depend on the distribution ofω+ηwhich greatly complicates model since this distribution generally will not be continuous over the area of interest.
16When obtaining a pirated software product, one will typically get a version where the copy protection
already is ”cracked” by a third party. However some effort is typically required by the end-user in order for the cracked version to function. Such efforts may involve, e.g., replacing certain files in the installed directory, and methods to mimic online activation of the product.
vW −p−12ω (1−α)vW −12ω−η vL+12ω
W L
Purchase Piracy (i)
(ii)
Figure 4: Pay-offs for choice of software product.
purchase rather than pirate whenever the payoff is higher for purchasing:
vW −p≥(1−α)vW −η.
Otherwise, piracy is chosen. From the uniform distribution of η it is straightforward to calculate the share (or probability) of new users purchasingW:
Pr(buy) =φ(p) = min{1−p−αvW
z ,1}. (11)
Hence, the piracy rate among new users of W, i.e. the share who do not purchase is: Pr(pirate) = 1−φ(p) = max{p−αvW
z ,0} (12)
Intuitively, the piracy rate increases in the purchase price. Moreover, z is a measure of the price-sensitivity of the piracy rate: A unit increase in the puchasing price will increase the piracy rate by 1/z percentage points whenever p > αvW.
By backward induction, a new user will join the W network if the expected value of choosingW is larger than the value of downloadingL. In the first stage a new user will either purchase or pirate W rather than downloadingL whenever:
φ(p)[vW −p] + (1−φ(p))[(1−α)vW −(p−αvW)/2]−vL≥ω,
where φ(p) and 1−φ(p) are given in (11) and (12), and (p−αvW)/2 is the expected
value of η conditional on being a pirate.17 This implies that a new user will download
17E[η|η≤p−αv
W] =
p−αvW 2 .
L when the opposite is true, i.e.
φ(p)[vW −p] + (1−φ(p))[(1−α)vW −(p−αvW)/2]−vL< ω.
The demand functions for the two software products among new users, independent on pirating or purchasing, are found by integrating over all consumers who satisfy the above inequalities.18 ˜ W0new(p) =σ h1 2+ φ(p)[vW −p] + (1−φ(p))[(1−α)vW −(p−αvW)/2]−vL t i (13) ˜ Lnew0 (p) =σ h1 2− φ(p)[vW −p] + (1−φ(p))[(1−α)vW −(p−αvW)/2]−vL t i (14) From (13) and (14), and their equivalents in (1) and (2), the following result is of interest:
Proposition 1. At a given price, total demand for W is larger with piracy than without piracy. Equivalently, total demand for L is smaller with piracy than without piracy:
˜
W0new(p)> W0new(p) andL˜new0 (p)< Lnew0 (p) if φ(p)<1.
Proof. The inequalities ˜W0new(p)> W0new(p) and ˜Lnew0 (p)< Lnew0 (p) is equivalent to: 1 2[p(1 +φ(p)) +αvW(1−φ(p))]< p ⇔ −(p−αvW) 2 2z <0 ⇔p > αvW.
This is also the condition for a positive piracy rate, i.e.φ(p)<1.
The demand function for purchased (pirated) versions of W among new users is the probability of both being a W user and a legal user (pirate). Hence, by rearranging (13) and multiplying with the probabilities of purchasing and pirating, respectively, the demand functions turn out to be:
˜ Wbuy,new0(p) =φ(p)σh1 2 + vW −12[p(1 +φ(p)) +αvW(1−φ(p))]−vL t i (15) 18
A diacritical tilde is included on relevant functions and results to distinguish the piracy case from the no-piracy benchmark.
˜ Wpiracy,new 0(p) = (1−φ(p))σh1 2 + vW −12[p(1 +φ(p)) +αvW(1−φ(p))]−vL t i . (16) The profit maximizing price for the developer ofW is then:
˜
p0 = arg maxpWbuy,new0(p)p. (17) Hence, ˜p0 = p∗ is determined by the first order condition of the above maximization problem:
˜
Wbuy,new0(p∗) +p∗[φ0(p∗) ˜W0new(p∗) +φ(p∗)∂W˜
new
0 (p)
∂p ] = 0. (18)
Here, ˜W0new(p) is given by equation (13). From equation (18), it can be seen that the negative output effect from a marginal price increase can be broken down into two parts:
φ(p)(∂W˜0new(p)/∂p) is the decrease in demand for purchasedW in favor of downloading
L, while φ0(p) ˜W0new(p) represents the loss in revenue from an increase in the piracy rate.19
Proposition 2. The price with piracy can be both higher and lower than without piracy, i.e., both p˜0 > p0 and p˜0 ≤p0 is feasible.
Proof. Appendix.
It is not difficult to find instances where the price with piracy, ˜p0, is lower than the price without, p0. The opposite case is true only for a small subset of parameters, which is proven in the appendix. Nevertheless, the result may seem like a paradox as one would normally expect the competitive pressure from software piracy to always lead to a price reduction. ˜p0 exceeding p0 can only be true if the degree of degradation of illegal copies, α, is close to or equals zero, i.e. that legal and illegal copies are more or less perfect substitutes. For α = 0, the expected cost of obtaining any copy of W is
p(1 +φ(p))/2< p forφ(p)<1. Thus setting an ex-post price ˜p0 slightly abovep0 may be optimal, since the ex-ante cost ofW may still be below p0. Note, however, that the mark-up abovep0, ( ˜p0−p0)/p0, will be small,20 and it can hardly be argued that ˜p0>p˜ is a likely outcome within the model setup. Nonetheless, the result gives a rationale for why ˜p0 may not necessarily be monotonically increasing in α.
19The solution to (18) is the only non-complex solution of a cubic equation, and is omitted. 20From numerical computations I did not encounter a markup exceeding 2%.
Another observation of the optimal price with piracy, which turns out to be of im-portance when (re-)extending the model to include network externalities, is summarized by the following proposition:
Proposition 3. The price will eventually seize to increase in the degree of differentia-tion:
dp˜0
dt >0, tlim→∞
dp˜0
dt = 0.
Proof. Write the first-order condition for profit maximization as: [φ(p∗) +p∗φ0(p∗)]f(p∗, t) +p∗φ(p∗)fp0(p∗, t) = 0,
wheref(p∗, t) = 1 2+
vW −12[p(1 +φ(p)) +αvW(1−φ(p))]−vL t
By applying implicit differentiation w.r.t. p∗ and t, the following expression is found:
dp∗ dt =
−[φ(p∗) +p∗φ0(p∗)]ft0+p∗φ(p∗)fpt00
2φ0(p∗)f + 2[φ(p∗) +p∗φ0(p∗)]f0
p+p∗φ(p∗)fpp00
It is easy to check that limt→∞ft0(p∗, t) = 0,limt→∞fp0(p∗, t) = 0,limt→∞fpp00(p∗, t) =
0, fpt00(p∗, t) = 0 and limt→∞f(p∗, t) = 1/2. Hence, lim t→∞ dp∗ dt = 0 φ0(p∗) = 0.
The intuition behind Proposition 3 is as follows: As t increases, a larger share of the population will have strong preferences for W which leads to an increase in price. On the other hand, as their preferences towards piracy are unchanged, there is a limit to how high the price can be set without the W developer losing all the customers to pirated versions of the product.
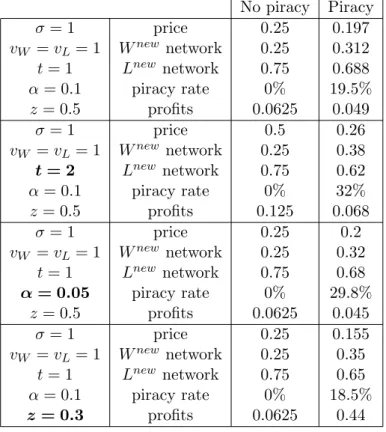
Table 1 provides a few examples on how prices, and therefore other endogenous variables, are affected by changes in parameter values. In all the examples the qualities of the commercial and open source products are equal. The price does increase for an increase in the degree of product differentiationtwhen piracy is present, but at a smaller scale relative to the benchmark case without piracy, which is consistent with proposition 3.
No piracy Piracy σ= 1 price 0.25 0.197 vW =vL= 1 Wnew network 0.25 0.312 t= 1 Lnew network 0.75 0.688 α= 0.1 piracy rate 0% 19.5% z= 0.5 profits 0.0625 0.049 σ= 1 price 0.5 0.26 vW =vL= 1 Wnew network 0.25 0.38 t= 2 Lnew network 0.75 0.62 α= 0.1 piracy rate 0% 32% z= 0.5 profits 0.125 0.068 σ= 1 price 0.25 0.2 vW =vL= 1 Wnew network 0.25 0.32 t= 1 Lnew network 0.75 0.68 α= 0.05 piracy rate 0% 29.8% z= 0.5 profits 0.0625 0.045 σ= 1 price 0.25 0.155 vW =vL= 1 Wnew network 0.25 0.35 t= 1 Lnew network 0.75 0.65 α= 0.1 piracy rate 0% 18.5% z= 0.3 profits 0.0625 0.44
Table 1: Price, network size, piracy rate and profits for various parameter values without net-work externalitites. Values in bold are changes relative to the first row.
Higher degradation in quality of pirated versions, i.e., an increase in α, has an am-biguous effect on the price. On one hand, piracy is now a less valuable option since the competitive pressure from piracy will be weaker, which allows for higher prices. On the other hand, a higher degree of degradation may lower theex-ante value of obtainingW. Hence, for low values ofα the price may decrease inα since the piracy rate initially is non-negligible, and the value of obtaining any version ofW may fall. In a small subset of parameter values the price may even exceedp0whenαis decreasing (from proposition 2). In the numerical examples in table 1 the latter effect dominates which explains why the price increases when the quality of illegal copies is improved.
Lastly, a decrease in z lowers the expected cost of copying resulting in a more price sensitive piracy rate. When individuals are more likely to acquire illegal copies at a given price, the seller of W responds by cutting the price, which ultimately leads to a larger W network and a smaller L network. However, due to the result in Proposition
2 there may exist a small interval wherepis decreasing inz by a small amount for very low values of α.
3.2 Network externalities
In the model with both piracy and network externalities, the seller of the commercial software product will now have the option to impose such strategic pricing. However, as a pirated version of W may exist, pirates will contribute to the network size of W
and thus alter the incentives for network strategic pricing. It turns out that network strategic pricing is more likely to be optimal in the presence of piracy than without it. Piracy increases the total user share of W and, with the exception of a small subset of parameters, decreases the price of legal versions. As a result the price reduction by imposing network strategic pricing is smaller. Hence, the cost of introducing a price where the entire market is captured is reduced, and is more likely to be the optimal strategy.
As before, I assume that users’ expectations on market shares at given prices are based on the hypothetical market shares in the absence of network externalities. More-over, at the profit-maximizing price ˜p0 given by equation (17), it is assumed that pa-rameters are such that ˜W0new(˜p0) +Wold > N and ˜Lnew0 (˜p0) +Lold > N. I.e., for the profit maximizing price ofW in the absence of network externalities, user shares of both software types exceed the critical mass needed to generate demand among new users.
The network strategic price with piracy is equivalent to its counterpart in the no-piracy benchmark. The network strategic price, ˜pN, is the highest price of W in which
demand forLis below the critical mass, i.e., the price is set such that ˜Lnew
0 (pN) +Lold= N. In other words, ˜pN solves:
σ[1 2 −
vW −12[˜pN(1 +φ(˜pN)) +αvW(1−φ(˜pN))]−vL
t ] +Lold=N. (19)
If φ(˜pN) = 1, i.e. ˜pN < αvW, the solution to the above expression is equal to
the network strategic price, pN, in equation (9) from the no-piracy benchmark. For φ(˜pN)<1, i.e. ˜pN > αvW, the solution to the above expression is:
˜ pN =αvW +z− r z h 2t [1 2 − N−Lold σ ] +vL−(1−α)vW +z i .
˜ pN =αvW +z− r zhz−2(pN −αvW) i . (20)
Hence, there is a non-linear relationship between the network strategic prices when piracy is present and in the no-piracy benchmark. From (20) it can be shown that the network strategic price in the no-piracy benchmark can never exceed its equivalent in the presence of piracy.
Proposition 4. The network strategic price with piracy is higher than or equal to the one without piracy: p˜N ≥pN.
Proof. For ˜pN ≤αvW the piracy rate is zero, i.e. φ(˜pN) = 1⇒ L˜new0 (˜pN) =Lnew0 (˜pN),
which in turn implies that ˜pN =pN.
For ˜pN > αvW, the piracy rate will be positive. Solving equation (20) forpN yields
the following expression:
pN = ˜pN−
1
2z(˜pN−αvW)
2, which clearly implies that ˜pN > pN for ˜pN > αvW.
This result can be intuitively explained by the fact that ˜L0(p)≤L0(p), by Proposition 1. By definition,L0(pN) =N, which implies the inequality ˜L0(pN)≤N. Hence, for the
sameN, the price can be increased from pN while still maintaining demand forLbelow
critical mass.
The network strategic price, ˜pN, reacts similarly to changes in parameter values to
its counterpart in the no-piracy benchmark. Obviously, stronger network externalities, interpreted as a larger critical mass N, and a larger installed base ofW users (λ) lead to an increase in ˜pN. The response from increased degree of differentiation, t, depends
on the strength of network externalities, is summarized by the following proposition:
Proposition 5. If N −Lold > σ/2, then p˜N increases convexly in t: dp˜N
dt > 0 and d2p˜N
dt2 >0.
Proof. The proof follows directly by applying implicit differentiation w.r.t.tin equation (19): dp dt = N−Lold σ − 1 2 φ(p) >0 ifN −L old> σ/2, d2p dt2 = N−Lold σ − 1 2 zφ(p)2 dp dt >0 if φ(p)<1 .
p L ¯ p ˜ Lnew0 (¯p) N−Lold ˜ Lnew0 (p, t1) ˜ Lnew0 (p, t2) ˜ pN(t1) ˜ pN(t2)
Figure 5: p˜N increasing intforN−Lold>L˜new0 (˜p),t1> t2. ˜
pN is increasing intfor sufficiently strong network externalities. The intuition behind
this result is that a higher degree of differentiation yields lower demand forLat any price
p >p¯, where ¯p is the price that solves Lnew
0 (¯p) = σ/2. Hence, the price reduction from ˜
p0 that network strategic pricing implies will be lower for large t. Moreover, following the concavity of Lnew0 (p) in p, ∂2p˜N/∂t2 > 0 whenever a solution exists. A graphical
illustration of the relationship between ˜pN and tis provided in Figure 5.
Comparative statics is very different in cases with and without network externalities, when piracy is present. While ˜p0 converges to a constant in t, ˜pN increases convexly in tfor ˜pN <p˜0, which is always true given the assumptions in the model.21
3.2.1 Special case: Limit pricing
Following Bae and Choi (2006) limit pricing with piracy is defined by the price in which no user has incentives to obtain pirated products. From equation (12) it is clear that the piracy rate is zero wheneverp≤αvW.
When the piracy rate is zero, network strategic pricing is given by equation (9), and it can be shown that if
t σ(N−L old) +v W(1−α)−vL− t 2 <0,
then the network strategic price is indeed below the no-piracy limit price. In the
numer-21p˜
ical analysis in section 4, it will be shown that it may be a profit-maximizing strategy to set the price below the no-piracy limit price.
3.3 Welfare
Since the social optimum is unlikely to be achieved, it is more fruitful to compare social welfare under different pricing strategies and for the no-piracy benchmark vs. presence of piracy. When network externalities is not important for the pricing decision user shares will be closer to the social optimum when piracy is present relative to the no-piracy benchmark. On the other hand, there will be an efficiency loss from potential quality degradation and from the cost of obtaining illegal copies. It is unclear whether the increased likelihood of network strategic pricing being imposed is welfare enhancing, since it is not generally clear whether network strategic pricing is welfare enhancing.
3.3.1 No network externalities
Relative to the no-piracy benchmark, the profit maximizing price ˜p0, given by equation (17), has two opposing effects on welfare. From proposition 1 the total user share of
W is larger relative to the no-piracy benchmark. Hence, the location of the consumer indifferent between W (any type) and L, ˜m0, is closer to the social optimum: m0 ≤
˜
m0 < m∗. However, piracy also entails a welfare loss through a possible degradation of quality, α, and the cost of obtaining working illegal copies, η. In relation to the social surplus in the no-piracy benchmark, welfare with piracy and price ˜p0 is:
g W F0 =W F0+ Z m˜0 m0 (vW−vL−ω)dω+(1−φ(˜p0)) hZ m˜0 −t/2 (−αvW− 1 2ω)dω− Z p˜0−αvW 0 ηdηi
Whether welfare increases or decreases relative to the no-piracy benchmark is generally ambiguous and depends on a combination of parameters.
3.3.2 Network externalities
The effects on welfare by going from the price ˜p0 to ˜pN are similar to the no-piracy
benchmark. However, since ˜pN <p˜0, the piracy rate will be lower, meaning the welfare loss from quality degradation and copying cost is reduced.
Taking pricing incentives into account, it is unclear whether the finding that network strategic pricing is more likely to occur in the presence of piracy is good for welfare. However, if network strategic pricing is imposed due to large product differentiation,
welfare is most likely reduced due to the reduction in the value of users located at large
ω.
From simulations with randomly generated parameter values there is no significant correlation between differences in profits under different pricing strategies,π(pN)−π(p0), and differences in welfare,W FN−W F0, in both the case with piracy and in the no-piracy benchmark. This suggests that the incentives for engaging in network strategic pricing does not have a clear effect on total welfare. By only inspecting parameter values where network strategic pricing is imposed with piracy, but not without it, welfare increases relative to the no-piracy benchmark in approximately 61% of a total of 1614 simulated model realizations.
4
Analysis and discussion
This analysis aims at identifying whether network strategic pricing is less or more likely to occur with piracy than without. There are two opposing effects present. Since the total network size of W will be larger and the price lower when piracy is present, the cost from the negative price effect by imposing network strategic pricing is significantly lower due to a smaller price reduction. On the other hand, the positive output effect may also be weaker. By imposing network strategic pricing, the seller of W may not reap all the benefits from zero demand of L, as a sizable share of former L users may obtain a pirated version ofW instead. It turns out that the former effect dominates for all parameter values as network strategic pricing usually involves a price so low that the piracy rate will be low, or even zero.
Although the model developed is intuitively simple, the result depends on combi-nations of parameters. The parameters z and α are parameters that are unique to the piracy model, and the values of these two parameters will obviously be important for the results.
The unconditional expected cost-of-copying isz/2, and intuitively, aszgoes towards infinity, the piracy rate will be zero and we will be back to the no-piracy benchmark. Hence, piracy will only have a substantial effect on the market when zis not too large, ensuring that there will exist a non-negligible share of new users able to obtain an illegal copy at a low cost.
Similarly, the effect from piracy will be small for large α. In fact, the piracy rate may be zero for quite high prices if illegal copies have much lower quality than original
.27 .275 .28 .285 .29 .02 .03 .04 N Profits No piracy π(pN) π(p0) .27 .275 .28 .285 .29 .02 .03 .04 N Profits Piracy ˜ π(˜pN) ˜ π(˜p0)
Figure 6: Network strategic pricing optimal for lower values ofN in the presence of piracy. Parameters: σ= 0.5, z= 0.5, v=t=λ= 1, α= 0.1
versions. Hence, a combination of little quality degradation and a large share of users able to copy at a low cost will make piracy a viable option and thus significantly affect pricing incentives for the commercial software developer in competition against both piracy and open source software.
For the numerical analysis, I will assume throughout that the network independent quality of the two products is equal: vW = vL = v. Although there in reality may be
large quality differences in favor of one type, there is in general little evidence that one software type is more superior than the other.22 In addition, it is assumed that λ= 1, i.e. that open source software is interpreted as an entrant in a market. Although network strategic pricing may be feasible for a non-negligible positive share of old L users, it is unlikely to be an optimal strategy unless the critical mass N is very large. The size of the new and old user population are set to be of equal size: σ = 1/2.
Figure 6 compares profits under the two pricing strategies in the cases with and without piracy for different values ofN. The solid lines represent profits under network strategic pricing, while profits under the price p0 where demand for L is above critical mass among new users is represented by the dashed lines. As the figure clearly illustrates, network strategic pricing is optimal under a larger set of values of N when piracy is
22
Lerner and Schankerman (2010), p.5 write: ”Based on the studies completed to date, it is hard to draw unambiguous conclusions as to the superiority of open source versus proprietary software.”
present. If the critical mass is interpreted as the strength of network externalities, this means that network strategic pricing will be optimal for weaker degrees of network externalitites in the presence of piracy relative to the benchmark case.
Note that the piracy rate is zero under network strategic pricing for all values of N
in Figure 6. This means that it is a profit-maximizing strategy to set a price below the no-piracy limit price. The reason for this is that, even at the limit price p = αvW, we
have L0(p)> N, and profits can be increased further by setting somepN < αvW which
pulls demand forL below the critical mass.
If the share of new users willing to obtain pirated copies falls, i.e., an increase in z, or the quality of pirated products is decreased, i.e. α increases, then the critical value ofN for network strategic pricing to be optimal will rise, and this critical value will for large values ofzand α be equal to that of the no-piracy benchmark.23 That is, the two profit lines in the bottom panel of figure 6 will never cross at a larger N than what is the case for the no-piracy benchmark in the top panel. Hence, forany set of parameters it cannot be the case that network strategic pricing is optimal in the absence of piracy, while not being optimal when piracy is present.
Conjecture. Consider parameter values such that total network sizes exceed the critical mass whenever network strategic pricing is not imposed: W0(p0), W0(ppiracy0 ), L0(p0),
L0(ppiracy0 ) > N. Then there does not exist a set of parameters such that the network
strategic pricing is optimal in the absence of piracy while not being optimal in the presence of piracy: π(pN)> π(p0) andπ˜(˜pN)<π˜(˜p0) is not feasible.
The above conjecture is not formally proven, but is supported by numerical simu-lations. By repeated draws of random parameter values from large variance uniform distributions no observations found the inequalities π(pN) > π(p0) and ˜π(˜pN) <π˜(˜p0) to hold for the same values of parameters. On the other hand, for a non-negligible share of the draws the opposite was the case, namely that network strategic pricing was not optimal in the absence of piracy, but optimal in the presence of piracy. From figure 7, a scatter plot of 1297 simulated realizations of the model, it should be noticed that there is not one single observation in the fourth quadrant representing the two inequalities
π(pN)> π(p0) and ˜π(˜pN)<π˜(˜p0). Details are provided in the appendix.
The intuition of this result is quite clear. Except for a very limited set of parameters
p0 will exceed ˜p0,24 and from proposition 5 we know that ˜pN ≥ pN. Hence, the price
23Notice that limz
→∞φ(p∗) = 1 andφ(p∗) = 1 ifp∗< αvW forp∗∈ {pN, p0}. 24
By running simulations restricting parameters such that the inequality ˜p0> p0holds, the hypothesis
−0.8 −0.6 −0.4 −0.2 0 0.2 0.4 0.6 0.8 −0.5 0 0.5 π(pN)−π(p0) ˜ π ( ˜ pN ) − ˜ π ( ˜ p0 )
Figure 7: Scatter plot of 1297 simulations. π(pN)> π(p0) and ˜π(˜pN)<π˜(˜p0) does not occur
for the same parameter values.
reduction by imposing network strategic pricing, ˜p0−p˜N, is reduced, which increases
the likelihood of ˜pN being the profit maximizing price. In addition, other than making
the open source competitor worthless, the price pN will also have a positive effect on
sales through a lower piracy rate, which further incentivizes the commercial software developer to impose network strategic pricing.
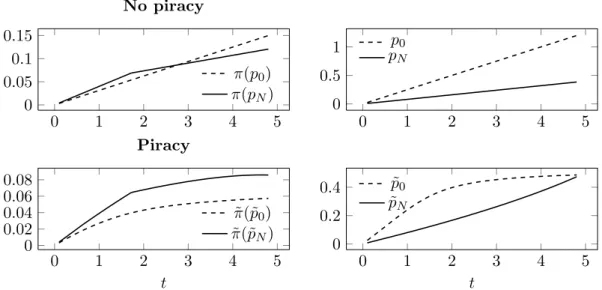
The importance of the size of the degree of differentiation between W and L, mea-sured by the parameter t, was discussed in section 3. Figure 8 illustrates how the size of tmatters numerically. As t becomes large, a larger share of the new users will value
W (and L) highly, meaning that the commercial developer can set a high price of the commercial software product when piracy is not present. Hence, the cost of imposing network strategic pricing will be high, as the price differential between p0 and pN will
be large. Therefore, in the absence of piracy, setting the price at p0 is likely to be the profit maximizing strategy for large t.
However, if an illegal copy of W is available, the commercial developer is limited in the price-setting. For a given z, there is a limit to how high the price can be set, without the firm losing all the customers to piracy. For the numerical example in the bottom panel of Figure 8, p0 seizes to increase as t becomes large. On the other hand, the network strategic price pN grows convexly in t forpN < p0, meaning that the cost of imposing network strategic pricing will be very low due to the small price differential between the two pricing strategies. Hence, p0 is likely to be the optimal price for large
0 1 2 3 4 5 0 0.05 0.1 0.15 No piracy π(p0) π(pN) 0 1 2 3 4 5 0 0.5 1 p0 pN 0 1 2 3 4 5 0 0.02 0.04 0.06 0.08 t Piracy ˜ π(˜p0) ˜ π(˜pN) 0 1 2 3 4 5 0 0.2 0.4 t ˜ p0 ˜ pN
Figure 8: Network strategic pricing not optimal for large degree of differentiation in no-piracy benchmark, but optimal in the presence of piracy
Parameters: σ= 0.5, v=λ=z= 1, α= 0.05, N= 0.29.
5
Empirical evidence
The model predicts that piracy will lead to lower usage of open source software even when network externalities are not present. This is for two reasons: First, when software products are substitutes, the availability of free (or very cheap) copies of commercial software should reduce demand for open source software, as some individuals may choose piracy over open source software. Second, when commercial software developers compete against illegal copies of their own products, they are likely to reduce the price of the legal versions. Lower prices of commercial software will then increase demand for legal copies of commercial software partly at the expense of open source software.
In order to test the effect from piracy on open source software usage empirically, I have obtained data from 104 countries on desktop Linux operating system (OS) user shares in 2011 from the web analytics company Net Applications, as well as estimated piracy rates from the 2011 BSA Global Piracy Study. In addition, GDP data from IMF, and indexes on institutions and infrastructure from the 2012 Global Information Technology Report by the World Economic Forum are used as controls. Descriptive statistics are shown in table 2.
The average national Linux user share in the data set is approximately 1%, but with quite large international variations. While Linux user shares exceed 3% in Finland,
Table 2: Descriptive statistics
Variable Mean Std. Dev. Min. Max. N
Linux share 0.01 0.008 0.001 0.042 104
Piracy rate 0.579 0.214 0.19 0.92 104
GDP/cap (PPP) 20721.194 17900.546 487.237 102943.438 104 Internet bandwidth, kb/s 42.92 88.613 0.111 776.625 104 IP protection (1-7) (IV) 3.897 1.181 1.696 6.25 104
France and Czech Republic, most Middle Eastern countries have Linux users shares below 0.2%. Estimated software piracy rates correlate strongly with per capita income. The United States, Luxembourg and Japan all have estimated piracy rates at around 20%, while in e.g. the Caucasian countries around 90% of all software used is estimated to be illegal copies.
I estimate the following empirical model:
Linuxusersharei =α+βpiracyratei+xiγ+ui (21)
Linux user shares and piracy rates are both measured in logs. Henceβ, the parameter of interest, is interpreted as the elasticity of Linux user share with respect to piracy rate. xiis a vector of control variables such as GDP per capita, regional dummies, and internet
bandwidth. Internet bandwidth is included as a control since some developing countries suffer from extremely slow internet connections. The primary source of obtaining the Linux installation image is downloading online. Hence obtaining Linux might be costly relative to obtaining an illegal physical copy of Windows. Lack of a functioning internet connection might also be an informational barrier to learning of the existence of software products.
Results from OLS regressions are presented in Table 3. The estimates for β are neg-ative and significant, which supports the hypothesis that software piracy has a negneg-ative impact on open source usage. The OLS estimates predict that a 1% increase in the piracy rate in a given country on average will result in a reduction in Linux user shares in the area of 0.5-0.6%, depending on the model specification.25
All the controls have the expected signs. The negative effect from per capita in-come on Linux usage reflects that the price of Windows relative to inin-come is higher
25
Note that both piracy rates and Linux user shares both are measured in percentages. As an example, for a country with a piracy rate of 50% and a Linux share of 1%, an increase in the piracy rate by 1%, i.e. 0.5 percentage points, is expected to have the Linux user share reduced by 0.005 percentage points assumingE(β) = 0.5
Table 3: OLS regressions. Dependent variable: ln(Linux share) (1) (2) (3) (4) ln(piracy rate) -0.620∗∗∗ -0.650∗∗∗ -0.481∗∗ -0.627∗∗ (0.202) (0.198) (0.235) (0.261) ln(GDP/cap (PPP)) -0.344∗∗∗ -0.296∗∗∗ -0.420∗∗∗ -0.150 (0.111) (0.0975) (0.135) (0.125) ln(internet bandwidth) 0.0587 0.282∗∗∗ (0.0555) (0.0717) Asia Pacific -0.791∗∗∗ -0.820∗∗∗ (0.141) (0.148) Mid. East and Africa -1.055∗∗∗ -1.127∗∗∗
(0.176) (0.159)
Constant -1.762∗ -2.053∗∗ -1.954∗ -3.845∗∗∗ (0.921) (0.850) (1.111) (1.053)
Observations 104 104 104 104
AdjustedR2 0.412 0.414 0.154 0.036
Robust standard errors in parentheses
∗
p <0.1,∗∗ p <0.05,∗∗∗p <0.01
in developing economies, and poorer individuals are therefore more inclined to demand free-of-charge substitutes of expensive software. As expected, higher internet speed will on average lead to higher Linux usage. However, the estimate is only significant when regional dummies are not controlled for.
It cannot be ruled out that the demand for pirated Windows copies depends on usage of Linux, meaning that the piracy rate might be correlated with the error term in the empirical model. If more people use open source software, this might also lead less people to obtain pirated software. Using an index of intellectual property (IP) protection as an instrument for the piracy rate, I find results very similar to the OLS estimates in table 3. Since usage of pirated software is an illegal activity, it can be argued that the degree of IP protection will have a negative impact on the extent of piracy. Likewise, since there hardly are any (enforceable) legal restrictions on the use of Linux,26 it is unlikely that the degree of IP protection directly affects demand for Linux.27 Nevertheless, the
26As described in the introduction, open source licenses may e.g. have restrictions on license type of
modified open source products.
27An objection to this argument may be that countries with high IP protection also are countries likely
to have a large ICT sector. Since Linux is more widely used in the ICT sector, IP protection may no be a valid instrument if is correlates with Linux usage.
Hausman (1978) test supports the null hypothesis that the OLS estimates are consistent. The analysis using IP protection as instrumental variable is available in the appendix.
These results are consistent with the findings of the brief empirical analysis conducted by Casadesus-Masanell and Ghemawat (2006). By using data on shipments of server operating systems in 45 countries they find that a country’s piracy rate has a negative effect on the Linux/Windows shipment ratio (significant at the 10% level) controlled for per capita income. While they estimate the expected negative effect, their data is problematic. Considering that any Linux OS is free of charge and can easily be downloaded online, shipments of Linux OSs is likely to be an inaccurate proxy of actual Linux usage. Also, using a ratio between two OSs as a dependent variable may be sensitive to variations of third types of software products, such as Apple’s OS-X in the case of operating systems. By using the same empirical strategy as Casadesus-Masanell and Ghemawat (2006) with the data from the above analysis, I estimate a negative coefficient significant at the 5% level, consistent with their findings.
For the sake of comparison I conducted a similar analysis on the relationship between software piracy and usage of Apple’s OS-X across countries. Since OS-X is bundled with hardware (Macbook and iMac), high-quality pirated copies of Apple computers are hard to come by at a low price.28 Therefore, Apple is not plagued by piracy of their operating systems to the same degree as software developers like Microsoft who primarily sell software on third-party hardware. For this reason, one would expect that a high software piracy rate in a given country would have a negative impact on usage of OS-X. The OLS regression estimates that a 1% increase in the piracy rate would on average lead to a decrease by around 0.95% in the OS-X user share (regression table not included). The effect from piracy on OS-X being greater than what was estimated for Linux may be explained by OS-X being more mature than Linux with regards to installed base and therefore being endowed with a larger portfolio of compatible applications. With regards to the interpretation of network externalities in the theoretical model in this paper, few individuals consider Linux to be above critical mass, and will therefore not wish to obtain Linux for free, even if obtaining illegal copies of Windows is costly. However, the opportunity cost of purchasing an Apple computer is significantly lower when pirating Windows is out of the question.
28
Original hardware products are often built by expensive components, and illegal replicas tend to be made from inferior components to save costs. Moreover, proprietary components such as the motherboard are close to impossible to perfectly replicate by outsiders.