Please
let us know
how this has helped you. Thanks!
Title ARBITER+: Adaptive Rate-Based InTElligent HTTP StReaming
Algorithm for Mobile Networks
Author(s) Zahran, Ahmed H.; Raca, Darijo; Sreenan, Cormac J. Publication date 2018
Original citation Zahran, A. H., Raca, D. and Sreenan, C. J. (2018) 'ARBITER+: Adaptive Rate-Based InTElligent HTTP StReaming Algorithm for Mobile Networks', IEEE Transactions on Mobile Computing, 17(12), pp. 2716-2728. doi:10.1109/TMC.2018.2825384
Type of publication Article (peer-reviewed) Link to publisher's
version https://ieeexplore.ieee.org/document/8334618/http://dx.doi.org/10.1109/TMC.2018.2825384
Access to the full text of the published version may require a subscription.
Rights © 2018 IEEE. Personal use of this material is permitted. Permission from IEEE must be obtained for all other uses, in any current or future media, including reprinting/republishing this material for advertising or promotional purposes, creating new collective works, for resale or redistribution to servers or lists, or reuse of any copyrighted component of this work in other works.
Item downloaded
from http://hdl.handle.net/10468/5866
ARBITER+: Adaptive Rate-Based InTElligent
HTTP StReaming Algorithm for Mobile Networks
Ahmed H. Zahran
1,2,
Member, IEEE
, Darijo Raca
1,
Student Member, IEEE
, and Cormac J.
Sreenan
1Member, IEEE
1
Dept. of Computer Science, University College Cork, Ireland
2EECE Dept., Faculty of Engineering, Cairo University, Egypt
Abstract—Dynamic adaptive streaming over HTTP (DASH) is widely adopted for video transport by major content providers. However, the inherent high variability in both encoded video and network rates represents a key challenge for designing efficient adaptation algorithms. Accommodating such variability in the adaptation logic design is essential for achieving a high user qual-ity of Experience (QoE). In this paper, we present ARBITER+ as a novel adaptation algorithm for DASH. ARBITER+ integrates different components that are designed to ensure a high video QoE while accommodating inherent system variabilities. These components include a tunable adaptive target rate estimator, hybrid throughput sampling, controlled switching, and short-term actual video rate tracking. We extensively evaluate the streaming performance using real video and cellular network traces. We show that ARBITER+ components work in harmony to balance temporal and visual QoE aspects. Additionally, we show that ARBITER+ enjoys a noticeable QoE margin in comparison to state-of-the-art adaptation approaches in various operating conditions. Furthermore, we show that ARBITER+ also achieves the best application-level fairness when a group of mobile video clients shares a cellular base station.
Index Terms—Adaptive video streaming, DASH, wireless net-works, throughput sampling, throughput estimation, fairness, Quality of Experience (QoE).
I. INTRODUCTION
Video is dominating the data traffic in both wired and wireless networks. Specifically, mobile video is growing at unprecedented rates and is expected to take over 75% of mobile traffic by 20201. This increase is fueled by the
per-vasiveness of smart mobile devices and the popularity of Dynamic Adaptive Streaming over HTTP (DASH) model. DASH is widely adopted by major content provider due to its ability to traverse firewalls and the abundance of required infrastructure. Additionally, its inherent adaptation component enables adjusting the video quality to the highly variable oper-ating conditions to achieve the best user quality of experience (QoE). Furthermore, this adaptation logic is implemented at the client leading to a scalable distributed architecture.
In DASH systems, the video is split into multiple small du-ration videosegments.Each segment is encoded into different representations with distinct features, such as resolution and quality. The DASH streaming client implements an adaptation algorithm that can change the segment quality in response to the changes in the operating conditions. The state-of-the-art
1CISCO Visual Networking Index. http://goo.gl/jFB2L7. Last accessed Dec
8, 2016.
adaptive streaming algorithms can be generally classified as buffer-based, rate-based, and hybrid strategies. Buffer-based strategies, e.g., [1], select the video quality by mapping the application buffer level. Rate-based algorithms, e.g. [2], usually bound the selected rate to an estimate for the average network throughput. Hybrid streaming algorithms, e.g., [3], are more complex strategies that integrate application and network conditions using advanced techniques, such as control theory [4], optimization models [3], [5], [6], and probabilistic strategies [6], [7].
The adaptation strategy has a significant impact on the per-ceived user QoE. Ideally, users expect to watch a high-quality, uninterrupted video stream. However, it is not uncommon that users encounter different streaming issues, such as video stalls and low video quality. In a recent study by Conviva2, it is shown that streaming issues are perceived differently by the users. While 60% of the users identified video stalls as the most irritating factor while streaming, 23% identified image quality as their main irritation. The former group may be classified as stall-sensitive users while the latter can be classified as quality-oriented users. This diversity in quality perception motivates the development of tunable streaming algorithms that can be adjusted to match the user QoE profile. The design of adaptive streaming algorithms for mobile en-vironments should overcome inherent system high variability in both link conditions and traffic characteristics. The need for such intelligent algorithms evolves with the increasing reliance on portable devices for performing everyday activities, including watching videos. Mobile environments feature a high level of variability due to channel characteristics, mobility, and the shared nature of wireless medium. Hence, users encounter frequent and abrupt changes in the network throughput that can significantly degrade the streaming quality. Additionally, the variable bit rate nature of compressed video represents another overlooked [8] challenge in the design of quality adaptation algorithms. Hence, developing novel streaming algorithms that accommodate the high variability in mobile systems evolves as a crucial requirement to improve the QoE.
In this paper, we propose ARBITER+ as a novel QoE-driven hybrid adaptation algorithm for DASH clients. ARBITER+ employs different design components to combat temporal and visual QoE degradations. These components include
0 500 1000 1500 2000 2500 3000 3500 4000 4500 5000 0 100 200 300 400 500 600 700 Network Throughput (Kbps) Time (Sec) Trace
Figure 1: Example Cellular Traces [10]
• A tunable representation rate bound estimator that can compromise the tradeoff between frequent qual-ity switches and stall events. This rate bound is esti-mated based on both network and application states. The network state is captured using a tunable exponential smoothing while the application state is captured by the buffer-level.
• A novel hybrid throughput sampling, in comparison to the traditional segment-based sampling, to better capture sudden changes in network conditions that are common in mobile networks.
• Actual video rate tracking to reduce the impact of the variable bitrate nature of the compressed video.
• Switching control (SC) that is designed to ensure gradual quality improvement and flicker avoidance.
Using publicly available real video [9] and cellular traces [10], we evaluate the performance of ARBITER+ components illustrating their impact on various streaming objective metrics, such as quality rate, switching frequency, switching level, number of stalls, and stall duration. Additionally, we identify the impact of these components on the user perceived QoE using two models that are based on subjective evaluations. We compare ARBITER+ performance to state-of-the-art al-gorithms using both simulations and real experiments. We show that ARBITER+ maintains a noticeable QoE margin in comparison to other state-of-the-art adaptation strategies, using trace-based cellular network throughput, without impact-ing other key metrics, includimpact-ing device power consumption. Furthermore, we compare the performance of these algorithms when a group of video clients shares an LTE eNodeB. Our evaluation illustrates that ARBITER+ not only attain the highest QoE but it also achieves the best score for application-level fairness [2].
The rest of this paper is organized as follows. ARBITER+ detailed design is presented in Section II followed by the performance evaluation in Section III. We then present the related work in Section IV before concluding in Section V.
II. ARBITER+ DESIGN
ARBITER+ is designed to improve the user QoE by striking a balance between visual and temporal quality aspects in highly variable mobile environments. Figure 1 plots the measured network throughput versus time in 3G systems
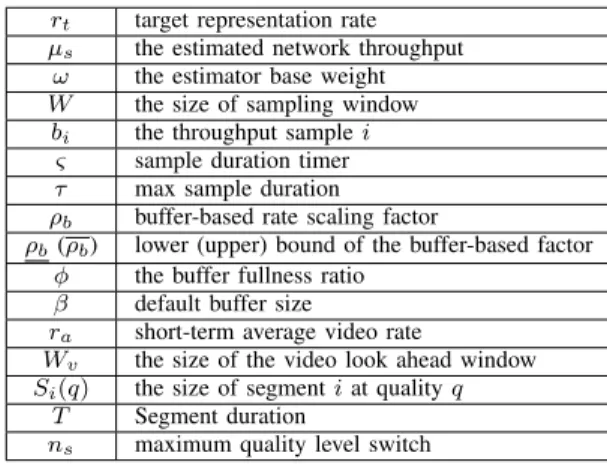
Figure 2: ARBITER+ operation Table I: ARBITER+ notation and parameters
rt target representation rate
µs the estimated network throughput
ω the estimator base weight W the size of sampling window bi the throughput samplei
ς sample duration timer τ max sample duration ρb buffer-based rate scaling factor
ρb(ρb) lower (upper) bound of the buffer-based factor
φ the buffer fullness ratio β default buffer size
ra short-term average video rate
Wv the size of the video look ahead window
Si(q) the size of segmentiat qualityq
T Segment duration
ns maximum quality level switch
showing both frequent short-term gradual and sudden large throughput variations. Accommodating these changes, while ensuring a good QoE, is challenging. ARBITER+ design includes two elements, namely a target rate estimator and a quality selection policy. The estimated target rate represents an upper bound on the selected representation quality rate, which is determined by the quality policy. Both components are designed to accommodate the inherent highly variable nature of both network conditions and compressed video. Additionally, their design integrates multiple components that are designed to improve the user QoE.
Figure 2 illustrates the operation of ARBITER+. Addition-ally, Table I summarizes the notation of ARBITER+ parame-ters.
A. Target Rate Estimation
The design of target rate estimation intelligently determines a quality rate bound to stream high video quality and avoid stalls by considering both application and network states. The target rate estimation is a two-step process. First, an estimate for the network throughput is determined based on historical throughput samples. Second, this estimate is scaled by an application-based scaling factor that may increase or decrease the estimated network throughput. Hence, ARBITER+ target rate estimation captures both network and application states in the quality selection. The network state is captured by a network throughput that is determined using a tunable estimator based on an exponentially weighted smoothing. In comparison to common moving average or harmonic mean estimators [11], [2], [3], the exponential estimator involves a memory factor as more recent samples are assigned higher weights. Hence, the exponential estimator not only averages out throughput variations but also improves the response to gradual and sudden throughput changes. The application-aware rate scaling enables ARBITER+ to balance visual and temporal quality by adjusting the target rate based on the buffer level. We exploit this level to scale up our target rate as the stall risk decreases and provide a conservative target rate estimate at low buffer levels.
In addition to the common practice of sampling the network throughput at video segment boundaries, we propose hybrid sampling that includes a mixture of periodic and common segment-based sampling. We argue that hybrid sampling im-proves the perception of network throughput especially when it gradually or suddenly drops. Hence, the hybrid sampling im-proves ARBITER+ temporal QoE by increasing its sensitivity to deteriorating network conditions.
1) Network Throughput Estimation: ARBITER+ considers an exponentially weighted estimator for the network through-put, denoted as µs. Let ω denotes the base weight of the
exponential estimator, i.e., the weight assigned to the most re-cent throughput sample. Each throughput samples is assigned a weightω(1−ω)i, wherei∈ {0, .., W−1}andW is the size
of the sampling window. These weights are then normalized to their geometric sum and the final weights are expressed as
wi=
ω(1−ω)i
1−(1−ω)W , (1)
The throughput estimate, denoted as µs, is calculated as the
average weighted mean and can be expressed as
µs =
W−1
X
i=0
wibk−i, (2)
wherebirepresents the throughput sampleiandkis the index
of the last recorded sample.
The base weight ω would be a fraction, i.e., ω ∈ (0,1]. Note that ω= 1implies that the throughput estimate is based on the last throughput sample. Additionally,ωcan be tuned to control the behavior of the adaptation strategy. Large values of
ω would promptly react to changes in the network throughput and would be more responsive to changes in the network con-dition. Such responsiveness would improve stall performance,
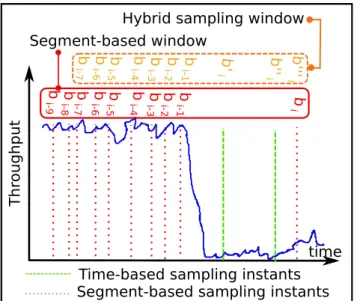
b i T h ro u g h p u t
Time-based sampling instants Segment-based sampling instants
time b i-1 b i-2 b i-4 b i-7 b i-8 b i-6 b i-5 b i-3 b i-9 b ' i b ''' i b '' i b i-1 b i-2 b i-4 b i-7 b i-6 b i-5 b i-3 Segment-based window
Hybrid sampling window
Figure 3: Segment-based sampling versus hybrid sampling
represented by the number of stalls and stall duration, but it may also lead to frequent representation switches. Small
ω values would react to network throughput changes at a slower pace leading to fewer quality representation switches but possibly worse stall performance. Hence, ω can be tuned to compromise the tradeoff between visual and temporal QoE. Additionally, it can be set to match different QoE user profiles, e.g., stall-sensitive vs. quality-oriented users.
a) Hybrid Throughput Sampling: It is common that network throughput changes over time for different reasons, such as network load changes, wireless channel characteristics, and user mobility. These factors may lead to gradual or sudden changes in the network throughput. To illustrate, as a user moves from the cell center towards the cell edge in an LTE system, the channel quality indicator (CQI) changes from the highest to the lowest value, i.e., from 15 to 1. This change is accompanied by a drop in the achievable throughput per resource block group (allocatable resource unit) of such client by 45-folds. Similarly, flash crowd[12]arrival could lead to a noticeable drop in the user service rate. In the latter situation, the base station scheduler redistributes its resources over a large number of users leading to a sudden drop in the network throughput of existing users.
We hypothesize that the common practice of relying on segment-based throughput sampling does not accurately cap-ture these changes, especially sudden throughput changes. To illustrate, consider the scenario shown in Figure 3. In this scenario, a sudden drop in the network throughput oc-curs while the video client is downloading segment i. With segment-based sampling, a new throughput samplebiis added
to the throughput sampling window when the client finishes the segment download. bi is estimated as the downloaded
segment size divided by the segmentidownload time. Hence, the recorded value represents an average for the network throughput before and after the sudden condition change. Consequently, the throughput estimator, using all segment-based throughput samples, would fail to capture the sudden
network throughput drop as the most recent low throughput sample bi would be averaged out in a typical moving average
and may be considered an outlier in a harmonic rate estimator. Hence, the video client may request a high video quality leading to a series of, possibly long, stalls until the estimator converges to the actual network rate.
We propose adopting a hybrid sampling approach that
involves a mixture of time-based and the common segment-based sampling. In hybrid sampling, the application monitors the amount of data delivered from the transport layer to the application. Additionally, it maintains a timer, denoted as ς, that periodically fires when the timer value exceeds a specific period τ. A sample is recorded whenever a segment is completely downloaded or when the timer expires. Every throughput sample is estimated as the amount of delivered data from the transport layer to the application layer divided by ς. Note that the timerς is reset when the segment download starts as well as when a sample is recorded. In the scenario shown in Figure 3, two throughput samples ( b0i, b00i) are triggered by timer expiry and a third throughput sampleb000i is triggered when the download of segmentifinishes. Bothb00i andb000i are close to the actual current network throughput. Hence, hybrid sampling would improve the tractability of the changes in network conditions. Note that these samples would have higher weights with the exponential averaging. Hence, the estimated network throughput would be close to the actual network throughput leading to selecting a proper segment quality that would reduce the stall probability.
Hybrid sampling breaks the unnecessary dependence of network condition monitoring on the segment duration. DASH content providers tend to use large segment duration for wireless systems with typical values ranging 4-10 seconds. Ideally, a segment should be roughly downloaded every seg-ment duration to avoid interruptions. In practice, the segseg-ment download duration varies due to varying network conditions and/or segment sizes. Hence, critical changes in network conditions may be overlooked when segment-based sampling is used. Hybrid sampling aims to avoid such situations through taking more samples when the timer expires. These samples improve the responsiveness to network condition degradations. This improvement would enhance the user temporal QoE by reducing the number of stalls and stall durations for a long-term sudden drop of network throughput and the user visual perception during gradual network throughput degradation by performing smaller prompt quality switches.
2) Buffer-based Rate Scaling: ARBITER+ buffer scaling balances the visual and temporal quality by adjusting the target rate based on the application state, which is captured by the buffer level. A low buffer level increases the stall risk while near full buffer may pause the streaming process. Note that the application stops requesting video segments when the buffer is full and would only resume when it has sufficient buffering space for the next segment. It is reported [13] that ON-OFF behavior may significantly affect the accuracy of throughput estimation when the client goes OFF. Additionally, high buffer levels also indicate that the client requests a video quality lower than what can be supported by the network. Hence, the visual quality could have been improved by requesting a higher
video quality. Hence, ARBITER+ scales up the target rate at high buffer levels to improve the visual quality and scale down the rate to avoid stall risk at low buffer level.
The buffer-based rate scaling factor, denoted as ρb, is a
multi-objective adaptive element in ARBITER+. At low buffer levels, a scaling factor acts as a safety factor that is less than unity to help building up the buffer and reduces stall risks. At high buffer-level, ARBITER+ selects a scaling factor that is larger than one to improve the streaming quality and ensure persistent download. This design is distinct from rate-based strategies in the literature, in which the throughput estimate is commonly scaled down as a safety factor to compensate for estimation errors.
The buffer-based scaling factor, denoted as ρb, increases
linearly as the buffer level increases and is expressed as
ρb=ρb+ (ρb−ρb)φ, (3)
whereρbandρbrespectively represent lower and upper bounds
for ρb andφrepresents the buffer fullness ratio, estimated as
the ratio of buffer level to a default buffer size β. Note that this buffer fullness is referenced to β instead of the buffer size to ensure that ARBITER+ behavior is independent of the buffer size. The values ofρbandρb have a significant impact
on the user visual and temporal QoE. Choosing a small ρb
improves the stall sensitivity but would also lead to streaming a low video quality. On the other hand, selecting a large ρ
may excessively scale up the target rate leading to streaming high video quality that is more prone to stalls. The values of both parameters are experimentally determined to compromise the tradeoff between video quality and stall risk as shown in Section III.
Finally, our target rate estimate, denoted asrt, is calculated
as
rt=µs∗ρb. (4)
This target rate represents an upper bound for the video quality rate according to both application and network states. The design ofrtenables ARBITER+ to converge to the
bene-fits of both rate-based and buffer-based strategies. Network rate estimation enables ARBITER+ to converge the actual network rate and promptly adapt to the changes in network condition. Additionally, the buffer scaling enables ARBITER+ to integrate the application state in a conservative manner when there is a stall risk and otherwise to maximize quality.
B. Quality Selection Policy
ARBITER+ quality selection policy includes components targeting reducing the stall risk due and performing smooth representation switches. First, the actual video actual rate (AR) tracking aims to reduce the impact of variable bit rate nature of compressed video. Additionally, the controlled switching (CS) component is designed to ensure smooth quality switching by employing bounded quality increments and an adaptive quality rate hysteresis. The hysteresis is introduced to ensure that quality increments would be maintained to avoid the adverse negative impact on the visual quality when the adaptation logic reduces the video quality. Hence, ARBITER+ quality selection
policy integrates design components that aim to improve both user temporal and visual QoE.
AR aims to reduce the impact of the variable bit rate nature of compressed video. Typically, encoding information is obtained by the client through the media presentation description (MPD) file that is communicated at the begin-ning of every session. The variations in video bit-rate is another contributor to the system variability [8], [14] and are commonly overlooked by adaptation policies that base their decisions on the advertised average representation rate in the MPD file. These advertised rates represent long-term average values estimated for the entire video. ARBITER+ considers an actual short-term average rate, denoted as ra, estimated
for a window of future segments. Let Qdenotes the number of quality representations. The MPD file provides information such as segment duration and the average encoding rate of every representation, denoted asRq, whereq∈ {1, ..., Q}and
a higher q indicates a better quality. The actual rate for each candidate quality qis calculated as
ra(q) = PWv
i=1Sk+i(q)
Wv∗T
, (5)
where Wv represents the size of the look-ahead window for
future segments and Si(q) represents the size of segment i
at qualityq. Practically,Si(q)can be identified directly from
a byte-range MPD file or using HTTP HEAD messages for URL-based MPD files. Additionally, Wv should neither be
small or large value. A small Wv would be biased by near
future while a large Wv would converge to the long-term
average representation rate.
ARBITER+ initially selects the highest quality representa-tion whose actual rate is upper bounded by rt and then apply
CS criterion that ensures progressive quality improvement and stable switching. This progressive quality improvement is achieved by limiting up-switch tons quality levels in case
of high target rate. Stable switching intends to avoid quality oscillation with close subsequent up and down switches. It is well known that quality oscillation causes image flickering that negatively impacts the user QoE [15].
Noting that visual impairments are more observable at low-quality representations, ARBITER+ employs a monotonically decreasing rate hysteresis as the target quality increases. With CS, ARBITER+ does not perform an up switch from quality (q−1) to quality q unless the target rate rt is higher than
the actual ratera(q)scaled by a quality dependent hysteresis
factor, denoted as h(q). This hysteresis diminishes for high-quality representations among which high-quality switches may not be observed by the user.
The choice of hysteresis margin affects the user perceived QoE. A large hysteresis margin delays quality improvement but would also increase the buffer level as lower quality segments would be downloaded. Note that as the buffer builds up, buffer scaling would boost the target rate and speed quality improvement. Hence, we consider a maximum hysteresis mar-gin of 5-10% a good design choice. Note that DASH encoding guidelines suggest 1.5 as a typical ratio between subsequent representation rates. Additionally, the decreasing rate for the hysteresis should be selected such that the hysteresis margin
diminish as the observable quality rate does. An example hysteresis function is expressed as
h(q) =max(1,1.08−q∗0.015). (6)
This formula represents a linearly decreasing hysteresis start-ing at 5% hysteresis when switchstart-ing from the first to second qualities, i.e., fromq= 1toq= 2. This hysteresis decreases to zero starting from sixth quality representation. Note thath(q)
design should change to match the expected user perception on the used device. For example, quality variations on larger devices could be observed even at higher qualities.
III. PERFORMANCEEVALUATION
In this section, we evaluate the performance of ARBITER+ using ns-33 simulations and testbed experimentation. The
simulations enable us to perform extensive experimentation in a controlled emulated wireless environment for both cel-lular trace-driven and shared network simulation scenarios. Additionally, the real experiments enable us to capture other practical aspects such as battery consumption.
In our experiments, we focus on illustrating the impact of different components of ARBITER+ on the streaming perfor-mance. Additionally, we thoroughly compare the performance of ARBITER+ with the state-of-the-art algorithms in different scenarios. The evaluation setup is described in the following section then our performance results are presented.
A. Evaluation Setup
In our evaluation, we use six five-minute clips from the public iVID DASH dataset [9]4. The video encoding rates are
{235, 375, 560, 750, 1050, 1750, 2350, 3000, 3850, 4300}, which are based on typical values used by content providers. Additionally, iVID dataset provides a range of genres and segment durations. In our evaluation, we considered different segment durations including 4 Sec and 10 Sec. These durations are selected as representatives for typical segment values used in cellular networks. Furthermore, we used videos with different genres including animation, thrill, science fiction, and TV shows.
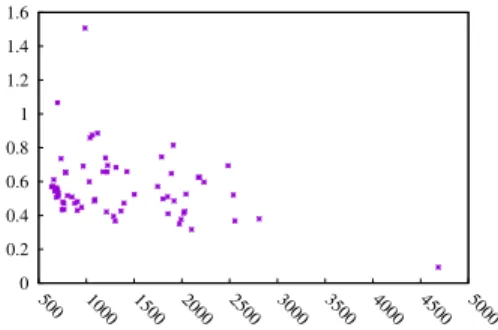
In our trace-driven experiments, the link bandwidth is shaped according to throughput traces for 3G (64 traces) [10]. These traces were collected while riding different modes of transportation (car, metro, train, bus, ferry) in Oslo. Figure plots the coefficient of variation (CoV) versus the mean rate of the first 400 seconds of every trace5. Clearly, the figure
shows that the average rate of the traces varies between a few hundred Kbps up to 3Mbps. Additionally, most of the traces have a CoV between 0.3 and 0.9. There exists one trace that has a steady high rate around 4.5Mbps with little variation. There are also a couple of traces showing relatively high variation in comparison to the remaining traces. Since these traces do not include information about the link delay, we tested different typical end-to-end link delays over 3G
3https://www.nsnam.org/
4https://www.ucc.ie/en/misl/research/current/ivid_dataset/
5400 Sec is selected to sufficiently cover both video duration and
0 0.2 0.4 0.6 0.8 1 1.2 1.4 1.6 500 1000 1500 2000 2500 3000 3500 4000 4500 5000 Trace CoV
Trace Average Rate (Kbps)
Figure 4: Characterization of throughput trace
networks, from [16], including 40ms, 60ms, and 80ms. The performance results show similar performance trends across all tested delays. Hence, we only show results for 40ms link delay.
We conduct our experiments in two different setups. First, we performed trace-driven simulations and experiments in which we consider a video client streaming from a remote server over an emulated 3G link. We also considered another simulation setup in which a group of mobile video clients is sharing an LTE eNodeB.
1) Simulation Setup: In our simulations, the DASH client and server are based on new application modules that we developed for ns-3. The developed simulation DASH client module parses MPD information and implements adaptation logic and buffer operations. The DASH client communicates with the dash server over a single TCP connection over which HTTP messages are exchanged. The client sends HTTP GET messages to request video segments and the DASH server replies back by sending segment files, whose sizes are deter-mined based on a real video dataset [9]. It is recommended that the client buffers more than 6 seconds of media before playing it out [17]. Hence, we consider initial buffering and rebuffering durations equal 8 seconds and 4 seconds, respectively. Note that this duration corresponds to a different number of seg-ments depending on the segment duration. Additionally, the segment download time during these buffering phases is much shorter as low segment quality is usually requested. In all compared algorithms, the lowest segment quality is requested during the initial buffering. The client sends HTTP requests immediately upon receiving the previous video segment unless the buffer is full. In the case of a full buffer, the segment request is delayed until the buffer can accommodate one more segment or according to the adaptation algorithm scheduling policy. In our simulation, we consider a fixed HTTP header size of 100 bytes for both requests and responses.
In addition to ARBITER+, we implemented other adaptation algorithms including ELASTIC [4], BBA2 [1], and MPC [3]. ELASTIC is a hybrid algorithm whose design is based on control theory and implements a harmonic estimator for network throughput. Note that ELASTIC is designed to ensure an application-level fairness in case of sharing a bottleneck. BBA2 represents the class of algorithms that solely depend on buffer-level in its adaptation decision. Note that BBA2 initially include a moving average estimator for the network
Figure 5: Experimental testbed setup
throughput to improve its startup performance but otherwise, the adaptation decisions are mainly based on the buffer-level. MPC is a hybrid algorithm whose decisions are based on maximizing a QoE objective defined as a weighted sum of quality, switching, and stall components. MPC is implemented using Lindo solver6. It is worth noting that the design of both
MPC and ELASTIC include rate estimation using a harmonic mean estimator. Our simulation results represent the average of 384 evaluation scenarios - all combinations of 64 mobility traces and 6 videos.
2) Experimental Setup: We implemented a simple testbed that includes a mobile client (Nexus 6 with Android 7.1.1), a wireless access point and an HTTP server (Ubuntu 16.04 LTS PC with Intel i7 processor and 16GB of RAM), as depicted in Figure 5. Our video traffic is based on the public iVID DASH dataset [9]. The mobile client streams a video from the content server (CS) through the wireless access point (WAP) with wired link capacity between CS and WAP set according to 3G bandwidth traces using tc tool7. We use ExoPlayer8, a Google media library for video streaming on Android. We imple-mented the ARBITER++, ELASTIC, and BBA-2 algorithms, evaluating the device power consumption using one video for 64 traces, comparing also with ExoPlayer’s default adaptive algorithm. Note that MPC is dropped in this experimental study as its optimal solution can not be determined in real-time. We replace it with the default adaptation algorithm that is shipped with Exoplayer. We split our automated evaluation into two rounds, containing 30 and 34 five-minute video sessions. Before each round, we charge the mobile device to 100% battery capacity. We measure the battery level before and after each video session to determine the power consumed per session.
3) Performance Metrics: Our performance metrics per-session include the average received quality rate (rav) in
Kbps, the number of freeze-free sessions (nf f), the number
of stalls (nf), the total stall duration (tf) in seconds, the
number of switches (nsw), the switching level (lsw). The
reported values represent the average of the performance metrics across all clients in every experiment. We also report the unfairness metric [2], denoted asF, for experiments testing the performance of streaming algorithms when video clients share an LTE eNodeB. This metric varies from 0 to 1 with
6http://www.lindo.com/ 7http://lartc.org/manpages/tc.txt 8https://github.com/google/ExoPlayer
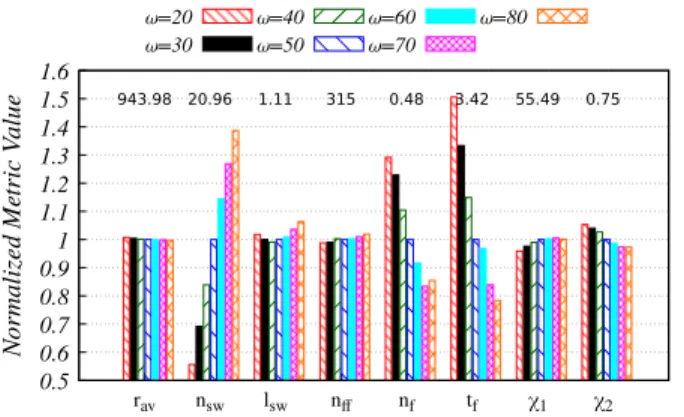
0.5 0.6 0.7 0.8 0.9 1 1.1 1.2 1.3 1.4 1.5 1.6 rav nsw lsw n nf tf 1 2 Nor malized Me tric V alue =20 =30 =40 =50 =60 =70 =80 943.98 20.96 1.11 315 0.48 3.42 55.49 0.75
Figure 6: Experiment 1: Average Performance metrics for Fixed weight strategy (ρ = ρ = 85%). The metrics are normalized to the case with ω= 50%, whose average metrics are shown in figure.
smaller values indicating a friendly application-level attitude of video clients.
We also considered two objective QoE models including [15] and [18] that are denoted χ1 and χ2, respectively. Both
metrics are estimated as a weighted sum for both visual and temporal QoE components by fitting the weights to subjective results. The highestχ1value is 100 and reduces as the level of
impairment increases. Visual impairments include persistence on low-quality video and performing down quality switches that are known to annoy users. On modeling visual impair-ments, χ1 employs visual quality metric (VQM), which has
a high correlation to subjective QoE for single bit-rate video. We calculated VQM values for different segments using VQM software9. Temporal impairments captured byχ
1captures both
initial startup delay and stalls. χ2 aims to calculate the mean
opinion score ranging from 0 to 5. It captures the video quality and quality switching using average and standard deviation of downloaded segment rates normalized to the maximum video representation rate (RQ). Similar toχ1,χ2captures stall
penalty as a function of nf andtf.
B. ARBITER+ Performance
In this section, we illustrate the impact of ARBITER+ components on the streaming performance.
1) Experiment 1: The impact of the base weight: We investigate the impact of the base weight on the performance metrics by varying ω from 20% to 80%. In this experiment, we disabled all other components of target rate estimation and quality selection policy. Hence, we set the buffer scaling to 85% as a fixed estimation safety factor. The quality selection policy is to request the best quality representation whose advertised average rate is lower than the estimated target rate. Figure 6 shows the impact of the base weight ω on the average performance metrics of ARBITER+. Note that the metrics are normalized to the result of ω = 50% to fit different metrics in a single figure. The figure shows that the impact of changing the base weight ω is mainly observed in the switching and stall performance metrics with a minimal
9VQM software: https://goo.gl/RttfPr. Last accessed: Dec 21, 2016.
impact on observed on the average representation rate rav.
The average number of switches nsw increases by 2.5 folds
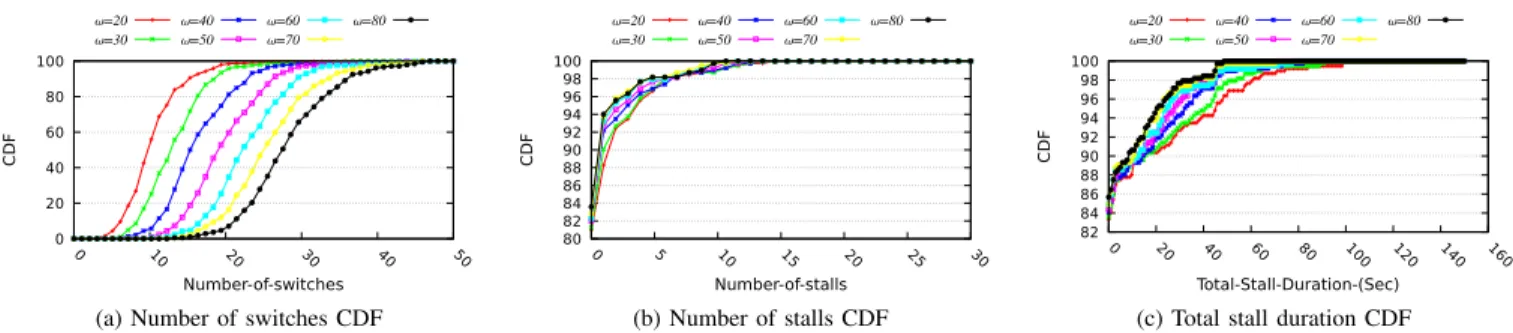
(from 11.7 to 29.1 switches) as the base weight ω changes from 20% to 80%. Figure 7a also plots the CDF of individual session switching behavior. Clearly, this figure assuresnsw is
driven by a change in switching behavior asω increases. Additionally, Figure 6 shows that the average number of stalls per session nf drops by 34% and the average total
stall duration per session tf is approximately halved as ω
changes from 20% to 80%. Clearly, a higher base weight speeds the responsiveness to changes in the network bandwidth at the cost of more frequent switches. Figure 7b and Figure 7c respectively plot the CDF of nf and tf showing a clear
performance gap as ω increases. To illustrate, 94% sessions would have less than one stall withω = 80% in comparison to only 88% withω= 20%. Additionally, Figure 7c shows that 94% session would have tf less than 20 sec with ω = 80%
in comparison to only 90% withω= 20%.
Figure 6 also interestingly shows different trends for the selected QoE metrics asωincreases.χ1increases and reaches
a maximum atω= 70%whileχ2shows a decreasing trend but
it also saturates atω = 70%. This result assures the possible difference in QoE perception of different users. Hence, we considered the product of bothχ1 andχ2 as our criteria for
selecting ARBITER+ base weight. The product suggests that
ω= 30%andω= 40% would lead to the highest product. 2) Experiment 2: The impact of buffer scaling : Next, we explore the impact of buffer scaling component on the
performance metrics for both ω = 30% and ω = 40%. We
tested different combinations of empty buffer scale ρb and
full buffer scale ρb. The selected values range from 75% to
85% for ρb and from 105% to 135% for ρb. Figure 8 plots
the average performance metrics for different combinations of (ω, ρb, ρb) normalized to the case with tuple (30,85,85).
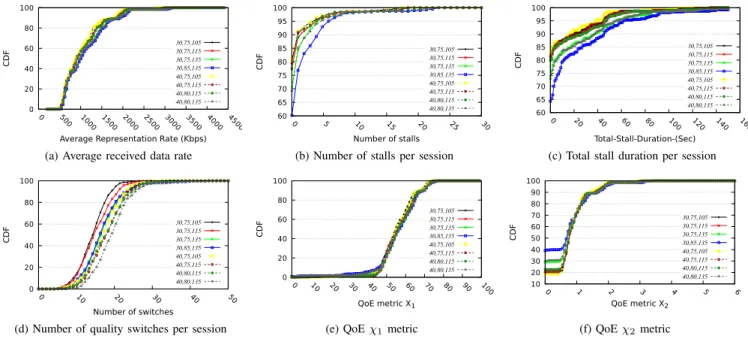
Additionally, Figure 9 plots the CDF of different metrics for the same combinations of (ω, ρb, ρb). Clearly, both figures
shows that changing ρb and ρb has a noticeable impact on
all metrics. While changing the full-buffer and empty-buffer scales has an insignificant impact on the average level of switching, the number of switches changes by up to 15% for the same base weight. We also notice that the number of switches highly depends on the gap between ρb andρb with
the number of switches increases with a larger gap. Changing the buffer scales also leads to approximately 10% difference inrav across the shown buffer scale combinations with both ω= 30%andω= 40%.
Stall performance metrics shows the highest sensitivity to changes in both buffer scaling factors. To illustrate, Figure 8 shows that by increasing ρb from 105% to 135% with ω =
30 and ρb = 75%, both the average number of stalls and
average total stall duration increase by 56% while the number of freeze free session drops by 12.3%. Figure 9b also shows that the number of sessions encountering at most one stall increases from 84% to 91% for the aforementioned parameter combinations. Figures 8 and 9 also shows similar performance degradation as the empty buffer scale ρb increases with ω =
30% andρb= 135%.
0 20 40 60 80 100 0 10 20 30 40 50 CDF Number-of-switches =20 =30 =40 =50 =60 =70 =80
(a) Number of switches CDF
80 82 84 86 88 90 92 94 96 98 100 0 5 10 15 20 25 30 CDF Number-of-stalls =20 =30 =40 =50 =60 =70 =80 (b) Number of stalls CDF 82 84 86 88 90 92 94 96 98 100 0 20 40 60 80 1 00 120 140 160 CDF Total-Stall-Duration-(Sec) =20 =30 =40 =50 =60 =70 =80
(c) Total stall duration CDF
Figure 7: Experiment 1: Switching and stall distribution for fixed weight strategy (ρ=ρ= 0.85)
0.6 0.8 1 1.2 1.4 1.6 1.8 2 2.2 2.4 2.6 rav nsw lsw n nf tf 1 2 Nor malized Me tric V alue 30,75,105 30,75,115 30,75,13530,85,135 40,75,10540,75,115 40,85,11540,85,135 947.84 14.49 1.11 312 0.59 4.56 54.15 0.78
Figure 8: Experiment 2: Impact of buffer scaling factor on the performance. Results are normalized to ARBITER+ with (30,85,85), whose average metrics are shown in figure.
QoE in comparison to the no-scaling case. Both χ1 and χ2
increase by up to 6.2% and 7.7%, respectively, when compared to fixed buffer scaling (30,85,85). While both metrics shows that ρb = 75% leads to the highest QoE metric values, χ1
maintains minor increments in the QoE as ρb increases but χ2shows a higher sensitivity to stall performance degradation
as ρb increases as illustrated in Figure 9f. The configuration
(40,75,115) shows the highest value for the product of both metrics χ1χ2. Hence, we consider this configuration as the
best values for ARBITER+ target rate estimation for 4-second video segments. For longer video segments, the segment down-load time of individual segments increases and hence, the base weightωshould also be boosted. For a 10-second segment, we found that ω = 70% provides the best performance with the same buffer scaling factors; i.e.,ρ= 115%andρ= 75%. This result confirms the importance of recent history propelling using a larger base weight for long segment durations.
3) Experiment 3: The impact of AR, CS, and HS: Next, we explore ARBITER+ components that are designed to improve specific performance metrics. These components include ac-tual video rate (AR), controlled switching (CS), and hybrid sampling (HS). Figure 10 plots the average performance met-rics, normalized to ARBITER(40,75,115), for different com-binations ARBITER+ addons. Each individual addon achieves its intended goal.
ARBITER+AR improved ARBITER+ stall performance by reducing nf by 15% and tf by 13.5% while increasingnf f
by 2.3%. This improvement is accompanied by only 2% drop in rav and 8% increase in nsw. Hence, we consider AR is
a useful component for stall-sensitive video users. SC addon, usingh(q)in 6, improves both switching and stall performance while maintaining the same average quality rate. CS reduces ARBITER+ nsw by 1.5% and lsw by 3%. Additionally, the
integration of CS decreases nf by 4% and tf by 3.5%
and increases nf f by 2.3%. By combining AR and CS,
ARBITER+AR+CS noticeably improves the stall performance of ARBITER+AR by boostingnf f by 4.9% and reducingnf
andtf by 19.5% and 15%, respectively.
We also investigate the impact of hybrid sampling on the streaming performance. We set the timer τ to 12 sec. Note that the actual segment size could be as large as 2.5 the average segment size. Hence, the download time of such large segment, with a perfect throughput estimate, can take up to 2.5 the segment duration. Hence, we set τ to three times the segment duration. The introduction of hybrid sampling to ARBITER+AR+SC further increasesnf fby 1.5% and reduces
both nf and tf by 22.5% and 15%, respectively. Hybrid
sampling improves throughput estimation in different ways. When the throughput suddenly drops, the current segment download may either finish while the user channel is still bad or just after the throughput ramps up again. In the former case, the throughput drop would be captured in two or more time-based samples with low throughput. Hence, the target rate estimator would calculate a low target rate leading to reducing possible stalls or long stall durations. With segment-based sampling, the throughput drop would be only captured in the last sample. Hence, a high throughput estimate, driven by previously recorded segments, may expose the client to encounter stalls or longer stall duration while the network is still in a bad condition. In the latter case, time-based sampling would capture throughput variations in two or more samples with the last one capturing the actual throughput increase. Hence, the throughput estimate would be closer to the actual current network throughput. With segment based sampling, the most recent throughput sample would have a small value that would trigger a low throughput estimate although the throughput is already increasing.
4) Discussion: ARBITER+ integrates multiple components that work in harmony to ensure a high user QoE. The tun-able exponentially weighted throughput estimation can steer the performance between stall sensitive and quality-oriented
0 20 40 60 80 100 0 5 00 1000 1500 2000 2500 3000 3500 4000 4500 CDF
Average Representation Rate (Kbps) 30,75,105 30,75,115 30,75,135 30,85,135 40,75,105 40,75,115 40,80,115 40,80,135
(a) Average received data rate
60 65 70 75 80 85 90 95 100 0 5 10 15 20 25 30 CDF Number of stalls 30,75,105 30,75,115 30,75,135 30,85,135 40,75,105 40,75,115 40,80,115 40,80,135
(b) Number of stalls per session
60 65 70 75 80 85 90 95 100 0 20 40 60 80 1 00 120 140 160 CDF Total-Stall-Duration-(Sec) 30,75,105 30,75,115 30,75,135 30,85,135 40,75,105 40,75,115 40,80,115 40,80,135
(c) Total stall duration per session
0 20 40 60 80 100 0 10 20 30 40 50 CDF Number of switches 30,75,105 30,75,115 30,75,135 30,85,135 40,75,105 40,75,115 40,80,115 40,80,135
(d) Number of quality switches per session
0 20 40 60 80 100 0 10 20 30 40 50 60 70 80 90 1 00 CDF QoE metric X1 30,75,105 30,75,115 30,75,135 30,85,135 40,75,105 40,75,115 40,80,115 40,80,135
(e) QoEχ1metric
10 20 30 40 50 60 70 80 90 100 0 1 2 3 4 5 6 CDF QoE metric X2 30,75,105 30,75,115 30,75,135 30,85,135 40,75,105 40,75,115 40,80,115 40,80,135 (f) QoEχ2metric
Figure 9: Experiment 2: CDF of Performance metrics
0.5 0.6 0.7 0.8 0.9 1 1.1 1.2 rav nsw lsw n nf tf 1 2 Nor malized Me tric V alue ARBITER+AR
ARBITER+CS ARBITER+AR+CS+HSARBITER+AR+CS 1093.89 19.02 1.1 305 0.72 5.8 57.5 0.84
Figure 10: Experiment 3: Average performance metrics for ARBITER+ with different components. The metrics are nor-malized to ARBITER(0.4,0.75,1.15), whose metric values are shown as labels.
streaming. The buffer-based scaling factor drives the target rate between to avoid temporal and visual QoE issues while ensuring persistent streaming for accurate rate estimation. Additionally, the hybrid throughput sampling improves the tractability of network rate changes through mixing syn-chronous and asynsyn-chronous sampling. The actual rate tracking is shown to be effective in reducing the impact of video rate variability. The controlled switching also reduces the switching frequency and stall probability. We tuned the performance of ARBITER+ using two objective QoE metrics that are fitted to subjective evaluation.
While tuning performance, the impact of different AR-BITER+ components is perceived differently by both QoE metrics. This difference confirms that QoE varies among different users. We believe that χ2 is more sensitive to stalls
while χ1 is more sensitive to visual QoE. Our results also
show that we can achieve a high level of QoE by properly tuned target rate estimation and using it as a rate bound. ARBITER+ addons (AR, CS, and HS) have insignificant or no impact on QoE but they have a noticeable impact on individual QoE components. Hence, they can be enabled or
Table II: The parameters of streaming algorithms
BBA2 [1] τB= 240 r= 2T r¯= 0.6B h= 0.9B ∆B= 0.875T ARBITER+ ω= 0.4 ρ= 0.75 ρ= 1.15 β= 60 W = 10 WV = 5 ns= 2 τ= 12 ELASTIC [4] BW= 30= 5 kp= 0.01 kI= 0.001 MPC [3] λ= 1 µ= 4300 µs= 4300 WE= 5 h= 5 B= 60
randr¯represent lower and upper bounds for the adaptive buffer reserve
disabled to match user QoE profile. For example, AR and HS noticeably improve stall performance through increasing the representation switches. Hence, they would be effective for a stall sensitive user. Similarly, ARBITER+SC would be appreciated by users who are sensitive to frequent quality switches.
C. Algorithm Performance Comparison
In this section, we compare the performance of AR-BITER+AR+CS+HS to BBA2, ELASTIC, and MPC. In the rest of this paper, we use ARBITER+ to denote the algorithm with all its addons. Table II shows the default values of the parameters of different algorithms. We have also tested different buffer sizes for both BBA2 and ELASTIC. As a notational mark, we use ALG-x to denote the adaptation logic-buffer size. For example, BBA2-240 means BBA2 with a 240-sec buffer. We noted that the buffer size significantly impacts the performance of BBA2 and ELASTIC. With the default buffer adopted by ARBITER+, its performance is insensitive to the actual maximum buffer size.
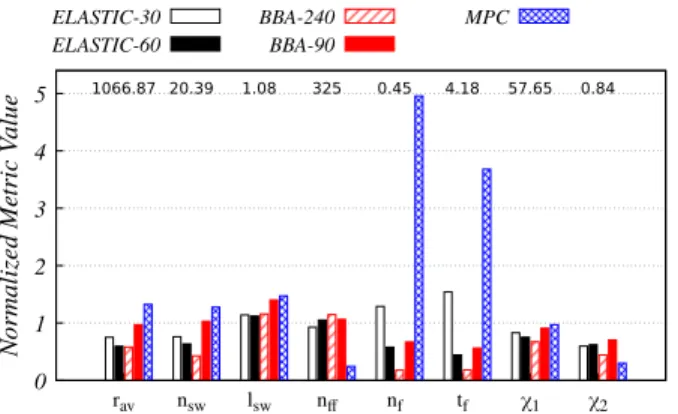
Figure 11 plots the average performance metrics normalized to corresponding ARBITER+ metric values. Each algorithm shows a completely different behavior. MPC tends to request high representation quality that is approximately 1.32x AR-BITER+ average video rate. Additionally, MPC encounters
0 1 2 3 4 5 rav nsw lsw n nf tf 1 2 Nor malized Me tric V alue ELASTIC-30
ELASTIC-60 BBA-240BBA-90 MPC
1066.87 20.39 1.08 325 0.45 4.18 57.65 0.84
Figure 11: Performance metrics for different algorithms nor-malized to ARBITER+, whose metric values are shown as labels.
3x stalls in comparison to ARBITER+ with 30% increase in tf and 71.5% reduction in nf f. While both MPC and
ARBITER+ achieve similar χ1, MPC poorly scores with χ2
metric realizing only 26% of ARBITER+ χ2 score.
With BBA2, we tested different buffer sizes including 60 sec, 90 sec, 120 sec and default 240 sec buffer. Changing the buffer size implicitly buffer level adaptation regions including the reservoir, the cushion, high-buffer zone. With small buffer sizes (≤60sec), BBA2 tends to download high video quality but it encounters frequent longer stalls and frequent large quality switches. Note that smaller buffer consequently have a smaller cushion region over which buffer-level to quality rate mapping takes place. On the other hand, large buffer size extends both reservoir and cushion regions leading to stabilizing switches and stalls but streams low video quality. We found that 90-sec buffer shows a balanced performance profile and scores high in both QoE metrics. In comparison to ARBITER+, BBA2-90 shows a better stall performance as it increasesnf f by 6% and reduced bothnf andtf by 33% and
46%, respectively. However, this is accompanied by a drop of 3% inrav and a 40% increase inlsw. Bothχ1andχ2metrics
show that ARBITER+ is more favorable by 10% and 30%, respectively.
Similar to BBA2, we tested different buffer levels for ELASTIC including the default 30-sec and 60-sec. We found that ELASTIC achieves the highest QoE metric product for its default buffer size (30 sec). ELASTIC-30 streams rav
that is only 78% ARBITER+ rate and performs only 76% of ARBITER+ switches. We believe that the usage of the conser-vative harmonic throughput estimator and its design to track a buffer level are key factors that trigger ELASTIC to streaming low video quality and performing fewer switches. However, this design helps filling the buffer leading to a relatively good stall performance even though it has the smallest buffer in the compared algorithms. Overall, ARBITER+ scores higher for bothχ1 andχ2 by 17% and 40%, respectively.
In mobile environments, the user may care about additional factors that are not captured by the video QoE metric. Power consumption is one of these metrics that may be affected by factors such as the buffer size and segment duration [19]. The power budget of video applications includes three
Table III: Average power consumption of different strategies per session measured as a percentage of the phone battery
Algorithm ARBITER+ ELASTIC BBA2 DEFAULT Power % 1.17 1.04 1.19 1.27
key elements: the processing power, the display power, and communication power. Table III shows the average power consumption per session measured as a percentage of the phone battery for different algorithms. These results show that ELASTIC achieves the lowest power consumption followed by ARBITER+, then BBA2 and DEFAULT. The reduced power consumption of ELASTIC is interpreted by its reduced communication power consumption as it downloads low video quality segments, which are usually smaller. However, this reduced power consumption is accompanied by a significant drop QoE in comparison to ARBITER+. With only 1% dif-ference in the average video session power usage of BBA2 and ARBITER+, they can be considered having similar power consumption. However, ARBITER+ maintains a noticeable performance gap in the overall user QoE. The DEFAULT Exo-player performance consumes 8% more power per session than ARBITER+. We also found that ARBITER+ achieves higher scores for both χ1 and χ2 by 13% and 28%, respectively.
These results confirm that ARBITER+ achieves a superior QoE performance and a balanced power usage.
D. Multi-client sharing a bottleneck
In this experiment, we investigate the performance of differ-ent algorithms when multiple clidiffer-ents share an LTE eNodeB. In this scenario, we consider six mobile clients sharing a 5 MHz eNodeB whose transmission power is set to 47.78dBm [20]. Each client streams a different video from a remote server that is connected to the cellular packet gateway using a 100Gb/s link with 40ms RTT delay. Each client starts the streaming with a one-second gap after the previous client.
The client mobility follows a Gauss Markov model [21] with an average speed of 30Km/h. The mobility is bounded to a box with a 400 m side with the eNodeB at the center. The channel between the eNodeB and mobile clients uses Log-Distance propagation loss model [20] and trace-based mobile fading. The fading traces are generated using the MATLAB script provided by LENA project. We repeated the simulation 30 times with different seed values that affect our random elements including mobility and channel fading.
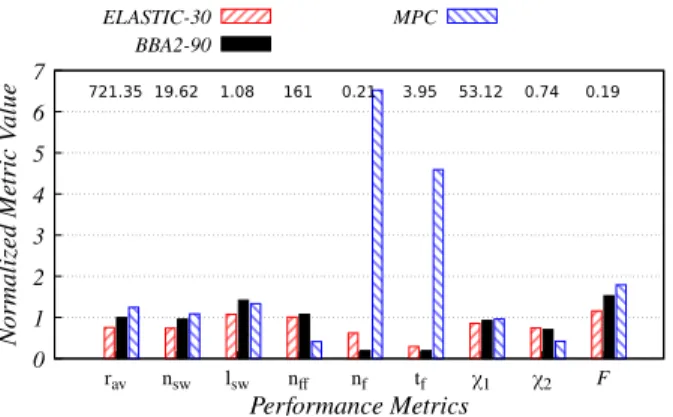
Figure 12 plots the performance metrics averaged over 180 sessions (6 clients x 30 runs). The performance in the sharing scenario is consistent with the performance obtained in trace-driven experiments. MPC streams the highestrav that is 1.23
the rav of both ARBITER+ and BBA2-90 while
ELASTIC-30rav is only 0.74 that of ARBITER+. ELASTIC-30 triggers
the least number of quality switches followed by BBA-90, ARBITER+, and MPC. However, ARBITER+ has the smallest
lsw followed by ELASTIC then MPC and BBA2 with a
noticeable gap.
MPC has only 37% freeze-free sessions followed by AR-BITER+ and ELASTIC with approximately 90% freeze free
0 1 2 3 4 5 6 7 rav nsw lsw n nf tf 1 2 F Nor malized Me tric V alue Performance Metrics ELASTIC-30 BBA2-90 MPC 721.35 19.62 1.08 161 0.21 3.95 53.12 0.74 0.19
Figure 12: Average performance metrics for 6 mobile clients sharing an eNodeB. The shown metrics are normalized to ARBITER+, whose metric values are shown as labels.
sessions then 90 with 96% freeze free sessions. BBA2-90 also encountered the least number of stalls nf and the
shortest total stall duration tf. This result illustrates the
effectiveness of buffer-based strategy in combating stalls.
ELASTIC-30 comes next to BBA2-90 for both nf and tf
followed by ARBITER+ and MPC comes last with a large performance gap. ARBITER+ also scores the highestχ2score
followed by ELASTIC-30, BBA2-90, and MPC with 74%, 70%, and 40% of ARBITER+ score. This result confirms that ARBITER+ strikes a balance between temporal and visual QoE dimensions leading to its superior QoE.
The video clients competition to shared resources is known to cause fairness issue [13], [2]. Figure 12 shows that AR-BITER+ achieves the lowest unfairness metricF [2] followed by ELASTIC-30, BBA2-90, and MPC. This result ensures that ARBITER+ does not only achieve the best QoE but it constitutes application level fairness when the video clients share network resources.
IV. RELATEDWORK
State-of-the-art client-based adaptive streaming algorithms can be generally classified as buffer-based, rate-based, and hybrid strategies [22]. Buffer-based strategies, e.g., [1], [23], mainly depends on the buffer level to select the representation rate. Buffer-based strategies are known to have a long conver-gence period until the selected quality matches the available system bandwidth. Rate-based, e.g., [2], design depends on estimating the available network bandwidth by observing the delivery rate of the downloaded segments. The streaming client typically requests the representation with the maximum rate below the estimated bandwidth. Most of the existing solution adopts moving average or harmonic mean estimators, which do not capture the time relevance of different samples and may not accurately capture the frequent variations in network bandwidth. Recently, Sun et al. [24] presented a data-drive throughput prediction model that improved the performance of different streaming strategies after integrating the prediction model as a rate estimator.
Several hybrid adaptation strategies integrate network and application information in advanced models to improve the
streaming decision. In [4], De Cicco et al. propose ELAS-TIC strategy that employs a proportional integral controller combined with a harmonic network throughput estimator to determine the next representation quality. In [3], Yin et al. pro-pose model predictive control (MPC) optimization framework that maximizes an ad-hoc QoE objective to identify the next segment quality. In [7], Beben et al. model the media buffer as a queuing system to calculate the stall probability (empty system). The arrival process distribution is modeled using segment fetch time statistics while the service distribution is represented by a deterministic distribution. For practical im-plementation, complex strategies, such as [3] and [7], rely on discretizing the parameter space of their adaptation algorithm to populate a database of solutions for different scenarios to guide quality selection in real-time.
Li et al. [11] propose PANDA as a streaming heuristic that selects the segment quality that ensures an accurate estimate for the measured network throughput by using the network per-sistently. It is worth noting that [4], [3], [2] employ harmonic throughput estimator, which is a conservative estimator and may under-estimate the network bandwidth in highly variable conditions leading to a lower video quality. ARBITER+ design combines the benefits of different adaptation approaches in a lightweight algorithm. Its throughput estimation depends on a tunable accurate averaging scheme that is combined with buffer scaling to improve the responsiveness to varying network conditions. Such responsiveness is a key factor for achieving a high QoE.
In wireless and mobile systems, achieving a high streaming QoE is challenging due to the variable nature of both encoded video and channel conditions. In [25], Xie et al. propose integrating physical layer information to improve the stream-ing performance in cellular systems. However, this approach is technology specific in comparison to using algorithms that solely depends on application layer information. Traffic shaping is also proposed at both server-side [26] and in the network [27], [14] to improve the streaming performance in wireless networks. The design of these solutions is orthogonal to the design of the client-based adaptation strategy. However, the interaction between different control loops of the streaming ecosystem should improve the overall user QoE.
In DASH systems, quality spans two dimensions, namely: temporal and visual aspects [28], [29], [15]. The former is related to time-related events such as initial startup delay and rebuffering frequency and duration while visual quality cap-tures the received image quality and quality switching behav-ior. Maximizing the received visual quality while minimizing temporal quality degradation represent a challenging design goal for adaptation strategies. Additionally, the underlying randomness in the operating conditions, e.g., streaming over highly variable conditions such as wireless systems [6], [7] and/or sharing a link among a number of users [13], introduces more challenges to the design. ARBITER+ decision engine is designed with these challenges in mind. Additionally, it integrates different components, such as AR, HS, and CS, that target specific QoE aspect without affecting the overall user QoE.
impair-ments on the user perceived QoE. In [30] Mok et al. propose a model for quantifying the impact of rebuffering events on user QoE. In [31], De Vriendt et al. propose a generic model to capture the impact of quality switching on the QoE. In [15], Liu et al. propose DASH-UE QoE model that quantifies the impact of both temporal and visual impairments with a high accuracy for videos up to 10 minutes. Considering the interaction of different impairment types is a unique feature in DASH-UE. Additionally, DASH-UE employs video quality metric (VQM) [32] to accurately model the switching impact on the visual QoE. ARBITER+ not only achieved the highest QoE scores for both metrics but also shows the best application-level fairness when a group of video users shares an LTE eNodeB.
V. CONCLUSIONS
The inherent rate variability in both video demand and network delivery represents a key challenge for supporting a high user QoE. Video variable bitrate is a natural outcome of compression techniques while network rate variability may happen for several reasons, such as network load changes in shared mediums, user mobility, and changes in wireless channel conditions. Handling video rate variability is com-monly overlooked in the design of adaptive bitrate algorithms. Additionally, network rate variability is usually accommodated by adopting conservative designs that reduce the overall user QoE. ARBITER+ represents a novel adaptation strategy that integrates several components that are designed to ensure high user QoE while accommodating the variability of both network delivery and video playout rates. We show using extensive experiments the impact of ARBITER+’s design components on the user QoE. We also show that ARBITER+ offers the best user QoE in comparison to state-of-the-art algorithms. Additionally, we show that ARBITER+ supports the best application level fairness when a group of users shares a wireless link.
VI. ACKNOWLEDGMENT
This publication has emanated from research conducted with the financial support of Science Foundation Ireland (SFI) under Grant No.: 13/IA/1892.
REFERENCES
[1] T.-Y. Huang, R. Johari, N. McKeown, M. Trunnell, and M. Watson, “A Buffer-based Approach to Rate Adaptation: Evidence from a Large Video Streaming Service,” inProc. of the 2014 ACM SIGCOMM ’14, Chicago, Illinois, USA, 2014, pp. 187–198.
[2] J. Jiang, V. Sekar, and H. Zhang, “Improving Fairness, Efficiency, and Stability in HTTP-based Adaptive Video Streaming with FESTIVE,” in
Proc. of CoNEXT ’12, Nice, France, 2012, pp. 97–108.
[3] X. Yin, A. Jindal, V. Sekar, and B. Sinopoli, “A Control-Theoretic Ap-proach for Dynamic Adaptive Video Streaming over HTTP,”SIGCOMM Comput. Commun. Rev., vol. 45, no. 5, pp. 325–338, Aug. 2015. [4] L. D. Cicco, V. Caldaralo, V. Palmisano, and S. Mascolo, “ELASTIC:
A Client-Side Controller for Dynamic Adaptive Streaming over HTTP (DASH),” inProc. of PV ’13, San Jose, CA, Dec 2013.
[5] A. Bokani, M. Hassan, S. Kanhere, and X. Zhu, “Optimizing HTTP-Based Adaptive Streaming in Vehicular Environment Using Markov Decision Process,” IEEE Trans. on Multimedia, vol. 17, no. 12, pp. 2297–2309, Dec 2015.
[6] A. H. Zahran, J. Quinlan, D. Raca, C. J. Sreenan, E. Halepovic, R. K. Sinha, R. Jana, and V. Gopalakrishnan, “OSCAR: An Optimized Stall-Cautious Adaptive Bitrate Streaming Algorithm For Mobile Networks,” inProc. MoVid’16 (to appear), 2016.
[7] A. Beben, P. Wi´sniewski, J. M. Batalla, and P. Krawiec, “ABMA+: Lightweight and Efficient Algorithm for HTTP Adaptive Streaming,” in
Proceedings of the 7th International Conference on Multimedia Systems, ser. MMSys ’16, 2016.
[8] T. Zhang, F. Ren, W. Cheng, X. Luo, R. Shu, and X. Liu, “Modeling and Analyzing the Influence of Chunk Size Variation on Bitrate Adaptation in DASH,” inin Proc. IEEE INFOCOM, Atlanta, GA, USA, May, 2017, 2017.
[9] J. J. Quinlan, A. H. Zahran, and C. J. Sreenan, “Datasets for AVC (H.264) and HEVC (H.265) for Evaluating Dynamic Adaptive Streaming over HTTP (DASH),” into appear Proc. of MMsys 2016 (dataset track), 2016.
[10] H. Riiser, P. Vigmostad, C. Griwodz, and P. Halvorsen, “Commute Path Bandwidth Traces from 3G Networks: Analysis and Applications,” in
Proc. of MMSys ’13, Oslo, Norway, 2013, pp. 114–118.
[11] Z. Li, X. Zhu, J. Gahm, R. Pan, H. Hu, A. C. Begen, and D. Oran, “Probe and Adapt: Rate Adaptation for HTTP Video Streaming At Scale,”IEEE J. Sel. Area in Commun., vol. 32, no. 4, pp. 719–733, 2014.
[12] F. Liu, B. Li, L. Zhong, B. Li, H. Jin, and X. Liao, “Flash Crowd in P2P Live Streaming Systems: Fundamental Characteristics and Design Implications,”IEEE Transactions on Parallel and Distributed Systems, vol. 23, no. 7, pp. 1227–1239, July 2012.
[13] S. Akhshabi, L. Anantakrishnan, A. C. Begen, and C. Dovrolis, “What Happens when HTTP Adaptive Streaming Players Compete for Band-width?” inProc. of NOSSDAV’12, ser. NOSSDAV ’12, 2012, pp. 9–14. [14] A. Zahran, J. Quinlan, K. K. Ramakrishnan, and C. Sreenan, “SAP: Stall-Aware Pacing for Improved DASH Video Experience in Cellular Networks,” in in Proc. of ACM Multimedia Systems 2017, Taipei, Taiwan, June 20-23, 2017., 2017.
[15] Y. Liu, S. Dey, F. Ulupinar, M. Luby, and Y. Mao, “Deriving and Validating User Experience Model for DASH Video Streaming,”IEEE Trans. on Broadcasting, vol. 61, no. 4, pp. 651–665, Dec 2015. [16] M. Jurvansuu, J. Prokkola, M. Hanski, and P. Perala, “HSDPA
Perfor-mance in Live Networks,” in2007 IEEE International Conference on Communications, June 2007, pp. 467–471.
[17] T. C. Thang, H. T. Le, H. X. Nguyen, A. T. Pham, J. W. Kang, and Y. M. Ro, “Adaptive video streaming over HTTP with dynamic resource estimation,”Journal of Communications and Networks, vol. 15, no. 6, pp. 635–644, Dec 2013.
[18] S. Petrangeli, J. Famaey, M. Claeys, S. Latré, and F. De Turck, “QoE-Driven Rate Adaptation Heuristic for Fair Adaptive Video Streaming,”
ACM Trans. Multimedia Comput. Commun. Appl., vol. 12, no. 2, pp. 28:1–28:24, Oct. 2015.
[19] J. Zhang, G. Fang, C. Peng, M. Guo, S. Wei, and V. Swaminathan, “Profiling energy consumption of DASH video streaming over 4G LTE networks,” inin Proc. of ACM Workshop on Mobile Video (MoVid), 05 2016, pp. 1–6.
[20] R. Sivaraj, I. Broustis, N. K. Shankaranarayanan, V. Aggarwal, R. Jana, and P. Mohapatra, “A QoS-enabled holistic optimization framework for LTE-Advanced heterogeneous networks,” in IEEE INFOCOM 2016 -The 35th Annual IEEE International Conference on Computer Commu-nications, April 2016, pp. 1–9.
[21] B. Liang and Z. J. Haas, “Predictive distance-based mobility man-agement for PCS networks,” in INFOCOM ’99. Eighteenth Annual Joint Conference of the IEEE Computer and Communications Societies. Proceedings. IEEE, vol. 3, Mar 1999, pp. 1377–1384 vol.3.
[22] J. Kua, G. Armitage, and P. Branch, “A Survey of Rate Adapta-tion Techniques for Dynamic Adaptive Streaming Over HTTP,” IEEE Communications Surveys Tutorials, vol. 19, no. 3, pp. 1842–1866, thirdquarter 2017.
[23] K. Spiteri, R. Urgaonkar, and R. K. Sitaraman, “BOLA: Near-optimal bitrate adaptation for online videos,” inIEEE INFOCOM 2016 - The 35th Annual IEEE International Conference on Computer Communica-tions, April 2016, pp. 1–9.
[24] Y. Sun, X. Yin, J. Jiang, V. Sekar, F. Lin, N. Wang, T. Liu, and B. Sinopoli, “CS2P: Improving Video Bitrate Selection and Adaptation with Data-Driven Throughput Prediction,” inProceedings of the 2016 ACM SIGCOMM Conference, ser. SIGCOMM ’16. New York, NY, USA: ACM, 2016, pp. 272–285.
[25] X. Xie, X. Zhang, S. Kumar, and L. E. Li, “piStream: Physical Layer Informed Adaptive Video Streaming over LTE,” inProc. of MobiCom ’15, Paris, France, 2015, pp. 413–425.
[26] K. Satoda, H. Yoshida, H. Ito, and K. Ozawa, “Adaptive video pacing method based on the prediction of stochastic TCP throughput,” in2012 IEEE Global Communications Conference (GLOBECOM), Dec 2012, pp. 1944–1950.
[27] R. Houdaille and S. Gouache, “Shaping http adaptive streams for a better user experience,” inProceedings of the 3rd Multimedia Systems Conference, ser. MMSys ’12. New York, NY, USA: ACM, 2012, pp. 1–9.
[28] M. Seufert, S. Egger, M. Slanina, T. Zinner, T. Hoßfeld, and P. Tran-Gia, “A Survey on Quality of Experience of HTTP Adaptive Streaming,”
IEEE Communications Surveys Tutorials, vol. 17, no. 1, pp. 469–492, Firstquarter 2015.
[29] M.-N. Garcia, F. De Simone, S. Tavakoli, N. Staelens, S. Egger, K. Brunnstrom, and A. Raake, “Quality of experience and HTTP adaptive streaming: A review of subjective studies,” in Quality of Multimedia Experience (QoMEX), 2014 Sixth International Workshop on, Sept 2014, pp. 141–146.
[30] R. Mok, E. Chan, and R. Chang, “Measuring the quality of experience of HTTP video streaming,” inIntegrated Network Management (IM), 2011 IFIP/IEEE International Symposium on, May 2011, pp. 485–492. [31] J. D. Vriendt, D. D. Vleeschauwer, and D. Robinson, “Model for estimating QoE of video delivered using HTTP adaptive streaming,” in 2013 IFIP/IEEE International Symposium on Integrated Network Management (IM 2013), May 2013, pp. 1288–1293.
[32] M. Pinson and S. Wolf, “A new standardized method for objectively measuring video quality,”Broadcasting, IEEE Transactions on, vol. 50, no. 3, pp. 312–322, Sept 2004.
Ahmed H. Zahran is currently a lecturer at the Computer Science Department, University College Cork (UCC), Ireland. He previously worked in dif-ferent institutions including Cairo University, Nile University, and the MISL group at UCC. He ob-tained his Ph.D. at the Department of Electrical and Computer Engineering, the University of Toronto in 2007 under the supervision of Prof. Ben Liang. He received his BSc and MSc in Electrical Engineering from Electronics and Electrical Communication De-partment at Faculty of Engineering, Cairo University in 2000 and 2002 respectively.
His research interests span different topics in wireless mobile networking such as multimedia streaming, cognitive networking, energy efficient network-ing, mobility and resource management, and modeling and performance eval-uation. His research received several awards including the first DASH Industry forum award in MMSys 2017, the best paper award in IFIP Networking 2005 conference, spotlight paper for IEEE Trans. Mobile Computing (June 2010), and UCC commercialization award 2010. He served as a technical reviewer for various journals and conferences including, but not limited to, the IEEE Trans. on Mobile Computing, IEEE Transactions on Wireless Communications, IEEE Communication Mag., ICC, WCNC, VTC, Globecom, IFIP Networking. He served on the organizing committee and the technical program committee of several conferences.
Darijo Raca received his BSc and MSc degrees in Electrical Engineering from the Department of Telecommunication, Faculty of Electrical Engineer-ing, University of Sarajevo, in 2008 and 2010, re-spectively. He is a PhD candidate at the Mobile and Internet System Laboratory, Department of Com-puter Science, University College Cork. His current research interests include multimedia networking, wireless and cellular systems, and data-driven net-work designs. He is a student member of IEEE and ACM.
Cormac J. Sreenanis a Full Professor and Head of Computer Science at University College Cork (UCC) in Ireland. Prior to joining UCC in 1999 he was on the research staff at AT&T Labs - Research, Florham Park, NJ, USA and at Bell Labs, Murray Hill, NJ, USA. At UCC he directs the Mobile & Internet Systems Laboratory (MISL), which is a group of 15 research staff and students with research activity in multimedia and wireless networking and systems. Recent projects have focused on wireless sensor networks, heterogeneous mobile networks and video streaming, and have been funded by industry, the EU and Irish state agencies, including Science Foundation Ireland (SFI). Prof. Sreenan is an SFI Principal Investigator and is a Co-PI on the CONNECT Research Centre on Future Networks & Communications involving 10 academic institutions and 37 sponsor companies. He is currently on the Editorial Boards of IEEE Transactions on Mobile Computing and ACM Transactions on Sensor Networks. In the past he has served as Guest Editor for Communications of the ACM, IEEE Journal on Selected Areas in Communications and IEEE Wireless Communications Magazine. He has a Ph.D. in Computer Science from Cambridge University and was elected a Fellow of the British Computer Society in 2005.