SOEPpapers
on Multidisciplinary Panel Data Research
Method Effects in Factorial Surveys:
An Analysis of Respondents' Comments,
Interviewers' Assessments, and Response
Behavior
629
20
1
4
SOEPpapers on Multidisciplinary Panel Data Research
at DIW Berlin
This series presents research findings based either directly on data from the German Socio-Economic Panel Study (SOEP) or using SOEP data as part of an internationally comparable data set (e.g. CNEF, ECHP, LIS, LWS, CHER/PACO). SOEP is a truly multidisciplinary household panel study covering a wide range of social and behavioral sciences: economics, sociology, psychology, survey methodology, econometrics and applied statistics, educational science, political science, public health, behavioral genetics, demography, geography, and sport science.
The decision to publish a submission in SOEPpapers is made by a board of editors chosen by the DIW Berlin to represent the wide range of disciplines covered by SOEP. There is no external referee process and papers are either accepted or rejected without revision. Papers appear in this series as works in progress and may also appear elsewhere. They often represent preliminary studies and are circulated to encourage discussion. Citation of such a paper should account for its provisional character. A revised version may be requested from the author directly.
Any opinions expressed in this series are those of the author(s) and not those of DIW Berlin. Research disseminated by DIW Berlin may include views on public policy issues, but the institute itself takes no institutional policy positions.
The SOEPpapers are available at
http://www.diw.de/soeppapers Editors:
Jürgen Schupp (Sociology)
Gert G. Wagner (Social Sciences, Vice Dean DIW Graduate Center) Conchita D’Ambrosio (Public Economics)
Denis Gerstorf (Psychology, DIW Research Director) Elke Holst (Gender Studies, DIW Research Director)
Frauke Kreuter (Survey Methodology, DIW Research Professor) Martin Kroh (Political Science and Survey Methodology)
Frieder R. Lang (Psychology, DIW Research Professor) Henning Lohmann (Sociology, DIW Research Professor)
Jörg-Peter Schräpler (Survey Methodology, DIW Research Professor) Thomas Siedler (Empirical Economics)
C. Katharina Spieß (Empirical Economics and Educational Science)
ISSN: 1864-6689 (online)
German Socio-Economic Panel Study (SOEP) DIW Berlin
Mohrenstrasse 58 10117 Berlin, Germany
Method Effects in Factorial Surveys: An Analysis of
Respondents’ Comments, Interviewers’
Assessments, and Response Behavior
Carsten Sauer∗1, Katrin Auspurg2, Thomas Hinz2, Stefan Liebig1,3
and J¨urgen Schupp3,4
1Collaborative Research Center 882, Bielefeld University
2Department of Sociology, University of Konstanz
3DIW Berlin
4Free University Berlin
AbstractThis paper describes the implementation of a factorial survey within the SOEP-Pretest of 2008 and investigates (1) respondents’ comments about the vi-gnettes, (2) interviewers’ assessments of respondents comprehension and willingness to answer, and (3) response behavior regarding response time, use of the answer-ing scale, and consistency of evaluations by different age groups and educational background. The respondents evaluated 24 vignettes consisting of ten dimensions that described full-time employees and their gross earnings. The evaluation task was to assess whether the given earnings were just or unjust, and if they were rated as unjust, respondents had to specify the amount of injustice on an 100-point rating scale. In regard to respondents’ comments, the critique mentioned most frequently by respondents referred to the content (unrealistic descriptions) and the number of the vignettes. The analysis of the interviewers’ assessments of respondents’ comprehension and willingness to answer revealed less comprehension and willingness to answer for older and less well educated respondents, although these differences were similar to those found for the complete questionnaire. The analysis of the response behavior revealed no differences of response time between the groups. Analyses of response consistency show that one should consider hints for simplifying heuristics: such heuristics can lead to an artificially high response consistency. The implications of the findings are discussed.
JEL: C81, D63, J31
∗
This is a revised and shortened version of SOEPpaper No. 238. Contact: [email protected]
1
INTRODUCTION
Over the last decade there has been a marked increase of studies in attitude and decision research which use thefactorial survey method.1 The factorial survey is an experimental method in which respondents evaluate hypotheti-cal descriptions of objects or situations (vignettes). In these descriptions the attributes (dimensions) are systematically varied. The respondents’ task is to evaluate each of these vignettes or to indicate what they would recom-mend or how they would act in the described situations. The aim is to identify those dimensions which affect the evaluation or decision and to as-sess their relative impact. The issues addressed in various studies include attitudes towards the justice of income and wages (Alves & Rossi, 1978; Hermkens & Boerman, 1989; Jann, 2008; Jasso, 1994; Jasso & Meyersson Milgrom, 2008; Jasso & Rossi, 1977; Jasso & Webster, 1997, 1999), on just taxation (Liebig & Mau, 2005), and just punishment (Berk & Rossi, 1977; Miller, Rossi, & Simpson, 1986). There are studies on the measurement of norms and values (Beck & Opp, 2001; Jasso & Opp, 1997; M¨as, M¨uhler, & Opp, 2005) and the degree of life satisfaction (Kapteyn, Smith, & Soest, 2008). Other studies simulate bargaining situations (Auspurg & Abraham, 2007; Auspurg, Abraham, & Hinz, 2009) or investigate trust (Barrera & Buskens, 2007). The joint endeavor of these studies is to measure the eval-uation of certain outcomes (e.g., income, grades, satisfaction, penalties) or certain decision-making processes in dependence on the particular situation or the social context, which is specified in the vignette. The use of the factorial survey method is driven by the promise that it allows to measure attitudes or decisions more differentiated than item-based approaches. The main advantages of the factorial survey design in comparison to item-based measurement are:
(1) The vignettes describe a situation more realistically—in everyday life people judge, decide or evaluate on a multitude of information and this is what factorial surveys simulate in their multidimensional descriptions; and
1The factorial survey was established in the social sciences by Peter H. Rossi in his dissertation in 1951. It was used for the measurement of social status and prestige of households (Alves & Rossi, 1978; Rossi, 1979; Rossi & Nock, 1982). Rossi’s central goal was the development of a method of measurement that distinguishes between the relative relevance of several factors for social attitudes (Rossi & Anderson, 1982). Wallander (2009) provides a review article, introductions to the method provide Alexander and Becker (1978), Beck and Opp (2001), Jasso (2006), Mutz (2011: pp. 54-67), and Rossi and Anderson (1982).
(2) the experimental approach ensures that the dimensions vary inde-pendently from each other.
On the other hand, one can argue that factorial surveys are more com-plex for respondents than standard survey tools (due to long descriptions, difficult rating task) and therefore method effects are likely to occur. De-spite the growing number of applications there is little empirical knowledge on the methodological implications and effects of the factorial survey design. This is especially true for the use of factorial surveys in population samples. As the research design and the respondents’ rating task are usually complex, a number of methodological effects may occur and, as a consequence, may risk the validity of the results. Therefore, this paper investigates (1) respon-dents’ comments, (2) interviewers’ assessments, and (3) response behavior and studies differences between age groups and educational groups.
The analysis is based on a factorial survey module implemented in a pretest of the German Socio-economic Panel (hereafter SOEP-Pretest) in 2008. The substantive topic of the implemented factorial survey was the justice of earnings. Respondents were confronted with 24 descriptions of fictitious workers who differed in certain characteristics such as gender, age, education, occupation or level of individual effort. In each of the cases respondents had to evaluate whether the presented gross earnings were just or unjust.
The paper is organized as follows: First, we give an overview on the construction of factorial survey designs. Second, we describe the implemen-tation of the instrument in the SOEP-Pretest 2008, and the respondent and vignette sample. Third, we investigate the capability of the factorial survey design by analyzing the direct feedback of respondents and interviewers, and the respondent behavior. In the last chapter we summarize our findings and stress the main methodological implications of this study.
2
THE FACTORIAL SURVEY APPROACH
The development of a factorial survey includes the following steps: (1) the construction of vignettes and dimensions, (2) the vignette sampling, and (3) the construction of a response scale.
(1) Constructing the vignettes describing persons, situations or objects is the most important step in designing factorial surveys. First, the dimensions
have to be identified, which theoretically influence the response behavior. This step should be based on theoretical considerations (Alves, 1982; Jasso, 2006) and be carried out very carefully as seemingly simple decisions (such as the definition of the number of levels used) have a great impact on the conceptual design and analysis of factorial surveys. Then, the levels of each dimension relevant for the evaluations have to be defined. Qualitative dimensions (such as the sex of a person) have a naturally limited number of levels (male and female). However, the range and number of levels of continuous dimensions (such as age) have to be defined. Age, for example, can be restricted to a range from 30 to 60 years with four (e.g., 30, 40, 50 and 60 years) or seven (e.g., 30, 35, 40, 45, 50, 55, 60) levels. Note, that the number of parameters, which have to be estimated in the analysis, increases exponentially with the number of dimensions and (qualitative) levels (Alves, 1982; Jasso, 2006).
(2) After specifying the dimensions and levels the vignette universe of all possible combinations can be generated. Its size can be calculated by multiplying all attribute levels with each other (Cartesian product). In the case of three dimensions with five levels each the universe consists of 5×5×5 = 125 vignettes. In many applications illogical or implausible com-binations between levels can occur (e.g., a medical doctor without university degree), which should be excluded. Usually the complete vignette universe cannot be rated by a single respondent, because of its vast extensiveness, so it is necessary to work with samples. It is possible to use one single sample for all respondents or to split the sample into sub-samples rated by different respondents. The latter allows using overall a higher number of vignettes. In an extreme case each respondent evaluates a unique sample. The vignette sample can be obtained by using a random (Jasso, 2006) or a quota design (D¨ulmer, 2007; Kuhfeld, 2005; Kuhfeld, Tobias, & Garrett, 1994; Steiner & Atzm¨uller, 2006). In both cases, the aim is to get a sample with low cor-relations between the dimensions. The dimensions are orthogonal in a full factorial design (vignette universe) and so all main and interaction effects can be estimated. This is not possible for all main and interaction effects in a reduced sample because some effects will be confounded. As recent stud-ies suggest quota designs are more efficient compared to random samples in regard to orthogonality and balance, i.e. each level of a dimension appears
equally often. Gains of efficiency of quota designs are especially high for small samples (D¨ulmer, 2007; Steiner & Atzm¨uller, 2006).2
(3) For the evaluation task different scales can be used. One may use categorical or rating scales (e.g., D¨ulmer, 2001; M¨as, et al., 2005; Schulte, 2002; Thurman, Lam, & Rossi, 1988). They are comparable to those used for standard questions. Moreover, many factorial survey studies use metric scales, where respondents first give a general direction of their judgment and then express their evaluation by a certain value on an open scale (e.g., Jasso & Meyersson Milgrom, 2008; Jasso & Webster, 1997, 1999; Jasso, 2006; Wegener, 1978; and critical Schaeffer, et al., 1989; Teas, 1987). The present study uses a 100-point scale (see Figure 1).
3
THE SOEP-PRETEST 2008
The program of the annual SOEP questionnaire for the following wave is pretested in each summer of the preceding year. The objective of these pretests is to test new modules and modifications of questions. For several years the SOEP-Pretest goes far beyond the standard format of a pretest. Since 2002 the sample size is around 1,000 respondents and considered rep-resentative for the German resident population of 16 years and older (Siegel, Stocker, & Warnholz, 2009).
There are two main differences between the pretest and the SOEP main survey. First, all interviews in the SOEP-Pretest are programmed as com-puter assisted personal interviews (CAPI), in contrast to paper and pencil questionnaires mostly used in the main survey. Second, whereas the main survey is a study of private households, the SOEP-Pretest is a sample of individuals. The pretest sample is not related to the main survey, meaning that these respondents are not part of the panel study. The 1,066 inter-views of the SOEP-Pretest 2008 were conducted in the period from 1st to 31st August. The median processing time for the whole questionnaire was 45 minutes.
2Fractional factorial designs maximize orthogonality. In so called D-efficient designs the goal is to reach, besides orthogonality, maximum variance of attributes. The D-efficient design should be the preferred approach especially for vignette populations with implausible combinations.
3.1 Vignette Dimensions and Levels
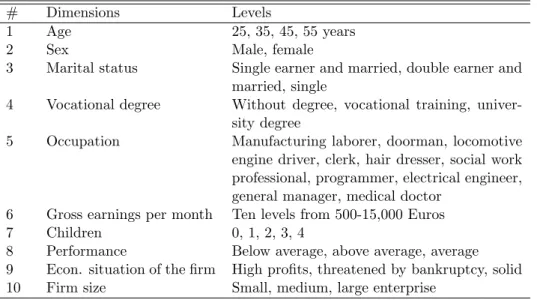
Within the SOEP-Pretest 2008 the factorial survey module focused on the justice evaluation of fictitious full time employees (40 hours per week). These employees were described by ten dimensions. Each respondent had to eval-uate 24 vignettes.3
The ten dimensions were selected based on findings of previous factorial surveys on the justice of earnings (Alves, 1982; Alves & Rossi, 1978; Jann, 2008; Jasso, 1978; Jasso & Rossi, 1977; Jasso & Webster, 1997, 1999). These studies show that the dimensions age, gender, number of children, occupa-tion and vocaoccupa-tional degree have a significant influence on justice evaluaoccupa-tions. Further dimensions, commonly known as relevant from justice research and related fields, were added. These dimensions are the performance on the job and the marital status (Liebig & Schupp, 2005, 2008a, 2008b; Struck et al., 2006). Some context characteristics were added, known as important for the actual income such as the size and economic situation of the firm (Hinz & Abraham, 2005), to learn more about the relevance of structural characteristics on justice evaluations. Table 1 shows the dimensions and their levels.
3.2 Vignette Sampling
In the present study the vignette universe consisted of 972,000 cases. Some combinations were excluded from the vignette universe as they described cases which can not be found in the real world and were therefore defined as illogical and implausible, like certain combinations of gross earnings and occupation:
• Gross earnings of more than 3,800 Euro for manufacturing workers
• Gross earnings of more than 5,400 Euro for doorman and locomotive engine drivers
• Gross earnings of more than 6,800 Euro for clerk, hair dressers and social work professionals
3
All respondents rated an example vignette with the help of the interviewer at the beginning. The content of this vignette was: “A 35 year old single man with vocational training works as a hair dresser in a small company which achieves substantial gains. His performance on the job is outstanding and he earns a gross income of 350 Euro per month. Is the gross income of this employee in your opinion just or unjust?”
Table 1: Vignette dimensions and their levels in the SOEP-Pretest
# Dimensions Levels
1 Age 25, 35, 45, 55 years 2 Sex Male, female
3 Marital status Single earner and married, double earner and married, single
4 Vocational degree Without degree, vocational training, univer-sity degree
5 Occupation Manufacturing laborer, doorman, locomotive engine driver, clerk, hair dresser, social work professional, programmer, electrical engineer, general manager, medical doctor
6 Gross earnings per month Ten levels from 500-15,000 Euros 7 Children 0, 1, 2, 3, 4
8 Performance Below average, above average, average 9 Econ. situation of the firm High profits, threatened by bankruptcy, solid 10 Firm size Small, medium, large enterprise
• Gross earnings below 1,200 Euro for electrical engineers
• Gross earnings below 2,500 Euro for general managers or medical doc-tors
Implausible combinations of vocational training and occupation were:
• Electrical engineers without vocational training or university degree
• Medical doctors without a university degree
The exclusion of illogical combinations always leads to correlations be-tween dimensions, as can be seen in Table 10 in the Appendix.4 We drew the vignette sample with a quota design (D-efficient design) under (simul-taneous) exclusion of the illogical cases using SAS software (Kuhfeld, 2005; Kuhfeld, et al., 1994). First, we drew 240 vignettes with a D-efficiency of over 90 and, second, we fractionalized them to ten decks with 24 vignettes5 each.
4
We used the Magnitude Prestige Score (MPS; Wegener, 1985) as a metric measure of the occupational status in the analysis.
5
The maximum D-efficiency in a symmetric design is 100. Often the best achievable efficiency is less than 100.
3.3 Response Task and Presentation of Vignettes
The rating task was a three-step procedure: first, the respondents had to evaluate whether the gross earnings of the vignette person were just or unjust. The respondents continued with the next vignette if they evaluated the earnings as just. Second, if the respondents evaluated the earnings as unjust they had to specify whether the earnings were too high or too low. In a third step, the respondents had to estimate the amount of injustice using a metric scale ranging from 1, some injustice, to 100, extreme injustice. Figure 1 shows an example for a vignette text with the three-step rating task.
9
Figure 1: Vignette with Ten Dimensions and Rating Task
A 45-year old woman, married, with two children, and a husband who does not have own income,
she has vocational training and
works as a hairdresser in a large company, which is threatened of bankruptcy, Her performance on the job is below the average,
She earns 1200 Euro gross income per month before taxes.
Your rating:
F 1:
From your point of view, is the gross income for this person just or unjust? □ Gross income is just (Æ carry on with the next person description)
□ Gross income is unjust (Æ carry on with F 2) F 2:
Is the gross income unjustly too high or too low? □ unjustly too high (Æ carry on with F 3) □ unjustly too low (Æ carry on with F 3)
F 3:
With regard to your personal feeling, which number between 1 and 100 describes most adequately the amount of injustice?
3.4 Respondents and Vignette Sample (SOEP Pretest 2008)
The realized sample of the SOEP-Pretest relies on a three step probability sampling procedure according to the ADM-Design. The response rate reported by TNS Infratest Sozialforschung is about 50 percent (Siegel et al. 2009). The realized sample (N = 1,066) was weighted in regard to regional and demographic distribution. It is warranted that the weighted sample is representative for the German population, even though only unweighted data are used in the report at hand. Table A1 in the Appendix gives an overview of the realized sample.
Respondents were assigned to one of the ten vignette decks randomly. The distribution of respondents to each deck is reported in Table 2. The number of realized respondents by deck ranges between 96 (decks 2 and 7) and 127 (deck 9).10 The correlations
10 The range does not differ significantly from chance (Chi-Square-Test = 9.0; df = 9; p = 0.436).
Figure 1: Vignette example with three-step rating task
The complete questionnaire within the SOEP-Pretest 2008 was designed as a CAPI version and interviewers read the questions to the respondents. In the vignette module, however, respondents read and evaluated the vignettes self-administered. The interviewers were sitting opposite to the respondents
to answer any questions that could occur during the evaluation task. In an introduction screen respondents additionally got information about what to do and how to use the scale. Then, the respondents judged an example vignette to learn the task. After this example vignette the respondents were randomly assigned to one of the ten decks with 24 vignettes. The design has the shortcoming that the respondents could not skip to the next vignette without a rating. It is possible, however, to reconstruct refusals by very short response times.
3.4 Respondents and Vignette Sample
The respondent sample was based on a three-step probability sampling pro-cedure according to the ADM-Design. The response rate reported by TNS Infratest Sozialforschung was about 50 percent (Siegel, et al., 2009). The realized sample (N = 1,066) was weighted in regard to regional and demo-graphic distribution. It is warranted that the weighted sample is represen-tative in respect to official statistics, even though only unweighted data are used in the report at hand. Respondents were randomly assigned to one vignette deck. The number of realized respondents by deck ranges between 96 and 127 respondents.6 The correlations between the dimensions in the whole vignette sample (see Appendix Table 10) and in the single decks were very low, meaning that the design was efficient in a statistical sense. 3.5 Analysis
Three sources of data were used for analysis.
1. Respondents’ comments: After the respondents evaluated the vignette module they were asked to leave critical comments about the vignette module. We grouped and summarized them by topic of comment. 2. Interviewers’ assessments: The interviewers were asked to evaluate the
respondents’ comprehension of the vignette task and the willingness to answer on a 6-point rating scale (very good, good, satisfying, adequate, inadequate, deficient). The interviewers also evaluated the respondents’ comprehension and willingness to respond for the complete question-naire. For comparison purposes we report the evaluations for the vignette
6
task and for the whole questionnaire. The complete questionnaire con-sisted of other new instruments, which were tested and a part with stan-dard questions on socio-demographic information (the survey report with the questionnaire in German is available at: http://panel.gsoep.de/soep-docs/surveypapers/diw ssp0069.pdf). As factorial surveys require more attention and concentration from respondents compared to other parts of the questionnaire, method effects are likely to occur between respondents of different age and education. To analyze them, we categorized respon-dents in three age groups (between 16 and 39 years, 40 to 65 years, and over 65 years) and three educational groups (general educational level: lower (Hauptschule), middle (Realschule) and higher (Abitur) secondary school certificate).
3. Response behavior: We investigated (1) response times measured for the complete vignette module, (2) the use of the answering scale, and (3) the consistency of responses.
Response times: The response time is only available for the whole vi-gnette module. We used the raw response time measured automatically during the interview. The analysis of this kind of “process produced data” is problematic because important context information like inter-ruptions during interviews is often neglected. Nevertheless, the gathered data provide useful information—for instance in respect to refusals. Use of the answering scale: We investigated the first step of the rating task by analyzing how frequent respondents evaluated earnings on the vignettes as being “just.” Moreover, we investigated the frequency and variation of the different numbers used in the third step of the rating procedure. The idea of three-step evaluations is to generate one metric scale by combining the three steps.
We coded the scale as follows: if respondents evaluated the earnings of the vignette person as just, the value of the new metric scale was coded as zero. If respondents evaluated vignette persons as under-rewarded in the second step of the rating and specified an amount of injustice in the third step, the values were coded with negative numbers (−100 to
−1). If respondents evaluated vignette persons as being over-rewarded, the amount of injustice is represented by positive numbers (+1 to +100). Hence, the metric scale ranges from−100 to +100.
Consistency: We used two strategies to check for consistency of evalua-tions. The first strategy was to take a look at the model fit (with the evaluations as outcome and the vignette dimensions as regressors) dur-ing different response sequences. The second strategy was to investigate how the consistencies depended on respondent attributes such as age or educational level. The analyses of consistency were based on multinomial logit models. We used the information gained from the first two steps of the vignette rating, namely if the earnings were evaluated as just or un-just, and if they were assessed as too high or too low. The coding is: −1 (unjustly underpaid), 0 (just) and 1 (unjustly overpaid). We measured the model fit by the McFadden-Pseudo-R2 (Long, 1997; Long & Freese, 2006). The Pseudo-R2 is not a measure for the proportion of variance ex-plained (unlike theR2 in OLS-Models), but gives a hint for the goodness of fit of the model and at the same time for the consistency of respondent behavior. Moreover, we checked if the number of significant coefficients, as a proxy for information perceived as relevant by the respondents, var-ied in different parts of the module or between respondent groups.7 The
ten dimensions were included into the model as independent variables. The multinomial logit model had 15 independent coefficients (because of the dummy-coding for the dimensions marital status, vocational train-ing, performance, firm size and economic situation of the firm). Without the constant, 15×2 = 30 coefficients were predicted and therefore, the maximum number of significant coefficients was 30.
4
RESULTS
4.1 Respondents’ comments
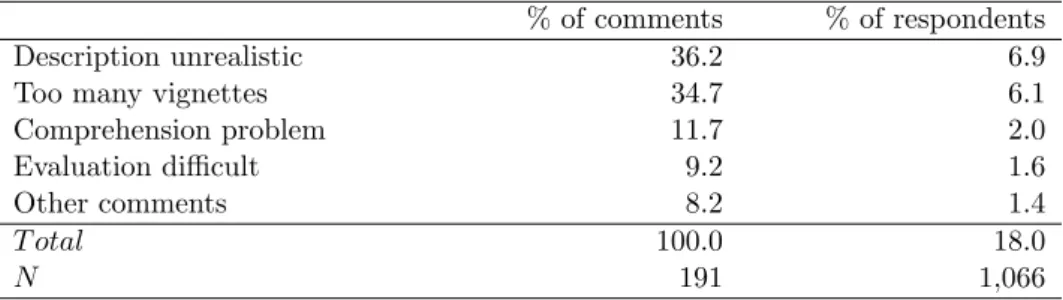
A total of 191 respondents made a comment to mention what they did not like in the vignette module. It is not traceable whether the other respondents had no critique at all or just did not want to answer the open question. Table 2 shows the mentioned comments.
In 36 percent of the cases (seven percent of the whole respondent sample) respondents evaluated the descriptions to be unrealistic in at least some
7
Most researchers use the consistency measured by the model fit to underline the fact that their dimensions are adequate. But this criterion may not be sufficient (Auspurg, Hinz, & Liebig, 2009) because respondents may produce consistent judgments also by fading out some dimensions in cases of overburden or fatigue.
Table 2: Summary of respondents’ comments on vignettes
% of comments % of respondents Description unrealistic 36.2 6.9 Too many vignettes 34.7 6.1 Comprehension problem 11.7 2.0 Evaluation difficult 9.2 1.6 Other comments 8.2 1.4
T otal 100.0 18.0
N 191 1,066
vignettes. 35 percent (six percent of all respondents) of those who made a comment perceived the vignette part consisting of 24 vignettes as too long. Twelve percent of those who provided a comment (two percent of the whole sample) had problems with the comprehension of the rating procedure within the vignettes. Nine percent of the 191 respondents who made comments had difficulties to assign the income as just or unjust. So, the major problems mentioned were that the descriptions were unrealistic in some cases and that the number of vignettes was to high.
4.2 Interviewers’ Assessments
In the following, the interviewers’ assessments of the respondents’ compre-hension and willingness to participate in the vignette module are reported and compared to the assessments how the respondents performed in the whole questionnaire. Note, the limitation of these findings are that they are based on subjective interviewer assessments.
Comprehension of the vignette task. As shown in Table 3 more than 80 percent of the respondents understood the vignette part at least well (categories: very good and good), compared to 90 percent who understood the task of the whole questionnaire well. This difference of ten percentage points indicates that the vignette module was more complex than other parts of the questionnaire. However, the comprehension was similar to other complex modules in the SOEP-Pretest (not displayed).
Table 4 shows the comprehension differences between the age groups. According to the interviewers, more than 50 percent of the youngest re-spondents had a very good understanding of the vignettes compared to 30 percent of the oldest interviewees. 40 percent of the latter group
Table 3: Comprehension (in percent) Evaluation Vignettes Questionaire Very good 41.74 51.13 Good 40.34 40.15 Satisfying 12.95 6.75 Adequate 3.19 1.41 Inadequate 0.75 0.28 Deficient 1.03 0.28 T otal 100.00 100.00 N 1,066 1,066
hended the task well (category: good). Moreover, ten percent of respon-dents over 65 years understood the vignettes worse than satisfying. The table footer provides a test of independence between comprehension and age group. The highly significantχ2-value indicates differences between the age groups. Moreover, Cram´er’sV, as a measure of association (based on the
χ2-value and ranging from 0−1), indicates a moderate association between comprehension and age group. Additionally, these measures are reported for the whole questionnaire. The values indicate a similar association between comprehension and age for the whole questionnaire.
Table 4: Comprehension by age group (in percent)
Comprehension 16-39 years 40-65 years Over 65 years Total Very good 50.83 43.84 30.46 41.74 Good 37.95 39.95 43.08 40.34 Satisfying 9.24 13.24 16.00 12.95 Adequate 0.99 2.05 6.77 3.19 Inadequate 0.00 0.23 2.15 0.75 Deficient 0.99 0.68 1.54 1.03 T otal 100.00 100.00 100.00 100.00 N 303 438 325 1,066
Test of equality between age groups:χ2(10) = 56.12;p=.001; Cram´er’sV =.16
Table 5 reports the comprehension by educational group. In 50 percent of the cases respondents with the highest education level had a very good comprehension of the vignette module. In 40 percent of the cases the com-prehension was still good. The middle group performed similar with a total of 90 percent who understood the task at least well. From those who held a lower secondary school certificate (Hauptschule) almost 80 percent under-stood the task well. There were significant differences between educational groups in regard to comprehension, although the association (Cram´er’sV) between educational level and comprehension was smaller than the associ-ation between age group and comprehension. The associassoci-ation between age groups and comprehension and educational groups and comprehension were similar in the whole questionnaire (reported in the table footer), meaning that there seemed to be no vignette specific comprehension problems.
Table 5: Comprehension by educational group (in percent)
Comprehension Lower sec. school Middle sec. school Higher sec. school Total Very good 38.32 42.90 47.35 41.82 Good 39.55 42.90 37.96 40.23 Satisfying 16.19 10.57 9.80 12.97 Adequate 4.71 1.51 2.45 3.20 Inadequate 0.41 1.51 0.41 0.75 Deficient 0.82 0.60 2.04 1.03 T otal 100.00 100.00 100.00 100.00 N 488 331 245 1,064
Test of equality between educational groups:χ2(10) = 25.31;p=.005; Cram´er’sV=.11
Comprehension of the whole questionnaire:χ2(10) = 31.80;p < .001; Cram´er’sV=.12
Willingness to answer. In over 80 percent of the cases the willingness to answer was in the vignette module—according to the interviewers—good or very good in comparison to almost 90 percent for the whole questionnaire. Table 6 shows the willingness to answer by age group. The willingness to answer differed between age groups in the vignette module but also in the whole questionnaire.
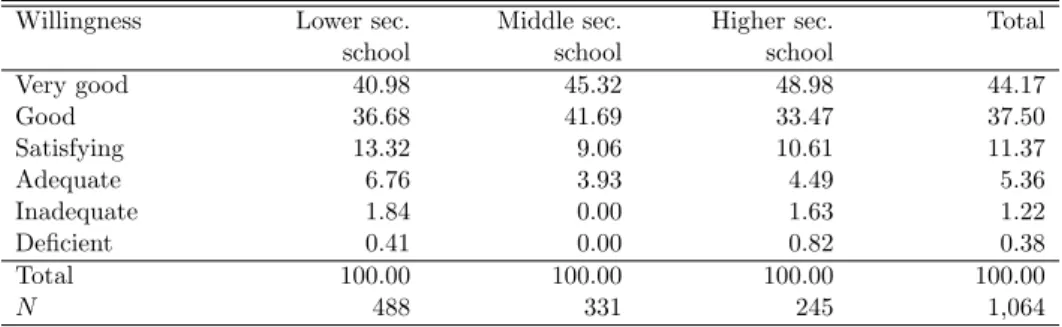
Table 7 reports the willingness to answer by educational group. In the group of respondents with a lower secondary school certificate 78 percent of the interviewers rated the respondents’ willingness to answer at least as good, in comparison to 83 percent and 87 percent in the other groups. There were significant differences between educational groups, but the association
Table 6: Willingness to answer by age group (in percent)
Willingness 16-39 years 40-65 years Over 65 years Total Very good 52.48 46.58 33.23 44.18 Good 37.29 36.76 38.77 37.52 Satisfying 6.60 11.19 16.00 11.35 Adequate 3.30 4.34 8.62 5.35 Inadequate 0.00 0.68 3.08 1.22 Deficient 0.33 0.46 0.31 0.38 Total 100.00 100.00 100.00 100.00 N 303 438 325 1,066
Test of equality between age groups:χ2(10) = 50.29;p < .001; Cram´er’sV =.15
Willingness to answer for the whole questionnaire:χ2(10) = 22.43;p=.013; Cram´er’sV=.10
was again smaller than the association for age groups. Similar differences can also be reported for the whole questionnaire (in the table footer).
Table 7: Willingness to answer by educational group (in percent)
Willingness Lower sec. school Middle sec. school Higher sec. school Total Very good 40.98 45.32 48.98 44.17 Good 36.68 41.69 33.47 37.50 Satisfying 13.32 9.06 10.61 11.37 Adequate 6.76 3.93 4.49 5.36 Inadequate 1.84 0.00 1.63 1.22 Deficient 0.41 0.00 0.82 0.38 Total 100.00 100.00 100.00 100.00 N 488 331 245 1,064
Test of equality between educational groups:χ2(10) = 20.37;p=.026; Cram´er’sV =.10
Willingness to answer for the whole questionnaire:χ2(10) = 25.74;p=.004; Cram´er’sV =.11
In sum, interviewers’ assessments of respondents’ comprehension and willingness to fulfill the task do not show big differences between age groups and educational groups. There is a tendency that younger and more ed-ucated respondents had a better comprehension of the task and a higher willingness to answer. However, according to the interviewers assessments, the pattern is similar for the whole questionnaire. This result can be in-terpreted as a first hint that vignettes are applicable in general population surveys.
4.3 Response Behavior
Response behavior provides insights into the rating situation and allows drawing conclusions regarding the capability of the vignette module. In the following, a closer look is taken on response time, the use of the rating scale, and the consistency of the vignette judgments.
4.3.1 Response Time
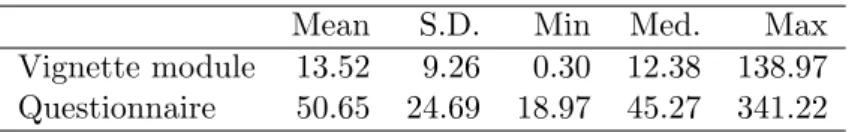
Table 8 provides information about the response time. A measured response time of 20 seconds (minimum value) for the complete module can be inter-preted as a refusal. Approximately five percent needed less than three and a half minutes to complete this part of the questionnaire which is an average of eight seconds per vignette. Two interviews build the counterpart with 137 and 139 minutes processing time (on the average five minutes per vi-gnette), maybe due to unmeasured breaks. The respondents needed about 13.5 minutes to evaluate the vignettes (24 plus the example vignette). The median was 12.4 minutes (Table 8).8
Table 8: Interview time for the vignette module and the whole questionnaire (in minutes)
Mean S.D. Min Med. Max Vignette module 13.52 9.26 0.30 12.38 138.97 Questionnaire 50.65 24.69 18.97 45.27 341.22
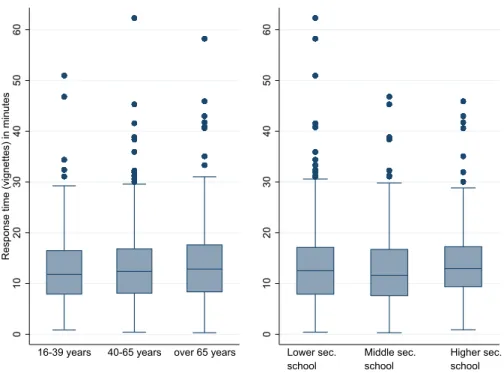
Figure 2 shows the box plots of the process time for different age groups (left box plots) and educational groups (right box plots).9 The medians (line in the middle of the plots) and the 25thand 75thpercentiles (lower and upper bounds) indicate no big differences between the groups. Respondents with higher education level and older respondents were in need of slightly more time to fill in the questionnaire (median for older aged being one minute more). An ANOVA-test of differences between age groups was insignificant (F = 1.31;p=.27, under the exclusion of factual refusals and the two out-liers). There were also no significant differences between educational groups (F = 2.76;p = .064). In sum, these results indicate that in a population
8The respondents started the vignette module on average after 25 minutes of ques-tioning.
9Two outliers (137 and 139 minutes) are not displayed in the Figure 2.
survey vignettes can be evaluated in a tolerable amount of time. The me-dian shows an average of 30 seconds per vignette. The differences between respondents of different education or age were small. All respondents were able to process the vignette module in a similar period of time.
0 10 20 30 40 50 60
Response time (vignettes) in minutes
16-39 years 40-65 years over 65 years
0 10 20 30 40 50 60 Lower sec.
school Middle sec.school Higher sec.school
Figure 2: Response time of the vignette part by age and education groups (in minutes)
4.3.2 Use of the Response Scale
8,897 vignette persons were evaluated as justly paid, 8,759 were evaluated as under-rewarded, and about 7,928 vignette persons were evaluated as over-rewarded. At the first glance the ratings show a dominance of the “just” category.
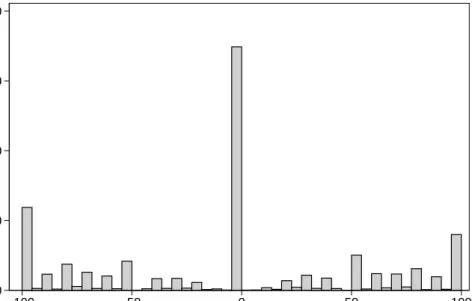
Figure 3 displays the distribution of the evaluations. The graph shows that the category “zero,” respectively “just,” extremely dominates the other scale values. The agglomerates at the borders of the distribution show ceiling effects, especially in the negative range. In addition, some values—round numbers—were mentioned more frequently than others (e.g., −100, −50, 0, 50, 100). To determine in more detail how the respondents used the
0 10 20 30 40 Percent -100 -50 0 50 100 justice evaluation
Figure 3: Distribution of the vignette judgments
response scale we focused on two aspects. First, it is remarkable how of-ten respondents evaluated the vignettes as “just.” One could assume that choosing the “just”-category reflects the wish to speed up the evaluation task and goes hand in hand with fatigue effects as respondents have to fulfill only one rating step instead of three. Both would suggest a rating pattern with more “just”-ratings at the end of the module. However, the correlation between the position of the vignette within the module and the rating was low, meaning that there are no hints for more “just”-ratings in later vignette positions (ρ =.17;p=.41). There were also no quadratic or cubic associations between the occurrence of the category “just” and the vi-gnette position. Nevertheless, the frequent occurrence of the zero compared to other values of the scale indicates that respondents tried to avoid the other steps of the answering process. A study (Sauer et al., 2011) that uses comparable vignettes in a heterogeneous respondent sample reports a more balanced distribution of the evaluations using an 11-point rating scale.
Second, we analyzed in more detail how many different values each re-spondent used for his or her judgments (max. 24) and what kind of scaling they applied. The average number of different values was 8.5, the median was 8.0. There were differences between educational groups. Respondents
with a lower secondary school certificate (Hauptschule) used significantly fewer values (p < .05) for the rating compared to respondents with a higher secondary school certificate (Abitur). This could indicate that people with higher education used the scale in a more fine-grained way. Similar results were found with regard to magnitude scales in methodological studies on conjoint analysis (Steenkamp & Wittink, 1994; Teas, 1987). The age groups did not differ significantly from each other.
In a next step, the range of values and the distances between them was analyzed. About eight percent of the respondents used numbers with a distance of 25 in each of the 24 vignettes (25, 50, 75, 100). For two third of the respondents a 10-point scale would have been appropriate as they only used decimal steps. 90 percent of the respondents used at the most 5-point steps (which is covered by a 20-point scale).
4.3.3 Consistency of Judgments
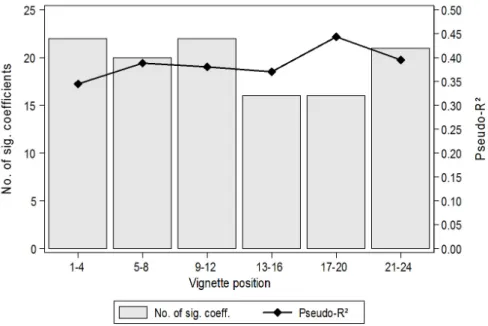
Figure 4 shows the Pseudo-R2 values (connected line) in six phases of the vignette module (multinomial logit models for each sequence). The most consistent phase was the fifth (vignette 17 to 20) with a Pseudo-R2 value of 0.4. In the first sequence the Pseudo-R2 was far below 0.4, which is the lowest value of all parts. In the middle part the Pseudo-R2 was slightly less than 0.4. There were only marginal differences between the phases. At the first glance these results imply the absence of fatigue effects in the vignette part. But the respondents could also have produced consistent ratings by fading out some dimensions. Therefore, we investigated in a further research step the number of significant effects (significance at the 5%-level) per sequence.
Figure 4 shows that in the first, third, and sixth phase of the vignette module more than 20 coefficients were significant. In the second phase 20 coefficients were significant, but in the fourth and fifth sequence we found only 16 significant effects. Figure 4 highlights the differences between the consistency measured by the Pseudo-R2 and the number of significant co-efficients. The highest Pseudo-R2 and at the same time the lowest number
of significant effects are found in the fifth sequence. The respondents were seemingly reaching a higher consistency by using a heuristic to simplify their ratings. One could challenge these results in regard to the fact that they
Figure 4: Number of significant coefficients and Pseudo-R2in the six phases of the vignette module
were caused by the specific split into six parts, but the findings remained stable with alternative splits.10
In the further part of the analysis we take a look at the differences be-tween age and education groups. The previous analysis showed that both measures have to be taken into account, on the one hand the Pseudo-R2and
on the other hand the number of significant coefficients. We estimated multi-nomial Logit-Models by age and educational group and report the model fits in Table 9.11 The results for the educational groups show that respondents with higher secondary degree produced slightly higher Pseudo-R2 values
10
PseudoR2-values for a split in two halves were: .35 and .37; the numbers of significant coefficients were: 20 and 18. Additional analyses with three groups also showed that the number of significant dimensions decreased during the response process while the R2 -values increased. The different numbers of significant coefficients could also result from differently strong correlations between independent variables (due to different ‘efficient’ vignette samples). However, correlations and variances of the vignette variables differed only slightly between the phases.
11
One has to take into consideration that the number of observations differed in each education group. To avoid interference, we drew ten random samples of a size ofN= 245 out of the respondents with lower and middle secondary degree. We proceeded the same way in the case of the age groups. The table reports the respective means of these samples.
than the other two groups (.38 with respect to .37 (Realschule) and .35 (Hauptschule)) with their ratings. The number of significant coefficients varied inversely to education levels. Regression models of respondents with higher secondary degree found 16.0 significant coefficients, and 17.6 (Re-alschule), and 17.9 (Hauptschule) for the other groups. For both measures of respondent behavior there were only small differences between the groups. For the three age groups we found that respondents of the middle group achieved the highest Pseudo-R2(.37) in comparison to the younger (.36) and the older (0.35) respondents. The differences were, however, small. There were no considerable differences in the number of significant coefficients. The regression for the youngest group showed 22.0 significant effects, for the middle group 18.4 and the oldest group 14.7. This could be a hint for a cognitive overburden in the older group.12 Further analyses for each of the six phases indicated relatively constant response behavior regarding significant coefficients and model fit in this age group (not displayed). We found differences in the number of significant effects between age groups but we cannot conclude that this is a fatigue effect rather than a result of different substantive justice evaluations.
Table 9: Model fit and number of significant coefficients by education and age
Respondent group Pseudo-R2 No. of sig. coeff. N
Educational group
Lower sec. school (Hauptschule) .35 17.9 245 Middle sec. school (Realschule) .37 17.6 245 Higher sec. school (Abitur) .38 16.0 245 Age group
16 to 39 years .36 22.0 303
40 to 65 years .37 18.4 303
over 65 years .35 14.7 303
The analysis of the consistency of ratings shows that the response fit may not only be measured by goodness of fit values. Respondents who take fewer dimensions into account may also reach high Pseudo-R2 values.
12
An alternative explanation could be that the dimensions were substantively unim-portant for the evaluations of respondents of this group.
5
CONCLUSIONS
This paper described the factorial survey and its implementation in the SOEP-Pretest 2008. The vignette module consisted of 24 vignettes with ten dimensions each. Respondents expressed their evaluations of justice by using a three step rating procedure. Afterwards, interviewers and respondents provided comments and assessments about difficulty and comprehensiveness of the evaluation task. To sum up and interpret the findings:
Respondents’ comments: Some respondents mentioned that the vignettes were sometimes unrealistic and that the vignette module was too long. Open comments like these can in general be useful in pre-tests to adjust the fac-torial survey module if necessary. The comments mentioned here provide a hint for possible method effects. Auspurg et al. (2010) show that there could occur methodological problems when respondents evaluate vignettes and single dimensions as unrealistic, because they tend to fade out the di-mension in later judgments. Sauer et al. (2011) show that factorial surveys consisting of many vignettes per respondent (above 20) can lead to fatigue effects and therewith inconsistent rating behavior during the course of eval-uations.
Interviewers’ assessments: According to the interviewers, there were dif-ferences in the comprehension of the task and the willingness to answer in different age groups and educational groups. The association between comprehension and age group was stronger than the association between comprehension and educational group. The associations are similar for the willingness to answer. So, this could be a hint for some education and in particular age effects. However, the patterns were similar to those for the whole questionnaire meaning that there did not occur instrument-specific effects. This is an argument for the applicability of factorial surveys in gen-eral surveys, although one should avoid to use complex vignettes (cf. Sauer et al., 2011) in heterogeneous respondent samples.
Response behavior: The average processing time to evaluate the task was similar between age and educational groups. This is in line with other findings in the literature (cf. Sauer et al., 2011). The three step rating task used here did not work as it was supposed. Respondents used frequently the category “just,” which indicates that they wanted to avoid the complex eval-uation task. Moreover, respondents used mostly round numbers, therefore a scale with fewer values would have been sufficient. Additionally, ceiling
effects occurred. The recommendation from this analysis would be to avoid the use of very fine grained rating scales, at least in general respondent sam-ples. The analysis of the consistency of judgments shows that respondents may also produce consistent judgments measured by goodness of fit values by fading out some dimensions. So, these values are not sufficient to detect respondents’ heuristics used to simplify the task.
The analyses show that method problems can occur when using the factorial survey method in general surveys. Therefore, the vignettes’ com-plexity and rating task have to be adjusted to the target population. The limitations of the analyses presented here are that they are based on non-experimental data. Experimental variations in the vignette module would allow to test differing rating patterns in response to, for instance, different levels of complexity or different answering scales (for studies using exper-imental splits to test method effects, see Auspurg, Hinz, & Liebig, 2009, Auspurg et al., 2010, Sauer et al., 2011). Nevertheless, the data provide important insights for the capability of the factorial survey carried out in heterogeneous respondent samples. All in all, the analyses show evidence that most respondents in heterogeneous samples are able to cope with the complexity of factorial surveys.
6
REFERENCES
Alves, W. M. (1982). Modeling distributive justice judgments. In P. H. Rossi & S. L. Nock (Eds.), Measuring social judgments. The factorial survey approach (pp. 205-234). Beverly Hills: Sage.
Alves, W. M., & Rossi, P. H. (1978). Who should get what? Fairness judg-ments of the distribution of earnings. American Journal of Sociology, 84(3), 541-564.
Auspurg, K., & Abraham, M. (2007). Die Umzugsentscheidung von Paaren als Verhandlungsproblem. K¨olner Zeitschrift f¨ur Soziologie und Sozialpsy-chologie, 59(2), 271-293.
Auspurg, K., Abraham, M., & Hinz, T. (2009). Die Methodik des fakto-riellen Surveys in einer Paarbefragung. In P. Kriwy & C. Gross (Eds.), Klein aber fein! Quantitative empirische Sozialforschung mit kleinen Fallzahlen (pp. 179-210). Wiesbaden: VS.
Auspurg, K., Hinz, T., & Liebig, S. (2009). Komplexit¨at von Vignetten, Lerneffekte und Plausibilit¨at im Faktoriellen Survey. Methoden, Daten, Analysen, 3(1), 59-96.
Auspurg, K., Hinz, T., Liebig, S., & Sauer, C. (2010). Wie unplausibel darf es sein? Der Einfluss von Designmerkmalen auf das Antwortver-halten in Faktoriellen Surveys. In H.-G. S¨offner (Ed.), Unsichere Zeiten. Kongressband zum 34. DGS Kongress der Deutschen Gesellschaft f¨ur Soziologie in Jena 2008. Wiesbaden: VS [CD-ROM].
Auspurg, K., & J¨ackle, A. (2012). First equals most important? Order effects in vignette-based measurement. ISER Working Paper Series. Institute for Social and Economic Research. Essex.
Barrera, D., & Buskens, V. (2007). Imitation and learning under uncer-tainty: A vignette experiment. International Sociology, 22(3), 367-396. Beck, M., & Opp, K.-D. (2001). Der faktorielle Survey und die Messung von Normen. K¨olner Zeitschrift f¨ur Soziologie und Sozialpsychologie, 53(2), 283-306.
Berk, R. A., & Rossi, P. H. (1977). Prison reform and state elites. Cam-bridge, Mass.: Ballinger.
D¨ulmer, H. (2001). Bildung und der Einfluss von Argumenten auf das moralische Urteil. Eine empirische Analyse zur moralischen Entwick-lungstheorie Kohlbergs. K¨olner Zeitschrift f¨ur Soziologie und Sozialpsy-chologie, 53(1), 1-27.
D¨ulmer, H. (2007). Experimental plans in factorial surveys: Random or quota design? Sociological Methods & Research, 35(3), 382-409. Hermkens, P. L. J., & Boerman, F. A. (1989). Consensus with respect
to the fairness of incomes: Differences between social groups. Social Justice Research, 3(3), 201-215.
Hinz, T., & Abraham, M. (2005). Theorien des Arbeitsmarktes: Ein ¨
Uberblick. In M. Abraham & T. Hinz (Eds.), Arbeitsmarktsoziologie. Probleme, Theorien, empirische Befunde (pp. 17-68). Wiesbaden: VS. Jann, B. (2008). Lohngerechtigkeit und Geschlechterdiskriminierung.
Ev-idenz aus einem Vignetten-Experiment. In B. Jann (Ed.), Erwerbsar-beit, Einkommen und Geschlecht. Studien zum Schweizer Arbeitsmarkt (pp. 107-126). Wiesbaden: VS.
Jasso, G. (1978). On the justice of earnings: A new specification of the justice evaluation function. American Journal of Sociology, 83(6), 1398-1419.
Jasso, G. (1994). Assessing individual and group differences in the sense of justice: Framework and application to gender differences in the justice of earnings. Social Science Research, 23(4), 368-406.
Jasso, G. (2006). Factorial survey methods for studying beliefs and judg-ments. Sociological Methods & Research, 34(3), 334-423.
Jasso, G. (2007). Studying justice: Measurement, estimation, and analysis of the actual reward and the just reward. In K. T¨ornblom & R. Vermunt (Eds.), Distributive and procedural justice (pp. 225-254). London, UK: Ashgate.
Jasso, G., & Meyersson Milgrom, E. M. (2008). Distributive justice and CEO compensation. Acta Sociologica, 51(2), 123-143.
Jasso, G., & Opp, K.-D. (1997). Probing the character of norms: A fac-torial survey analysis of the norms of political action. American Socio-logical Review, 62(6), 947-964.
Jasso, G., & Rossi, P. H. (1977). Distributive justice and earned income. American Sociological Review, 42(4), 639-651.
Jasso, G., & Webster, M. J. (1997). Double standards in just earnings for male and female workers. Social Psychology Quarterly, 60(1), 66-78. Jasso, G., & Webster, M. J. (1999). Assessing the gender gap in just
earnings and its underlying mechanisms. Social Psychology Quarterly, 62(4), 367-380.
Kapteyn, A., Smith, J. P., & v. Soest, A. (2013). Are Americans really less happy with their incomes? Review of Income and Wealth, 59(1), 44-65.
Kuhfeld, W. F. (2005). Experimental design, efficiency, coding, and choice designs. In W. F. Kuhfeld (Ed.), Marketing research methods in SAS: Experimental design, choice, conjoint, and graphical techniques (pp. 47-97). Cary, NC.
Kuhfeld, W. F., Tobias, R. D., & Garrett, M. (1994). Efficent experimen-tal design with marketing research applications. Journal of Marketing Research, 31(4), 545-557.
Liebig, S., & Mau, S. (2005). Wann ist ein Steuersystem gerecht? Zeitschrift f¨ur Soziologie, 34(6), 468-491.
Liebig, S., & Schupp, J. (2005). Empfinden die Erwerbst¨atigen in Deutsch-land ihre Einkommen als gerecht? DIW-Wochenbericht, 48/2005, 721-725.
Liebig, S., & Schupp, J. (2008a). Immer mehr Erwerbst¨atige empfinden ihr Einkommen als ungerecht. DIW Wochenbericht, 31/2008, 434-440. Liebig, S., & Schupp, J. (2008b). Leistungs- oder Bedarfsgerechtigkeit?
¨
Uber einen normativen Zielkonflikt des Wohlfahrtsstaats und seiner Be-deutung f¨ur die Bewertung des eigenen Erwerbseinkommens. Soziale Welt, 59(1), 7-30.
Long, J. S. (1997). Regression models for categorical and limited dependent variables. Thousand Oaks, London and New Delhi: Sage.
Long, J. S., & Freese, J. (2006). Regression models for categorical depen-dent variables using Stata. College Station, Texas: Stata Press.
M¨as, M., M¨uhler, K., & Opp, K.-D. (2005). Wann ist man Deutsch? Empirische Ergebnisse eines faktoriellen Surveys. K¨olner Zeitschrift f¨ur Soziologie und Sozialpsychologie, 57(1), 112-134.
Miller, J. L., Rossi, P. H., & Simpson, J. E. (1986). Perceptions of justice: Race and gender differences in judgment of appropriate prison sentences. Law & Society Review 20(3), 313-334.
Mutz, D. C. (2011). Population-based survey experiments. Oxford: Prince-ton University Press.
Rossi, P. H. (1979). Vignette analysis: Uncovering the normative structure of complex judgments. In R. K. Merton, J. S. Coleman & P. H. Rossi (Eds.), Qualitative and quantitative social research: Papers in honour of Paul F. Lazarsfeld (pp. 176-186). New York: Free Press.
Rossi, P. H. & Anderson, B. (1982). The factorial survey approach: An introduction. In P. H. Rossi & S. L. Nock (Eds.), Measuring Social Judgments (pp. 15-67). Beverly Hills: Sage.
Rossi, P. H., & Nock, S. L. (Eds.) (1982). Measuring social judgements: the factorial survey approach. Beverly Hills: Sage.
Sauer, C., Auspurg, K., Hinz, T., & Liebig, S. (2011). The application of factorial surveys in general population samples: The effects of respon-dent age and education on response times and response consistency. Survey Research Methods, 5(3), 89-102.
Schaeffer, N. C., & Bradburn, N. M. (1989). Respondent behavior in magnitude estimation. Journal of the American Statistical Association, 84(406), 402-413.
Schulte, A. (2002). Consensus versus disagreement in disease-related stigma: A comparison of reactions to AIDS and cancer patients. Sociological Perspectives, 45(1), 81-104.
Siegel, N. A., Stocker, A., & Warnholz, S. (2009). SOEP Testerhebung 2008: Pers¨onlichkeit, Gerechtigkeitsempfinden und Alltagsstimmung. Methodenbericht. M¨unchen: TNS Infratest Sozialforschung.
Steenkamp, J.-B., & Wittink, D. R. (1994). The metric quality of full-profile judgements and the number-of-attribute-levels-effect in conjoint analysis. International Journal of Research in Marketing, 11(3), 275-286.
Steiner, P. M., & Atzm¨uller, C. (2006). Experimentelle Vignettendesigns in Faktoriellen Surveys. K¨olner Zeitschrift f¨ur Soziologie und Sozialpsy-chologie, 58(1), 117-146.
Struck, O., Stephan, G., K¨ohler, C., Klause, A., Pfeifer, C., & Sohr, T. (Eds.) (2006). Arbeit und Gerechtigkeit: Entlassungen und Lohnk¨ urz-ungen im Urteil der Bev¨olkerung. Wiesbaden: VS Verlag.
Teas, R. K. (1987). Magnitude scaling of the dependent variable in decom-positional multiattributive preference models. Journal of the Academy of Marketing Science, 15(3), 64-73.
Thurman, Q. C., Lam, J. A., & Rossi, P. H. (1988). Sorting out the cuckoo’s nest: A factorial survey approach to the study of popular conceptions of mental illness. The Sociological Quarterly, 29(4), 565-588.
Wallander, L. (2009). 25 years of factorial surveys in sociology: A review. Social Science Research, 38(3), 505-520.
Wegener, B. (1978). Einstellungsmessung in Umfragen: Kategorische vs. Magnitude-Skalen. ZUMA-Nachrichten, 2(3), 3-27.
Wegener, B. (1985). Gibt es Sozialprestige? Zeitschrift f¨ur Soziologie, 14(3), 209-235.
7
APPENDIX
Table 10: Correlations of the Vignette Dimensions
Dimension (1) (2) (3) (4) (5) (6) (7) (8) (9) (1) Sex 1.000 (2) Age .008 1.000 (3) Voc. training .005 -.030 1.000 (4) MPS .028 .020 .251 1.000 (5) Gross earnings -.007 .014 .128 .586 1.000 (6) Performance .001 .003 .008 -.008 -.009 1.000 (7) Econ. sit. comp. .018 .014 .020 .035 .044 .008 1.000 (8) Company size .017 -.010 -.010 -.005 -.022 -.043 .003 1.000 (9) Marital status -.000 .021 -.037 -.036 -.021 .024 .004 .012 1.000 (10) Children .011 .008 -.011 .018 -.005 -.056 -.021 .017 .000