Software Product Line and Configurable Business Processes
BARDIA MOHABBATI, Simon Fraser University, Canada
DRAGAN GA ˇSEVI ´C, Simon Fraser University, Athabasca University, Canada MAREK HATALA, Simon Fraser University, Canada
HAUSI A.M ¨ULLER, University of Victoria, Canada
Quality evaluation is a challenging task in monolithic software systems. It is even more complex and com-plicated when it comes to Service-Oriented Software Product Lines (SOSPL). In SOSPL, variability can be planned and managed at the architectural level to develop a software product with the same set of func-tionalities but different degrees of quality levels. A large variant space of both functional and non-functional (quality) properties provided by a product-line (or a family of services) complicates the measurement and op-timization of quality aspects. Therefore, architectural quality evaluation becomes crucial due to the fact that it allows analyzing the potential of architecture to meet the required quality levels and validate whether the final product satisfies and guarantees all the ranges of quality requirements within the envisioned scope. This paper addresses the open research problem of aggregating quality ranges with respect to architectural variability. Previous solutions for quality aggregation do not consider architectural variability for composite services. Our approach introduces variability patterns that can possibly occur at the architectural level of an SOSPL. We propose a quality model for SOSPL and configurable business process models, and an ag-gregation method for quality range computation which takes both variability and composition patterns into account.
Categories and Subject Descriptors: D.2.4 [Software Engineering]: Reusable Software, Reuse models General Terms: Design, Algorithms, Performance
Additional Key Words and Phrases: Service-Oriented Software Product Line, Service-Oriented Architecture, Quality-of-Service, Configurable Process Models
ACM Reference Format:
Bardia Mohabbati, Dragan Gaˇsevi´c, Marek Hatala, Hausi A. M ¨uller, 2013. A Quality Model and Evalua-tion Method for Service-Oriented Software Product Line and Configurable Business Processes.ACM Trans. Softw. Eng. Methodol., , Article (September 2013), 36 pages.
DOI:http://dx.doi.org/10.1145/0000000.0000000 1. INTRODUCTION
Service-Oriented Architecture (SOA) is becoming major paradigm to build versatile and distributed systems, that enables the realization of Software-as-a-Service. Al-though various stakeholders (e.g., companies and/or individual software developers) can employ services as the building blocks of their target application, in reality, they
This work is a revised and extended version of a paper published in Proceedings of the 9th International Conference on Service-Oriented Computing (ICSOC2011), Paphos, Cyprus, December 5-8, 2011.
Author’s addresses: Bardia Mohabbati, Dragan Gaˇsevi´c, and Marek Hatala, Simon Fraser University, 13450 102 Ave. Surrey, Canada; emails: mohabbati,dgasevic,[email protected]; Dragan Gaˇsevi´c is also with Athabasca University, 1 University Drive Athabasca, Canada; and Hausi A. M ¨uller, University of Victoria, STN CSC Victoria, P.O. Box 3055, Canada; email: [email protected].
Permission to make digital or hard copies of part or all of this work for personal or classroom use is granted without fee provided that copies are not made or distributed for profit or commercial advantage and that copies show this notice on the first page or initial screen of a display along with the full citation. Copyrights for components of this work owned by others than ACM must be honored. Abstracting with credit is per-mitted. To copy otherwise, to republish, to post on servers, to redistribute to lists, or to use any component of this work in other works requires prior specific permission and/or a fee. Permissions may be requested from Publications Dept., ACM, Inc., 2 Penn Plaza, Suite 701, New York, NY 10121-0701 USA, fax+1 (212) 869-0481, or [email protected].
c
2013 ACM 1049-331X/2013/09-ART $15.00
often have dissimilar requirements from each other, resulting in the need for consider-ation of different features in the final product. This, along with the importance of sus-taining market changes, necessitates mechanisms for the rapid development of soft-ware systems that best meet the stakeholders’ feature needs. Some service providers have already moved towards the adoption ofcustomizable product-development models
(i.e., configurable business process models) to efficiently tailor solutions for their stake-holders. Within this process, they need to consider, manage and withstand both vari-able functional and non-functional (quality) requirements to systematically produce new applications.Software Product Line Engineering (SPLE)provides approaches to develop and maintain a family of products based on common aspects and predicted variabilities that allow rapid configuration and customization of new products. Sev-eral researchers have proposed to integrate SOA and SPLE paradigms into Service-Oriented Software Product Lines (SOSPL)as a way to achieve customizable product-development and take the benefits and synergies of both paradigms [Mohabbati et al. 2013b]. Researchers have explored various strategies for the realization of software applications, e.g., how the most appropriate services can be selected and how they can be efficiently composed for adaptable process models [Alrifai et al. 2012; La Rosa et al. 2011; Gottschalk et al. 2008; Cardellini et al. 2009; Ardagna and Pernici 2007; Zeng et al. 2004]. However, previous works often fails to consider Quality-of-Service (QoS) in the context of SOSPL and particularly for configurable business process models.
Form stakeholders’ point of view, the quality characteristics (attributes) can be mandatory or optional with different levels of importance. Quality characteristics can be impact of variation in functional features. The influence of functional variable fea-tures on quality characteristics is complex and difficult to identify and measure. Be-cause one variable feature of a service product family may be influenced by several quality properties required by stakeholder or one quality dimension may be affected by several variable features. It is necessary to identify and measure diverse impact of functional variable features on a quality attribute. These play a key role in assessing the quality characteristics for an SOSPL, which imposes heavy human effort for the evaluation.
Furthermore, to evaluate the potential quality of the developed service-oriented ap-plications, it is essential to consider constraints and quality restrictions of individual services and overall requirements. Because some QoS dimensions values may vary during the service life-cycle. In consequence, the aggregation of quantified quality val-ues is a prerequisite for composite service to assure and verify if the QoS expectations of stakeholder are satisfied.
Quality evaluation is a challenging task in monolithic software systems, and is even more complex when it comes to SOSPL, as it requires to analyze the quality charac-teristics of a family of SOA systems by considering variations in both functional and non-functional properties. Moreover, quality evaluation is an essential part of the op-timization and configuration of product-line, because it provides a quantitative metric for the quality of the system based on architecture specification [Aleti et al. 2013]. In SOSPL, architectural quality evaluation becomes crucial as it allows the examination of whether the final service product satisfies and guarantees the ranges of quality re-quirements within the envisioned scope of the product line. This paper contributes a solution to the following open research problem: How can the quantifiable values of quality dimensions of a service family be aggregated with respect to architectural vari-ability?
The novelty of our approach is in accounting for variability during architecture qual-ity aggregation, which has not been considered in any related work, to the best of our knowledge. Our work focuses on the development of a framework for computing the quality ranges of features in an SOSPL by aggregating quality properties at the
archi-tectural level. This paper is revised and extended from its preliminary version [Mohab-bati et al. 2011a] in which we proposed quality aggregation method based on structural variability and composition patterns in business processes models. We introduced a set of possible variability patterns that occur at the architectural level of an SOSPL. This can be seen as a catalog of patterns for variability may occur in the structure of business process models expressing composite services. Moreover, we provided the for-malization of a computational model for architectural quality evaluation, which takes into account both variability and composition patterns and allows for trade-off anal-ysis and architectural decision-making among options that provide similar functional properties but different quality levels. In particular, this paper makes the following additional contributions:
(1) We introduced an extensible multidimensional QoS model to captures non-functional properties that are inherent to an SOSPL.
(2) We developed aquality model frameworkfor holistic architectural quality evalua-tion based on different architectural patterns.
(3) We conducted sets of experiments based on real-data and synthesized data sets for performance analysis of proposed QoS aggregation method.
The rest of this paper is organized as follow: Section 2 describes related concep-tual modeling and formalism for configurable business process model in the context of SOSPL. The proposed QoS model is reviewed in Section 3. Section 4 describes and exemplifies the QoS aggregation and computation method. The evaluation of method is presented in Section 5. The related work is discussed in Section 6. Finally, Section 7 presents the conclusion and future work.
2. SERVICE-ORIENTED SOFTWARE PRODUCT LINES AND CONFIGURABLE BUSINESS PROCESSES
SPLE has been recognized as a successful approach for the variability management and reuse engineering, which enables mass customization, enhances software quality and reduces the time-to-market of new software products [Pohl et al. 2005]. Differ-ent software products derived from a software product line are distinguishable based on their included features. Afeaturereflects the stakeholders’ requirements. It is an increment in the product functionality and offers a configuration option [Pohl et al. 2005]. Given this definition for a feature, SPLE relies on the essential concepts of com-monalityandvariabilityof features among products.
SPLE consists of two main lifecycles: Domain Engineering and Application Engi-neering [Pohl et al. 2005]. Domain Engineering is concerned with the analysis and identification of the scope of the product line and the capturing of the entire domain of interest through modeling of common and variation points. An Application Engineer-ing cycle builds the understandEngineer-ing of specific requirements of different stakeholders, for whom the customization and configuration of the product line is carried out. We have presented the details of these two distinctive lifecycles in [2013a; 2011b].
Given that software product line models are often abstract representations of a do-main/application of interest, it is important that they are interrelated with solution space models that would allow their actual operationalization. To this end, many re-searchers and practitioners have already investigated the importance of leveraging the synergies between SOA and SPL to create Service-Oriented Software Product Lines (SOSPLs) [Mohabbati et al. 2013b; Cohen and Robert 2010; Lee and Kotonya 2010]. Such approaches benefit from SOA principles to provide an actual implementation of SPL products. Accordingly, SPLE helps to develop variant-rich service products and enable reuse and optimization with business process through commonality and vari-ability management. Let us review an illustrative example in this regard.
2.1. Illustrative Example
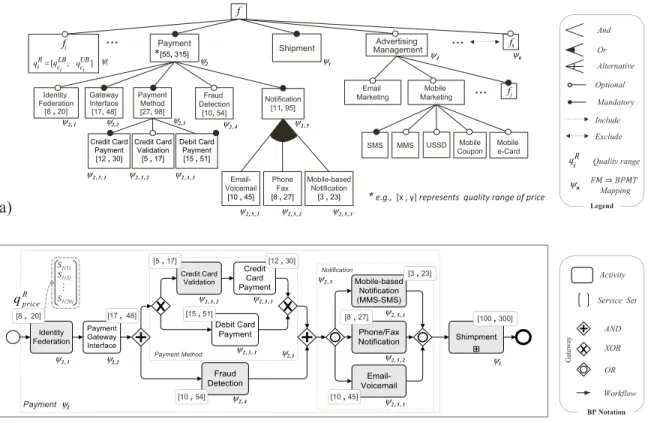
We focuses on the simplified business process model for payment service of our case study in a global online retailer scenario to illustrate the concepts and further dis-cussions in this paper. Figure 1 (a) illusterates a feautre model representing com-monalities and variabilities in a configurable process model of payment service (See Figure 1(b)). The feature model focuses on the structural relationships and the con-figuration dependencies between features, and it is used to distinguish products of a product line of services and guide the configuration of a reference process model.
As shown, different features from the feature model (on the top) can be used within the business process model (on the bottom) to provide different functionalities of the payment service as a composite service. These features can be realized using appropri-ate services, which can have different QoS characteristics. The activities represented in gray color in the process model indicate optional features; i.e., those features can be optionally included or excluded from the target product based on stakeholders’ re-quirements. For instance, theNotificationfeature can be included in a final service-product by selecting one of the Mobile-based notification, Phone-Fax notification, or Email/Voicemail notification features, which have different range of quality values, since they are implemented by different services. Hence, the QoS characteristics of a developed product are closely dependent upon the features that get included in a final product. Notification [11,95] Credit Card Validation [5 ,17] Debit Card Payment [15 ,51] Payment Method [27,98] Advertising Management
(a)
Fraud Detection [10,54] Payment [55,315] Credit Card Payment [12 ,30] Email-Voicemail [10 ,45] Phone Fax [8 ,27] Mobile-based Notification [3 ,23] Identity Federation [8 ,20] Gateway Interface [17,48] k f f...
i f Shipment Email Marketing Mobile Marketing Mobile e-Card SMS MMS Mobile Coupon j f...
...
[10, 54] [15 ,51] [5, 17] [12 ,30] [17 ,48] S1(1) S1(2) .. . S1(20)(b)
[100 , 300] R price q [ , ] i i R LB UB i c c q q q Payment Payment Method USSD [8 ,20] And Or Alternative Optional Mandatory Legend Include Exclude Notification [10, 45] [8, 27] [3, 23] R i q Quality range Mapping i 2 , 5 2 2 , 4 2 , 3 , 1 4 3 k 2 , 1 2 , 2 2 , 3 2 , 3 , 2 2 , 3 , 3 2 , 5 , 1 2 , 5 , 2 2 , 5 , 3 2 2 , 1 2 , 2 2 , 3 2 , 4 2 , 5 2 , 5 , 1 2 , 5 , 2 2 , 5 , 3 3 2 , 3 , 1 2 , 3 , 2 2 , 3 , 3*e.g., [x , y] represents quality range of price * Gateway AND OR XOR BP Notation Service Set Activity Workflow n
Fig. 1. a) Feature model representing structural variability in business process family b) payment feature and its process model.
A feature model such as the one in Figure1 (a) is a model of a family of payment process, which in turn represents a configurable SaaS, while each variant (configured service) is a member of that family. As we discussed, variation points are considered those places in the design of a configurable process model. However, the options to be selected for a particular application w.r.t. stakeholders’ requirements are left open for the configuration. Hence, variation points provide the possibility to derive different products, i.e., different final composite services. In SOSPL, particularly during the do-main engineering cycle, determining the implied QoS ranges for individual features, based on the underlying architecture and implementation, helps domain engineers ensure that the product line architecture will fulfill and deliver the upper and lower bounds or values of quality requirements requested by stakeholders. In other words, the aggregation of the QoS characteristics of a feature model based on the quality of its features, as derived from underlying processes and services implementing those features, provides the means to estimate the likely lower and upper bounds of QoS properties for potential service products that will be derived from that product family. In addition, in the context of SOSPL, quality range computation through the construc-tion of a generic evaluaconstruc-tion model enables us to keep track of the product line quality ranges even during or after specifications of the service quality have changed. In next sections, we describe our proposed approach how these QoS ranges are computed in the presence of variability.
2.2. Reference and Configurable Process Model
Today, software products as services are designed, built, executed, maintained and evolved by means of business processes on top of Web services technologies [Dumas et al. 2012; Ouyang et al. 2009]. A template-based approach, where a reference model is designed as a template and is further configured or customized for various purposes, has been widely adopted by practitioners [Czarnecki 2005]. for the entire product line in a superimposed way. The reference model provides the common business logic for orchestration and choreography of services.
The configuration (tailoring and customization) of a reference models is performed by the selection/elimination of features from the feature model. In other words, due to the fact that architectural variations in the reference model are encoded as fea-tures, the various parts of the reference business processes are organized into varia-tion points, which are managed and configured by means of feature models. Feature models capture and encapsulate only architectural variability at design time. In con-trast, business process models describe behavioral variability, i.e., how features are composed, which drives runtime variability through composition patterns (discussed in the next section).
As mentioned earlier, complex software application can be build out of composite services. A service can be modeled as a software component with a well-defined inter-face that implements a set of operations offering piece of functionality. A (business) process model describescomposition logicdefining workflow (i.e., control flow) of a set of ordered activities and their transitions (also called service activity) which realize and implement features of software w.r.t. stakeholders requirements model. It enables services to be composed at the different levels of granularity and dictates how services can be combined, synchronized, and co-ordinated.
We refer to reference process model as an abstract representation of all valid ser-vice compositions in a family of business processes. We assume hat a reference pro-cess model, as a higher level of compositions, is generated by template-based and parametric-design-based approaches. A reference process modelPM consists of a set
of interrelated abstract activities A={a1, . . . , an} and their data dependencies
(in-puts, out(in-puts, pre- and post-conditions (i.e., effects) according to regarded workflow structures. An activityaj represents a well-defined business function, as a functional
abstraction of a service providing implementation (i.e., operationalization) for feature
fj. Hence, an activity can be atomic (e.g., atomic service) or non-atomic (i.e.,
compos-ite service). Each activity is delegated to one or more concrete services providing the required functionality with different range of quality, e.g., in terms of cost and perfor-mance. We formally define a process model as follows:
Definition2.1 (Process Model). A process model PM is modeled as a directed acyclic graph GPM= (V, E), where V ={V, Vσ, VA, VG} denotes a set of disjoint nodes, V andVσ are set of initial and final nodes, respectively.VA is a set of activities, and
E ⊆V×V represents the workflow (transitions) between the nodes.VGis a set of nodes
as gateways. A gateway has a typeT(VG)such thatT(VG)∈ {AND, OR, XOR, DISC}. Gateways, as routing constructs, represent a workflow of branching (i.e., routing points), and workflow patterns [Van Der Aalst et al. 2003] describe the structure and behavior of processes for the execution. Workflow patterns are defined in terms of how the process flow proceeds in sequences and splits into branches to execute the activities and how they converge.
To model and support peculiar characteristics of process models and stakeholder’s requirements, the specifications of process model are enriched by semantic annota-tions. We assume the execution probability of every conditional branching i.e., switch (XOR-split), are specified by annotations. Therefore, for each gateway with conditional branching with k disjoint branchesPk
i=1ρ b
i = 1, whereρbi indicates the probability of
execution of ith branch. Furthermore, loop constraints in a process model can be de-fined to express the number of iterations for particular activity. Hence, the probability distribution of every loop with maximum number of iterationscis specified such that
Pc i=0ρ
l
i = 1, whereρli indicates the probability that loopl executed is itimes. We
as-sume there is an upper bound c for the loopl is determined. Otherwise, the process further cannot be optimized because infinitive resources might be required for execu-tion. The distribution of probabilities of execution of conditional branches and loops are specified during design-time or available and evaluated from past executions and captured by systems logs or service brokers [Zeng et al. 2004].
To describe a set of functionally equivalent services with different QoS, we define service candidate set denoted asSai for each activityai implementing and executing
featurefi. Given the above consideration, a set ofSn
i=1Saiincludes binding links to
ser-vices providing multiple implementations fornactivities in a reference process model. The best services for each activity is further selected by optimization process accord-ing to required QoS constraints specified by stakeholder. Selected services are invoked at run-time by dynamic/late binding mechanism. The information about services is managed by a service broker.
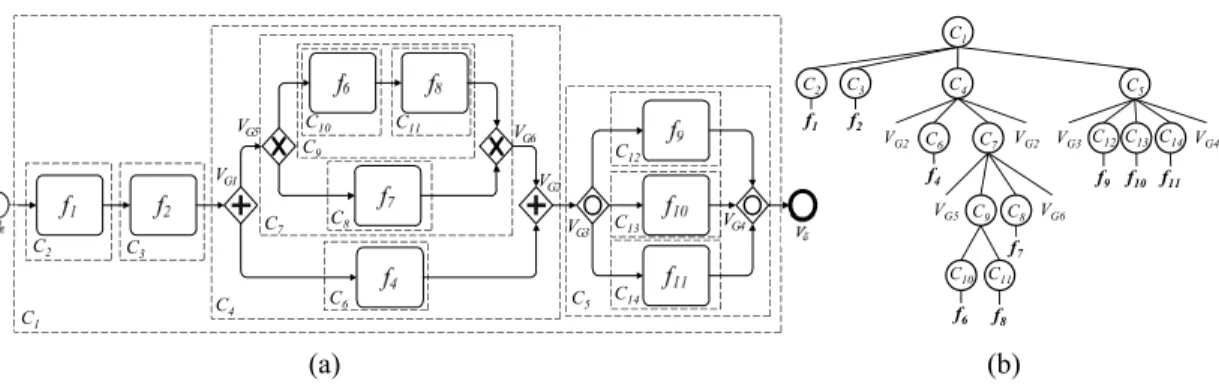
In this work, we consideredstructured process modelswhich have a number of desir-able properties [Polyvyanyy 2012; Kiepuszewski et al. 2000]. A process model is called to be structured if it has following properties: (1) the soundness property of process model can be checked in polynomial time. A process model with no structural errors such as deadlocks or lack of synchronization [Sadiq and Orlowska 2000] is called to be sound [Aalst et al. 2002], and (2) it has the properties of modularity, readability and maintainability. The soundness of a structured process model can be analyzed by Petri net reachability graphs.
Process Structure Tree: To allow further analysis of activities and their
(PST). This concept is based on partitioning a process model into smaller fragments (regions or components) and structuring them in a hierarchical way according to the nesting relation. PSTs can be created using different algorithms. Our approach is based on method described in [Vanhatalo et al. 2007], which decompose process model into canonicalSingle-Entry-Single-Exit (SESE)regions. SESE regions are known from compiler theory and are utilized for control flow decompilation.
We consider (well-) structureness property of a process model [Polyvyanyy 2012; Kie-puszewski et al. 2000]. A process model is well-structured if and only if for every node with multiple outgoing arcs (i.e., a split), there is a corresponding node with multiple incoming arcs (a join), such that set of nodes between the split and the join forms SESE region. An structured process model can be decomposed into SESE regions [Vanhatalo et al. 2009], which can be computed in linear time (cf. [Johnson et al. 1994]). SESE regions are defined formally as as follow:
Definition2.2 (Single-Entry-Single-Exit Region). Let GPM be a process model graph with distinguished initial node and final node, such that every node is reach-able from initial node and final node is reachreach-able from every node inGBP. Two distinct nodesViandVjinGBP enclose aSingle-Entry-Single-Exit (SESE)regions if
(1) VidominatesVj, i.e., every path from initial node toVjincludesVi
(2) Vjpostdominates, i.e., every path fromVj to final includeVi
(3) every cycle containingVialso containsVj
We defineProcess Structure Tree (PST)as a hierarchical representation of a struc-tured process model according to Definition 2.1 and 2.2.
Definition2.3 (Process Structure Tree). Given a process model PM,P STPM= (V, E)
is a tree of canonical fragments ofGPM, whereV ={Vr, VR}is a finite set of nodes.Vr
is the root of tree.VR corresponds to canonical SESE regions.E ⊆ (VR×(VR\Vr)}is
the set of edges. Nodes are either activitiesVAor gatewaysVG.
2.3. Feature Model and Variability Patterns
As we mentioned earlier, feature model prolongs to support configuration framework in order to support dynamic deployment of variant business processes or enable con-figurable business process. A feature model is a means for describing a permissible configuration space of all the products of a service family in terms of its features and their relationships. Figure 1(a) depicts a part of the feature model in our example, which breaks down the variability and commonality of a product line of services into a hierarchy of features and represents structural variability in the reference process model. Parent-child relationships in the feature diagram indicate the refinement of ap-plication functionality. As not all features are assumed to be present in every product, this differentiation is expressed by a classification of feature types and relationships, which drivestructural variability patternsas follows:
— Mandatory/Optional:A mandatory feature must be included in every member of
a product line of services if its parent feature is selected. An optional feature may or may not be included if their parent is included;
— Or-group:Or-feature group is non-empty subsets of features that can be included
if a parent feature is included;
— Alternative-group: Alternative-feature group indicates that from a set of
alter-native features exactly one feature must be included if the parent of that set is included.
Variation points are those features that have at least one direct variable sub-feature (See Figure 1). It can be observed, except for the mandatory feature type, all the other types of features imply structural (architectural) variability.
A feature model can be expressed as a rooted directed acyclic graph (DAG). Fea-ture diagram, which is a tree-like graphical notation, is more widely used due to its visual appeal and easier understanding. In the tree-like structure, each node (feature) represents a variation or increment in application functionality. We formally define a feature model as follows:
Definition2.4 (Feature Model). A feature model FM is a directed acyclic graph
GFM= (VF, r, E, λ,)where
— VF={f1, . . . , fn}is a finite set of nodes representing features and theirs attributes;
— r∈VF is the root feature of feature model;
— DE⊆N×N is a set of decomposition edges representing the parent-child relations; — λ : P(f)→ N T ⊆ N×N is a function assigning feature types and cardinalities
for child features with parent feature f, where N T ∈ {f ,• f , f◦ or, fxor}. The • f andf◦
denote mandatory and optional parent-child feature relations, respectively;for and fxor denote Or and Alternative group relations between parent-child features with
common parents, respectively;
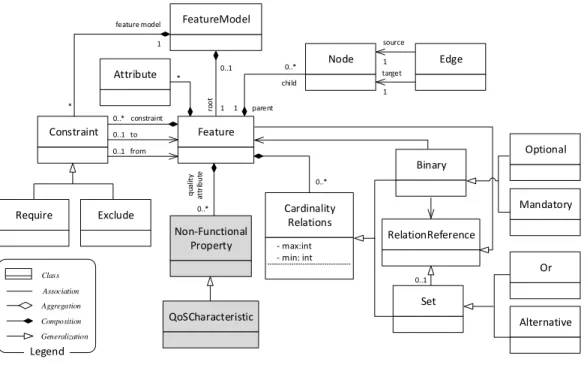
— CE⊆N×N is a set of constraints edges expressing the integrity constraints among features. Feature 1 ro o t 0..1 FeatureModel Constraint 0..* constraint Require Exclude 1 feature model * to 0..1 from 0..1 Attribute * Node 1 parent 0..* child Cardinality Relations - max:int - min: int Binary Mandatory Optional Set Alternative Or M1 M2 0..* M4 RelationReference Edge 1 target 1 source Non-Functional Property q ua lit y at tr ib u te 0..* QoSCharacteristic 0..1 Legend Class Association Composition Aggregation Generalization
Fig. 2. Meta model of extended cardinality-based feature model.
Figure 2 shows the meta model of cardinality-based feature model and the major constructs. A feature model with a root feature is composed by an optional set of rela-tions. The cardinality-based relations can be two distinctive types: “binary” relations
expressing optional and mandatory features, and “set” relations constructing grouped features.
In general,cardinalityspecifies reasonable interval for number of child-feature in a group of featuresF ⊆N×N, which is denoted by<k−k0>, where1≤k≤k0 ≤m, and
m=|F|. Hence,<k−k0>cardinality defined overOr feature groups indicates at least
kand at mostk0 features that can be included out of themfeatures in a group if the
parent is selected. Moreover, the <k−k>cardinality specified for Alternative feature groupsimplies that onlykout ofmfeatures in the group must be included if the parent is selected. The concept of cardinality also emulates four types of decomposition for features in a group as follows:<m−m>,<0−m>,<1−m>, and<1−1>specifies the mandatory, optional, Or, and Alternative features/groups, respectively.
A feature and corresponding service may depend on other features for its correct functioning or operation. Therefore, operational dependencies among features can be defined by constraints which are known as integrity constraints (or cross-tree con-straints) [Lee and Kang 2004]. For instance, a feature can refer to another feature that itrequires(includes) orexcludes. Therefore, the presence of a certain feature in the product may impose the presence or exclusion of another feature. Integrity con-straints can be expresed and specified by the concon-straints edges in a feature model. Thereby, service designer can express implicitly or explicitly dependency among fea-tures.
We extendeded the conventional feature model to incorporatenon-functional proper-tieswhich can be further defined as qualitative or quantitative quality characteristics (See Figure 2). Thereby, each feature can comprise properties to include quality infor-mation. In SOA, non-functional properties can be viewed asQoS characteristics. In the next section we describe our proposed QoS model which describes quality characteris-tics and extends feature model.
3. QUALITY OF SERVICE MODEL FOR A SERVICE-ORIENTED SOFTWARE PRODUCT LINE ARCHITECTURE
This section introduces a QoS model and also provide the foundation for QoS aggrega-tion and computaaggrega-tion, and further quality-aware SOSPL configuraaggrega-tion.
3.1. Quality of Service Requirements and Criteria
In contrast to functional properties defining particular function or behaviour of a soft-ware system, non-functional (also known as extra-functional or quality) properties describe how well functionality of system is fulfilled. We discriminate between two general types of quality characteristic for a service-oriented software product line (ser-vice family): (1) the quality attributes which are specific to the product-line and are inherent to undertake a set of related products as we all new feature in terms of a ser-vice. Such those quality variability characteristics are related to functional variability causing variation in the quality of product-line members, and (2) the general quality or domain-specific quality characteristics, i.e., cost, performance, cost, safety, etc. We only consider general quality type for further quality aggregation and computation in this paper.
Existing standards on software product quality (e.g., ISO/IEC 9126-1 and updated version ISO/IEC 25010 [2010]) provide insight into general and common characteris-tics for almost every type of software. However, different types of software products have specific characteristics. Hence, the actual application of software quality mod-els usually requires reusing an existing quality model and extending it for a specific software product or domain. In SOC community, the “Quality of Service”, or QoS for short, are referred to as non-functional properties associated with a service, which are measured to evaluate the degree a service meets quality requested by
stakehold-ers [Menasc´e 2002]. These qualities are described in a Service Level Agreement (SLA) serving as the foundation for expressing non-functional requirements and the expected level of service between the consumer and provider.
The importance of QoS for SOA is due to the fact that service-oriented applications often use highly-distributed and loosely-coupled services over the network. These ser-vices may be invoked and executed by a variety of stakeholders in heterogeneous en-vironments. Accordingly, the modeling, describing and managing service quality are of utmost importance in all the SaaS life-cycle phases, requirements specification to design, deployment and execution monitoring.
3.2. QoS Model
The QOS model is utilized to define quality specifications and make explicit various characteristics and dimensions that specify the expectations on quality levels provided by service. The QoS model is used by service requesters (i.e., stakeholder) to express QoS requirements and preferences and by service providers to describe and advertise services QoS, determine the priority and relationships among QoS aspects that are used for further reasoning, decision-making, and service configuration and optimiza-tion.
In this section, we describe our proposed QoS model by following ontology-based approach which enables us to express QoS required for a SOSPL.
To end this, we firstly introduce primary general requirements and design crite-ria guiding to develop a QoS model. An extended review of number of existing QoS languages [Vedamuthu et al. 2007; Andrieux et al. 2005; Paschke 2005; Tosic et al. 2005; Ludwig et al. 2003], ontologies [Tran et al. 2009; Papaioannou et al. 2006; Kri-tikos and Plexousakis 2006; Ran 2003], and models [Jureta et al. 2009; Herssens et al. 2008; Toma et al. 2006; Wang et al. 2006; O’Sullivan et al. 2002] specified these gen-eral design requirements which is also summarized by Tran et al. [Tran et al. 2009] as follow. A QoS model should enable to conceptualize and express explicit specifications of QoS properties that can be applicable for various application domain. In addition, it should be extensible to define and include arbitrary QoS properties w.r.t. domain of interest. QoS model should support different participants (e.g., provider, stakeholder, third-parties, brokers, etc.) specifying quality information in details and requirements at different level of expectations. Quality information can be applied to different el-ements of an atomic or composite service (e.g., service operation, input/output, and interface). For product-line engineering, different types of quality variability can be identified: (a) variability among different quality properties, (b) different priority lev-els or preference on quality properties, and (c) indirect variation which is resulted in functional variability. Therefore, the QoS model should support to express stakeholder preferences, priority and conditions concerning QoS properties (e.g., mandatory and optional properties). Also, it should allow to describe the classification, relation and prioritization of quality aspects.
Our QoS model is based on the OMG UML QoS profile [SOC 2008] and extended version proposed by [Jureta et al. 2009], which conceptualizes various aspect of qual-ity and enables the definition of standard QoS modeling elements. We also considered existing QoS ontologies [Tran et al. 2009; Papaioannou et al. 2006; Kritikos and Plex-ousakis 2006; Maximilien and Singh 2004; Ran 2003]. The OMG UML profile and existing ontologies don not take preference into account to express the relative impor-tance of QoS for systems and stakeholders, which is perquisite and used for decision-making and reasoning over QoS properties and requirements.
The two important and conspicuous characteristics of our proposed QoS model are as follow: (1) it enables to define general and domain-specific quality aspects with their relations and allows to manage and group complex quality characteristics; and (2) the
model integrates the preference model that further enables to specify the quality rel-ative importance and preferential aspects required for multi-criteria decision-making and automatic configuration of service. In the following, we first overview the key con-cepts of the UML QoS profile (the details of meta model is available in [SOC 2008], and then we describe the extensions to the QoS meta model by accommodating the preference model with the aims at supporting decision-making and optimization in the course of process configuration, customization and service selection.
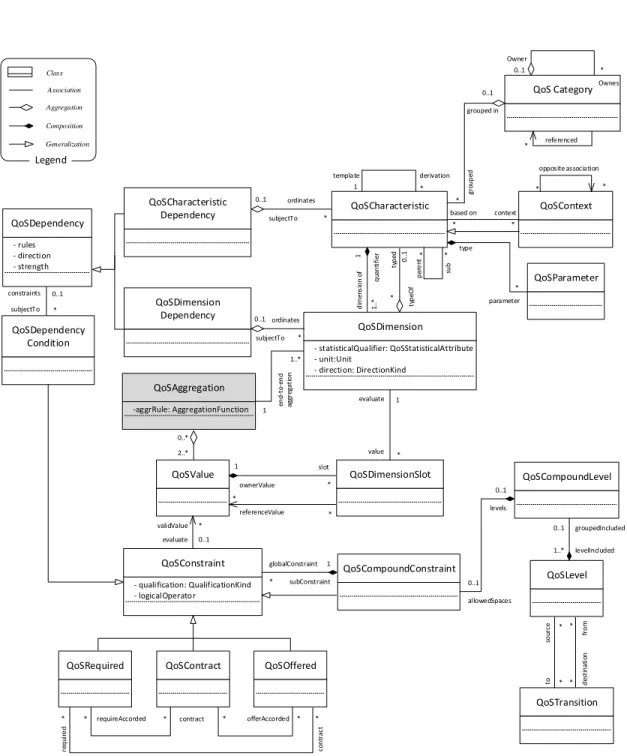
To describe quality concepts, the UML QoS meta model introduced by OMG com-prises three main conceptual submodels:Characteristics,Constraints, andLevels. Figure 3 shows the key elements of this meta model which is further instantiated to obtain a QoS model. The quality characteristic submodel integrates the concept of quality di-mensions which are instantiated to represent quantifiable characteristics.
(1) QoSCharacteristicincludes the model elements for the description of QoS properties
representing a measurable non-functional aspect of a service within a given do-main, for instance,price,availability, throughput,scalability,accuracy, and relia-bility. The Parent-Sub provides support for the specialization and extension of such elements. The template-derivation defines a relationship which enables a charac-teristic can be derived into other characcharac-teristics.
— QoSParameterprovides parameterization methods to quantify QoS
characteris-tics in terms of units and types for the description of value definitions.
— QoSDimension defines dimensions to quantify a quality characteristic. A QoS
characteristics can be quantified and composed by multiple quality dimensions, and a quality dimension of QoS characteristics can b be defined based on an-other QoS characteristics. For instance,reliabilitycharacteristic can be an ag-gregation of quality dimensions obtained by time to failure, time to repair, num-ber of failures supported, etc. Thestatisticalqualifier,unit, anddirection, as the core attributes, defines the type of statistical qualifier, the unit for the value dimen-sion and direction (or tendency). The types of statistical qualifiers can be defined as: quality range , maximum value, minimum value, mean, variance, standard deviation, percentile, distribution, etc.
— QoSDependency, as an extension proposed by [Jureta et al. 2009], expresses the
interdependencies between values of quality dimensions.
— QoSCategoryenables grouping QoS characteristics with their priorities to
man-age a complex class of quality properties sharing similar properties or impacts and facilitate the process of computing service ranking and selection. For in-stance, grouping enables service modeller to define more abstract quality as-pects (e.g., “Performance”, which is qualified by stakeholders’ perspectives) can comprisethroughput(the rate of successful service-request completion) and re-sponse time(the time elapsed between a consumer sending message and receiv-ing response), or “Security” can capture the level and kind of security a service provides and generally includeauthentication,confidentiality, encryption, and
traceability and auditability.
— QoSContextprovides supports for the description of quality characteristics.
— QoSValueinstantiates QoS characteristics and determines values for quality
di-mension.
— QoSDimensionSlotrepresents the value of a primitive quality dimension or a
ref-erence to another quality value.
— QoSAggregation, as one of our extensions to the UML QoS meta model, provides
methods and supports for end-to-end aggregation of quality values for quality characteristics of a composite service based on variability and composition pat-terns (See Section 4). TheaggRuleexpresses the rules and operators for quality
QoS CategoryOwnes Owner 0..1 * referenced QoSCharacteristic p ar e nt * 1 su b * QoSParameter QoSDimension - statisticalQualifier: QoSStatisticalAttribute - unit:Unit - direction: DirectionKind 1. .* q ua n ti fi er d im en si o n of 1 0..1 ty p eO f ty p ed * QoSValue * QoSContext opposite association * * context based on * * gr ou p ed * 0..1 grouped in type * parameter QoSDimensionSlot 1 slot ownerValue * * value evaluate 1 * * referenceValue QoSCharacteristic Dependency QoSDimension Dependency 0..1 ordinates subjectTo * template derivation * 0..1 ordinates subjectTo * QoSDependency - rules - direction - strength QoSDependency Condition * subjectTo constraints 0..1 QoSAggregation -aggrRule: AggregationFunction 1..* 1 M4 en d-to -e n d ag gr eg at io n QoSConstraint - qualification: QualificationKind - logicalOperator QoSContract QoSOffered QoSRequired requireAccorded * * contract * offerAccorded * re q ui re d * * co n tr ac t QoSCompoundLevel QoSLevel QoSTransition * to so ur ce * d es ti n at io n * * fr o m QoSCompoundConstraint evaluate 0..1 validValue * subConstraint 1 * globalConstraint 1..* levelIncluded 0..1 groupedIncluded levels 0..1 allowedSpaces 0..1 0..* 2..* Legend Class Association Composition Aggregation Generalization
aggregation and computations. Some quality dimensions may follow the same aggregation rule.
(2) QoSConstraint restricts the accepted values of a QoS characteristic, which can be
imposed by stakeholders or service provider based on application requirements or architectural decisions.QoScontextexpresses the characteristics of quality and func-tional elements involved in a constraint.
— QoSCompoundConstraint ensembles constraints and allows to represent global
constraints decomposed into a set of sub-constraints.
— QoSContract composes service and consumer constraints and specifies overall
multiple acceptable quality level of service and the requirements required to be achieved.
— QoSOfferspecifies the limits of quality values that service operations can
sup-port corresponding to the architectures and implementations designed to supply particular quality.
— QoSRequireenables service provider or consumer to define quality requirements
which are compulsory and systems must fulfil whilst others may be discretional. The required constraints can also be specified either by the service provider, user, or subsytem that needs the consumer to achieve some perquisite level of quality to obtain the quality offered by provider.
(3) QoSLeveldetermines the working and transition modes under which the service is
executed. Quality level defines the quality behavior which is relied on the algo-rithms, configuration, and infrastructure of the service . Different execution modes may provide distinctive range of quality level for the same service. The details of constructs are available in [SOC 2008].
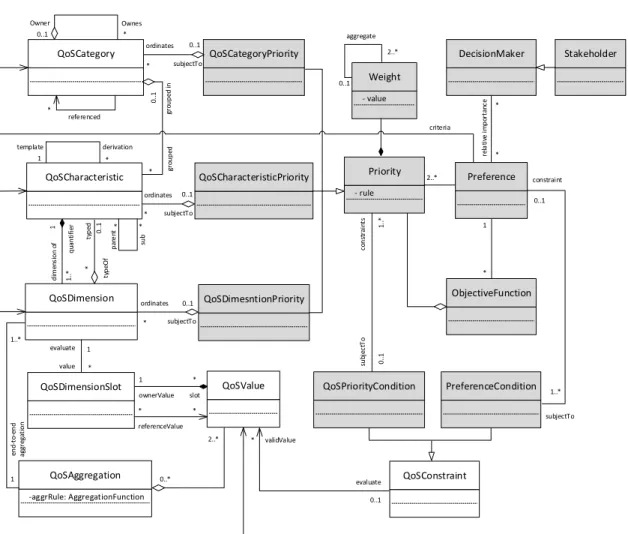
Figure 4 depicts the submodels of extended UML QoS meta model by preference model allowing to introduce and specify relative importance and conditional con-straints over quality characteristics, which are required for decision-making.
— DecisionMakerdefines and explicates involved decision-makers (DM) that can be
re-garded as algorithms, system, service provider, or stakeholder. Decision-maker can stipulate and determine quality relative importance relations in terms of preference or objective function which should be either maximized or minimized for multi-objective optimization and quality-aware service composition and configuration.
— Preferenceenables decision-makers, i.e., system, service provider, or stakeholder, to
express the priorities or relative importance over QoS characteristic, dimension, and category. The preference is often to minimize or maximize an objective function representing preference.
— Precedenceallows defining the relative importance relations for QoS model elements
to specify the priority between quality pairs. Therulesdetermine the order at which characteristic, dimension, and category are further prioritized.
— Weightexpresses the strength or degree of importance associated with relative
im-portance relations.
— QoSPrecedenceCondition indicates the constraints when the priorities hold. For
in-stance, the precedence condition specifies priority that should be applied if value over a quality dimension is achieved.
— ObjectiveFunctionenables to construct single or multiple objective functions
formu-lating and determining DM’s preference. quality-aware optimization may involve more than one objective function which can be constructed by aggregation.
— PreferenceCondition specifies conditional preference on values of quality dimensions
QoSCategory Ownes Owner 0..1 * referenced QoSCharacteristic p ar e nt * 1 su b * QoSDimension 1. .* q ua n ti fi er d im en si o n of 1 0..1 ty p eO f ty p ed * QoSValue * gr ou p ed * 0.. 1 gr ou p ed in QoSDimensionSlot 1 slot ownerValue * * value evaluate 1 * * referenceValue Preference DecisionMaker * re la ti ve im p or ta nc e * template derivation * Weight - value aggregate 0..1 2..* Stakeholder PreferenceCondition Priority - rule QoSCharacteristicPriority QoSCategoryPriority QoSDimesntionPriority 0..1 ordinates subjectTo * 0..1 ordinates subjectTo * 0..1 ordinates subjectTo * QoSPriorityCondition 1. .* co n st ra in ts 0.. 1 su bj ec tT o 2..* ObjectiveFunction 1 * 1..* constraint subjectTo 0..1 QoSConstraint criteria QoSAggregation -aggrRule: AggregationFunction 1..* 1 M4 en d-to -e n d ag gr eg at io n 0..* 2..* 0..1 evaluate * validValue
Fig. 4. QoS meta model extended by preference.
4. QUALITY OF SERVICE AGGREGATION AND COMPUTATION FOR PRODUCT LINE ARCHITECTURE
In this section, we describe our proposed quality aggregation model for product line architectures. We will cover the following issues to provide a model for the aggregation and computation of QoS range values in the presence of variability: (a) quality criteria and quality range for SOSPL; (b) combination of variability and composition patterns; and (c) algorithms to aggregate and compute quality range values.
We consider some quantitative QoS characteristics of Web-service, which have been taken into consideration as selection criteria in the research literature [Yu and jay Lin 2005; Zeng et al. 2004; Cardoso et al. 2004; Jaeger et al. 2004]. In this work, we include the following indexed QoS dimensions: 1)cost, 2)response time, 3)throughput, 4) availability, which are denoted as qpr, qrt, qtr, andqav, respectively. Of course, our
approach is not limited to these QoS properties, but these are the only discussed in order to illustrate our approach for quality aggregation and computation.
We also distinguish between two types of quality dimension:deterministicand non-deterministing. The former indicates that the values of QoS are known or certain when
a service is invoked (e.g., execution price and supported security protocols), whereas the later are unknown or uncertain at invocation time (e.g., response time), therefore, the QoS information should be collected through run-time monitoring. We consider that the QoS information is provided by service broker or middleware.
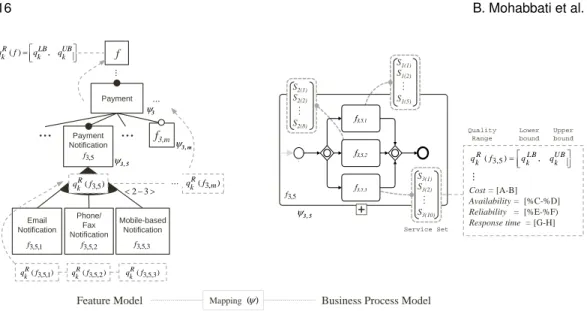
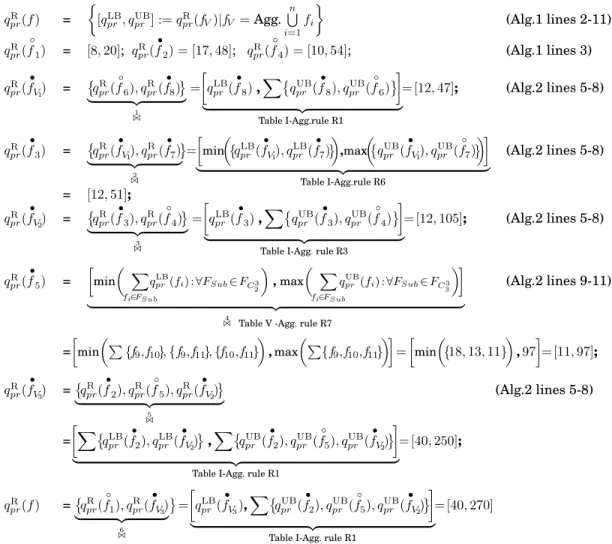
Based on the underlying implementation of a set of functionally equivalent services, which may be available for each feature, ranges of values of quality dimensions can be further specified and aggregated for each feature. Particularly during the domain engi-neering life-cycle, determining the implied QoS ranges for individual feature helps ser-vice engineers ensure that the product line architecture will fulfill and deliver the up-per and lower bounds of the values of the quality requirements requested by the stake-holders. Moreover, quality range computation enables for keeping track of the product line quality ranges even after the specification of the service quality has changed. Map-ping models interconnecting feature and business process models enable propagation of quantified quality values of concrete service sets, bounded to activities (abstract ser-vices) within in the process model. For example, in Figure 5, sets of candidate services provide different range of quality, denoted as qR, for each features. The range of the kthquality dimension for featurefcan be hierarchically computed. Let us now proceed
with some formal definitions as a basis for our work.
Definition4.1 (Quality Range). The quality range values of the ithquality
dimen-sion (dimendimen-sion) is defined asqiR= [qiLB, qiUB], whereqiLBandqUBi are lower and upper bound values of the quality dimension, respectively.
The above definition shows that each property such as response time or cost can be described by a range of numerical values. This range specifies both lower and upper bounds for that quality dimension. In order to be able to compute such a quality range, appropriate aggregation operators are needed. We consider the following three types of quality aggregation operators for computing the quality ranges of a software product line:
— Summation: The quality range values of the product line is determined by a sum of the QoS range values of the quality attributes of services. An example would be cost;
— Multiplication: The range values of quality attributes are determined by produc-tion of the QoS values of the services, for instance, reliability and availability; — Min-Max: The quality range values of the product line are computed with respect to
critical paths[Zeng et al. 2004; Dumas et al. 2010] in the business process structure, for instance, response time (i.e., execution duration).
In order to employ the above operators, we consider the following. We assume that for each activity an in a business process model BP, there is a bounded set of
can-didate services, San=hsn1, . . . , snmi, in which all of the candidates provide the same
functionality, but with different degrees of quality. The quality of a servicesis a vector
Qs=hq1(s), . . . , qk(s)i ∈ R, where the function qi(s)determines the values of the ith quality dimension.
The quality of each activityan is defined as a matrix[Qan]i×j; 1≤i≤ k,1≤j≤ m,
where each row corresponds to a quality dimensionqi, while each column corresponds to a service candidate. Thereby, the range of the ith quality dimension for feature
fn corresponding to activity an is obtained by the quality range function qiR(fn) = [qiLB, qiUB], whereqiLB=Qminan andqUBi =Qmaxan .
For example, let us assume that there are five service candidates inSai binding to
activityak, mapped to featurefk, and that their service cost values (qpr) are given by vectorQak(i, j) =h100,250,65,130,95i. The cost range values of featurefk could be set
... Payment Email Notification Phone/ Fax Notification Mobile-based Notification 2 3 f 3 , 5 3 f 3 , m
...
3,5,1 ( ) R k q f S3(1) S3(2) .. . S3(10) S1(1) S1(2) .. . S1(5) S2(1) S2(2) .. . S2(8) 3,5,2 ( ) R k q f qkR(f3,5,3) Cost = [A-B] Availability = [%C-%D] Reliability = [%E-%F) Response time = [G-H] ... (3,5) , R LB UB k k k q f q q 3, ( ) R m k q f 3 , m 3,5 ( ) R k q f Payment Notification ... ...Feature Model Business Process Model
3 , 5 ( ) , R LB UB k k k q f q q R k q Upper bound Lower bound Quality Range Service Set Mapping( ) 3,5,3 f 3,5,2 f 3,5,1 f 3,5 f 3,5 f
...
Fig. 5. Non-functional specification and aggregation for evaluating quality range supports by product line architecture
as follows:qR
pr(fk) = [65,250], because we are interested in the lower and upper bound
values for the quality range.
4.1. Combining Variability and Composition Patterns
In essence, the aggregation model for quality computation in the context of SOSPL depends on: a) structural variability captured by a feature model; and b) behavioral variability captured by a business process model, which describes the composition structure.
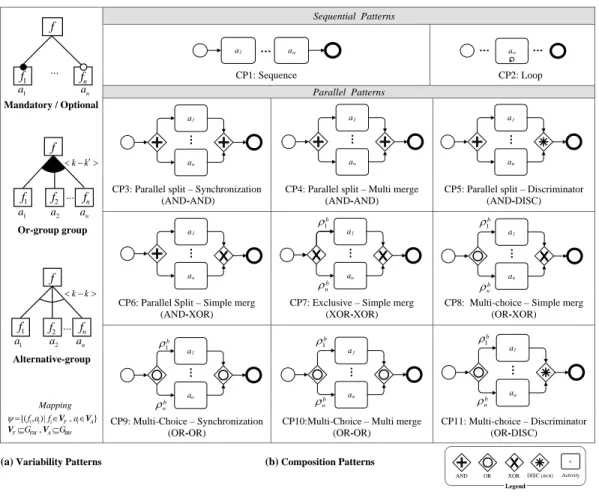
Composition patterns1, which have their roots in workflow management
sys-tems[Van Der Aalst et al. 2003], aim at building composition structures that are de-rived from the requirements in the process modeling phase. In other words, these pat-terns describe the behavior of features during execution time. Composition patpat-terns are independent of particular composition languages or techniques. and allow coor-dination of various activities in a process through control elements. They represent the abstract control flow and execution sequence of features within the reference busi-ness process model for a service product line. A complete collection of of workflow pat-terns for the different aspects of process-oriented application development has been presented in [Van Der Aalst et al. 2003]. Similar to [Jaeger et al. 2004], we consider composition patterns addressing behavioral structure of a composition, which are ap-plied for the quality aggregation. These patterns can be grouped into two main groups: a) sequential patternsand b)parallel patterns. These patterns describe the structure of a process and the execution model for activities (i.e., service).
In a process model, two basic sequential patterns are defined as sequence and arbi-trary cycle.
1) Sequence: This pattern describes the structure where an activity execute after the
completion of another activity in the same process.
2) Arbitrary cycle:This pattern, as a special case of sequence pattern, expresses that
the execution of one or more activities is repeated for a given number of times. The 1We use the termsworkflowandcomposition patterns, interchangeably.
Mapping Sequential Patterns CP1: Sequence CP2: Loop Parallel Patterns
CP3: Parallel split – Synchronization (AND-AND)
CP4: Parallel split – Multi merge (AND-AND)
CP5: Parallel split – Discriminator (AND-DISC)
CP6: Parallel Split – Simple merg (AND-XOR)
CP7: Exclusive – Simple merg (XOR-XOR)
CP8: Multi-choice – Simple merg (OR-XOR)
CP9: Multi-Choice– Synchronization (OR-OR)
CP10:Multi-Choice– Multi merge (OR-OR)
CP11: Multi-choice– Discriminator (OR-DISC)
(a) Variability Patterns (b) Composition Patterns
{( , )| , } , i i i F i A F FM A BM f a f a G G V V V V Mandatory / Optional ... k k ... f 1 f f2 fn 1 b b n 1 b b n 1b b n b n b n 1 b 1b f 1 f fn 1 a an 1 a a2 an ... Alternative-group k k f 1 f f2 fn 1 a a2 an Or-group group
AND OR XOR DISC (m/n) Activity
Legend ...
Fig. 6. Variability and composition patterns
number of cycle is determined during the design-time or specified with respect to conditions at run-time.
Parallel patterns describe how the process flow splits into branches for executing the activities and how they merge or converge.
3) Parallel split: A parallel split pattern represented by AND-split operation
de-scribes the behavioral structure where a single thread of control flow splits into multiple threads which can be executed concurrently in any order.
4) Multi-choice:This pattern denoted by OR-split operation describes the structure
in which a number ofmbranches amongn(1≤m < n) in parallel can be selected and executed based on process control data and business rules or specified proba-bility of branches. Theρb
i represents the probability of execution ofith branch.
5) Exclusive/Deferred choice :An exclusive pattern represented by XOR-split
oper-ation describes conditional branching where only one of several branch is selected for the execution based on decision or process control data. Deferred choice resem-bles the exclusive choice pattern, but in the deferred choice the split is relied on external input, whereas the exclusive choice pattern is based on workflow informa-tion (i.e., orchestrainforma-tion data). At design-time, the probability of each branch can
also be determined which specifies the probability that certain branch is chosen to be executed at run-time.
Following general parallel patterns represent how branches model the logic of the convergence of activities that are invoked or executed in a process flow.
6) Synchronization: This pattern represented by AND-join operation describes the
structure of process where multiple activities in parallel branches converge into one single thread synchronized.
7) Simple-merge: The simple merge pattern represented by XOR-join operation
de-scribe the structure where multiple branches converge without synchronization and only one of alternative branches has been executed in parallel.
8) Multi-merge:This pattern describes the structure where branches converge
with-out synchronization and the activity succeeding the convergence is activated by the completion of every incoming branch.
9) Discriminator/m-out-of-n-join: In discriminator pattern, subsequent activity
will be executed by the first and only the first branch completed based on the condi-tion and all the rest of branches are disregarded. This pattern also has been known as a partial join [Jaeger et al. 2004; Van Der Aalst et al. 2003]. The discriminator patterns can be generalized where the subsequent activity will be activated only afterm-out-of-nactivity. The number ofmis specified over business process model based on process control data and business rule.
It should be noted that various combinations of parallel split and join cannot seman-tically and formally provide valid patterns. For example, XOR-split in combination with AND-joint cannot occurs in process, hence it does not generate valid pattern.
Based on comparison of variability and workflow patterns, we first demonstrate how the effects of QoS aggregation for the computation of quality ranges are derived from primitive patterns, and then we describe algorithms to perform the derivation for other complex patterns in the same way. In addition to descriptive definitions of selected workflow patterns, we show the semantics using BPMN. Figure 6 illustrates three main variability patterns (left side), as described in Section 2.3, in combination with 11 composition patterns (CP1-CP11) (right side).
4.2. Aggregation Rules Based on Variability and Composition Patterns
Based on the patterns described above, we define aggregation rules for each QoS prop-erty by primarily taking into account the variability patterns which may occur within each composition pattern.
In the following, we present the aggregation rules for four numerical QoS proper-ties:cost,response time,availabilityandthroughput. The cost of a feature is the cost which can be associated with the deployment, execution, management, maintenance and monitoring of a service.
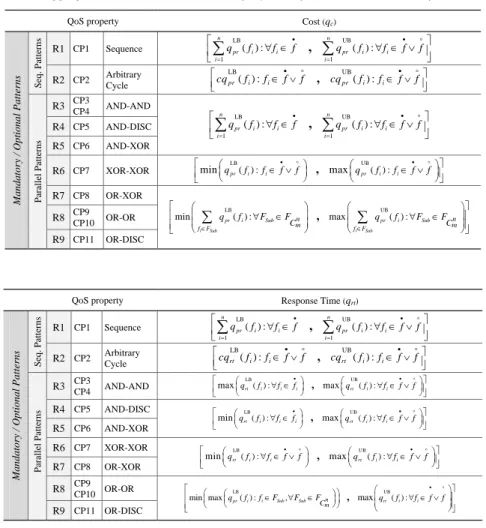
The summary of the cost and response time aggregation rules grouped based on mandatory/optional patterns and Or/Alternative variability patterns corresponding to composition patterns are given in Tables I and I, and Table V, respectively. The aggre-gation rules for availability and throughput are presented in Appendix A.
According to Definition 4.1, the definition of a quality lower bound,qLB
i , for different
quality dimensions must indispensably consider the mandatory features for sequential and parallel split patterns (CP1-CP6). In addition to mandatory features, the optional features generally contribute to the upper bound range value,qiUB. For instance, in the sequential patterns, the cost of particular feature should be determined by the sum of the cost values of each mandatory feature for the lower bound; while the upper bound is resolved by the accumulated cost for mandatory as well as optional features.
Table I. Aggregation rules based onMandatory/Optionalpatterns for cost and response time.
QoS property Cost (qc)
Mandatory / Optional Patterns
Seq. Patterns R1 CP1 Sequence LB UB 1 1 ( ) :
,
( ): n n pr i i pr i i i i q f f f q f f f f
R2 CP2 Arbitrary Cycle LB UB ( ) :,
( ) : pr i i pr i i cq f f f f cq f f f f Parallel Patterns R3 CP3 CP4 AND-AND LB UB 1 1 ( ) :,
( ): n n pr i i pr i i i i q f f f q f f f f
R4 CP5 AND-DISC R5 CP6 AND-XOR R6 CP7 XOR-XOR LB UB ( ) : ( ) : min qpr fi fi f f,
max qpr fi fi f f R7 CP8 OR-XOR LB UB ( ) min :,
max ( ) : i Sub i Sub pr i Sub pr i Sub f F f F n n m m C C q f F F q f F F R8 CP9 CP10 OR-OR R9 CP11 OR-DISC) out of seven (n=7) in, the minimum of 3rd quickest should be considered
QoS property Response Time (qrt)
Mandatory / Optional Patterns
Seq. Patterns R1 CP1 Sequence LB UB 1 1 ( ) :
,
( ): n n pr i i pr i i i i q f f f q f f f f R2 CP2 Arbitrary Cycle LB UB ( ) :,
( ) : rt i i rt i i cq f f f f cq f f f f Parallel Patterns R3 CP3 CP4 AND-AND LB UB ( ) : ( ) : max qrt fi fi fi , max qrt fi fi f f R4 CP5 AND-DISC LB UB ( ) : ( ) : min qrt fi fi fi , max qrt fi fi f f R5 CP6 AND-XOR R6 CP7 XOR-XOR LB UB ( ) : ( ) : min qrt fi fi f f , max qrt fi fi f f R7 CP8 OR-XOR R8 CP9 CP10 OR-OR LB UB ( ) : ( )min max pr i i Sub, Sub n , max rt i : i
m C q f f F F F q f f f f R9 CP11 OR-DISC
Table II. Aggregation rules based onOr/Alternative-feature groups variability patterns for cost and response time. Table2
QoS Properties Cost (qc) Response Time (qrt)
Or (*) 1 / Alternative (**) 1 Patterns Seq. R1 CP1 Sequence LB UB (*) (**) min ma ( ) : x ) : ( , | pr i Sub pr i Sub fiFS k k k ub fiFSub n n n C C C q f F q f F F F F LB UB (*) (**) ( min ): , max ( ): | Sub Sub i i rt i Sub rt i Sub f F k f F k k n n n C C C q f F F q f F F F Parallel Patterns R3 CP3 CP4 AND-AND LB UB (*) (**)
min max rt( ) :i Sub , max max rt( ) :i Sub |
k k k n n n C C C q f F F q f F F F R4 CP5 AND-DISC LB UB (*) (**)
min min rt( ) :i Sub , max max rt( ) :i Sub |
k k k n n n C C C q f F F q f F F F R5 CP6 AND-XOR R6 CP10 OR-XOR R7 CP7 CP8 OR-OR LB UB (*) (**)
min max rt( ) :i Sub , max max rt( ) :i Sub |
k k k n n n C C C q f F F q f F F F R8 CP9 OR-DISC R9 CP11 XOR-XOR
1(*) and (**) represent the feature set combinatorial operators which are applied for Or and Alternative variability patterns, respectively
QoS Properties Availability (qav) Throughput (qtp)
Or/ Alternative Patterns
Seq. R1 CP1 Sequence LB LB (*) (**) ( ) : min max ( ) : , | av i Sub f F av i S f F C ub n i Sub i Sub k k k n n C C q f F q f F F F F LB UB (*) (**)
min min tp( ) :i Sub , max max tp( ) :i Sub |
k k k n n n C C C q f F F q f F F F Parallel Patterns R3 CP3 CP4 AND-AND LB UB (*) (**)
min min tp( ) :i Sub , min min tp( ) :i Sub |
k k k n n n C C C q f F F q f F F F R4 CP5 AND-DISC R5 CP6 AND-XOR LB UB (*) (**)
min min tp( ) :i Sub , max max tp( ) :i Sub |
k k k n n n C C C q f F F q f F F F R6 CP10 OR-XOR R7 CP7 CP8 OR-OR R8 CP9 OR-DISC R9 CP11 XOR-XOR