Journal of Modern Applied Statistical
Methods
Volume 7 | Issue 1
Article 21
5-1-2008
Confidence Intervals Based on Robust Estimators
Meral Cetin
Hacettepe University, [email protected]
Serpil Aktas
Hacettepe University, [email protected]
Follow this and additional works at:
http://digitalcommons.wayne.edu/jmasm
Part of the
Applied Statistics Commons
,
Social and Behavioral Sciences Commons
, and the
Statistical Theory Commons
This Regular Article is brought to you for free and open access by the Open Access Journals at DigitalCommons@WayneState. It has been accepted for inclusion in Journal of Modern Applied Statistical Methods by an authorized administrator of DigitalCommons@WayneState.
Recommended Citation
Cetin, Meral and Aktas, Serpil (2008) "Confidence Intervals Based on Robust Estimators,"Journal of Modern Applied Statistical Methods: Vol. 7: Iss. 1, Article 21.
253
Confidence Intervals Based on Robust Estimators
Meral Cetin Serpil Aktas
Hacettepe University
Classical estimation of confidence intervals based on the sample mean and variance is sensitive to outliers. Robust methods were proposed for reducing the influence of outliers. The Minimum Volume Ellipsoid estimator (MVE), having a high breakdown point, is one of the robust estimators for location and scale parameters. The robust confidence interval for location parameter is constructed based on the MVE, and compared with the proposed robust confidence interval estimation methods. The performance of the robust confidence interval based on MVE is illustrated with a simulation study. The lengths of 100(1-α)% confidence intervals were investigated.
Key words: Robust estimators, minimum volume ellipsoid estimator, robust confidence interval.
Introduction
Little attention has been given to confidence intervals (CI) based on robust estimators when the underlying distribution is nonsymmetric. Robust confidence limits were studied by Huber (1968). Du Mond and Lenth (1987) studied the robust confidence interval for the biweight M estimator. Tiku and Tan (1986) used the MML estimators for location and compare it with the trimmed mean, Sprot’s estimators and the others. Fraiman et.al (2001) constructed the robust confidence interval based on optimal robust M-estimates of location.
Robust confidence interval for the median were given by Staudte and Sheather (1990). Adrover and Zamar (2000) defined the globally robust confidence interval and p-values for the location. The robust confidence interval based on the minimum volume ellipsoid estimator is investigated for location parameter. It is compared with the confidence interval
Meral Çetin, Department of Statistics. Her interests are in regression analysis, robust regression and robust model selection. Email: [email protected]. Serpil Aktas, Department of Statistics. Her interests are in categorical data analysis, design of experiment and repeated measurement data analysis. e-mail: [email protected].
based on sample mean, Huber estimator and median.
Robust Confidence Interval
The most common technique for finding a 100(1-α)% confidence interval is
x±t1−α/2;n−1[S/ n] (1) where t is the 100(1-α/2) percentage point of the distribution on n-1 degrees of freedom. If the data come from the nonsymmetric distribution the confidence interval may vary one sample to another. The sample mean and variance would be affected from the distribution and tend to give long intervals.
Robust confidence interval for median is given by the following
Median
±t1−α/2;n−1[S*/ n] (2) where, S* is the standard error of the median given by (Fraiman et.al, 2001).S* =
[
xa −xb]
/3.4641 (3) + = 2 n 3 2 n a and − = 2 n 3 2 n bThe confidence interval based on Huber estimator is given by
CONFIDENCE INTERVALS BASED ON ROBUST ESTIMATORS
254
Huber±t1−
α
/2;n−1[Shuber] (4)where, Huber is M estimator of location and
Shuber is the standard error of the huber estimators given by Equation [5],
486 . 1 ) (x mad Shuber = (5) The MVE, having high breakdown point, is one of the robust estimators for the location and scale parameters (Wilcox, 1997). It is one of several multivariate location and scale estimators. This estimator has high finite-sample breakdown point. The use of estimators with high finite-sample breakdown point yields good performance according to the masking effect.
Rousseeuw (1984) introduced the affine equivariant estimator with maximal breakdown
point, by putting T(X)= center of minimal
volume ellipsoid covering h points of X where h can be taken equal to [n+1]+1. This is called the minimum volume ellipsoid estimator (1987). The covariance estimator of this is given by the ellipsoid. Because of the transform x→ xA+b is an ellipsoid where A and b are the constants, MVE is an affine equivariant estimator, such that any transformation on x does not affect the MVE.
The minimum volume ellipsoid estimator proposed by Rousseeuw (1985) is a robust estimation of location and scale of multivariate data in the presence of outliers. The MVE is the robust estimation of multivariate location and scale defined by minimizing the
volume of an ellipsoid containing h points.
These robust location and scale estimators can be used to detect multivariate outliers and leverage points.
The MVE estimator searches for the smallest ellipse containing half of the data (Wilcox, 1997). When sampling from a multivariate normal distribution, then it rescaled these estimates so that they estimate the usual population mean and covariance matrix. It is difficult to find the smallest ellipse containing half of data. From the n points, MVE estimator randomly selects h points without replacement and computes the volume of this ellipse. The set of points giving the smallest volume is taken to
be minimum volume ellipsoid. The location and scale MVE estimators yield an effective method for identifying outliers in multivariate data (Rousseeuw, 1990).
This estimator is defined to be the ellipsoid of minimum volume covering at least h points of the data set (Rousseeuw, 1987). The breakdown point of MVE estimator at any p-dimensional sample X is
ε
n*(T,X)=(n/2−p+1)/n (6) which converges to 50% asn
→
∞
((Rousseeuw, 1987). The robustconfidence interval for location based on MVE is constructed by,
MVE±t
1
−
α
/
2
;
n
−
1
[Smve
] (7) where MVE is the location parameter and theSMVE scale parameter. SMVE is computed as
cov.mve in the statistical software S-Plus. When the outliers are much larger than the true values SMVE has the best estimation. SMVE estimator takes into account half of the observations which are distributed nearest to an estimated center (Ma & Genton, 2001).
Simulation Study
The performance of the robust confidence intervals of a location parameter is illustrated by Monte Carlo Simulation using the S-Plus coding. Four types of confidence intervals including sample mean, median, Huber and MVE were calculated. Random samples were generated from the normal distribution for the sample sizes n=25, 50, 100, 500 and 1000 with 1000 replications. In order to see the effect of outliers on the estimators and also on the confidence interval, the simulation was implemented by generating no outlier, one outlier and many outliers. These outliers were generated for the same samples.
255
Table 1: Lower - upper Bound and Width of the Confidence Interval of Estimators When Data Consist of No Outlier
Sample
Size Sample Mean Huber MVE Median
10 5.5737 ; 14.4436 (8.8699) 7.2332; 12.7427 (5.5096) 5.3136;14.6654 (9.3491) 7.8332;12.1622 (4.3290) 25 5.9333;14.0742 (8.1409) 7.3331;12.6631 (5.3300) 4.4203;15.5563 (11.1360) 8.9133;11.1037 (2.1904) 50 6.0959;13.9145 (7.8186) 7.3960;12.6182 (5.2222) 3.8225;16.2043 (12.3817) 9.3179;10.7087 (1.3908) 100 6.0061;13.9147 (7.8287) 7.3842;12.6135 (5.2292) 3.4443;16.5351 (13.0908) 9.5066;10.4798 (0.9732) 500 6.0855;13.9183 (7.8327) 7.3680;12.6357 (5.2647) 3.0507;16.9469 (13.8962) 9.7976;10.1973 (0.3997) 1000 6.0367; 13.9184 (7.8413) 7.3616;12.6335 (5.2719) 2.9606;17.0353 (14.0747) 9.8433;10.1486 (0.3053)
Figure 1:Estimators with respect to the sample size and the lenght (no outlier). Length of CI is on the Y axis.
0 5 10 15 20 25 n=10 n=25 n=50 n=100 n=500 n=1000 Sample size Huber MVE median mean
CONFIDENCE INTERVALS BASED ON ROBUST ESTIMATORS
256
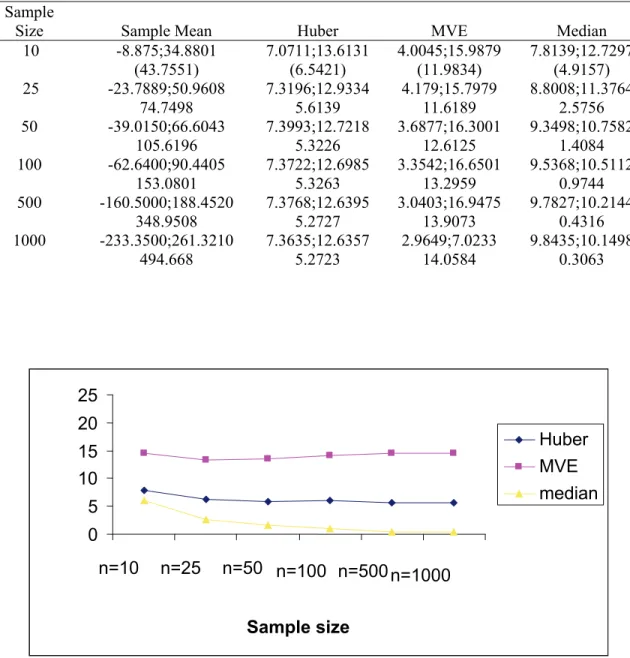
Table 2: Lower - upper Bound and Width of the Confidence Interval of Estimators When Data Consist of One Outlier
Sample
Size Sample Mean Huber MVE Median
10 -8.875;34.8801 (43.7551) 7.0711;13.6131 (6.5421) 4.0045;15.9879 (11.9834) 7.8139;12.7297 (4.9157) 25 -23.7889;50.9608 74.7498 7.3196;12.9334 5.6139 4.179;15.7979 11.6189 8.8008;11.3764 2.5756 50 -39.0150;66.6043 105.6196 7.3993;12.7218 5.3226 3.6877;16.3001 12.6125 9.3498;10.7582 1.4084 100 -62.6400;90.4405 153.0801 7.3722;12.6985 5.3263 3.3542;16.6501 13.2959 9.5368;10.5112 0.9744 500 -160.5000;188.4520 348.9508 7.3768;12.6395 5.2727 3.0403;16.9475 13.9073 9.7827;10.2144 0.4316 1000 -233.3500;261.3210 494.668 7.3635;12.6357 5.2723 2.9649;7.0233 14.0584 9.8435;10.1498 0.3063
Figure 2:Estimators with respect to the sample size and the lenght (one outlier). Length of CI is on the Y axis.
0
5
10
15
20
25
n=10
n=25
n=50 n=100 n=500n=1000
Sample size
Huber
MVE
median
257
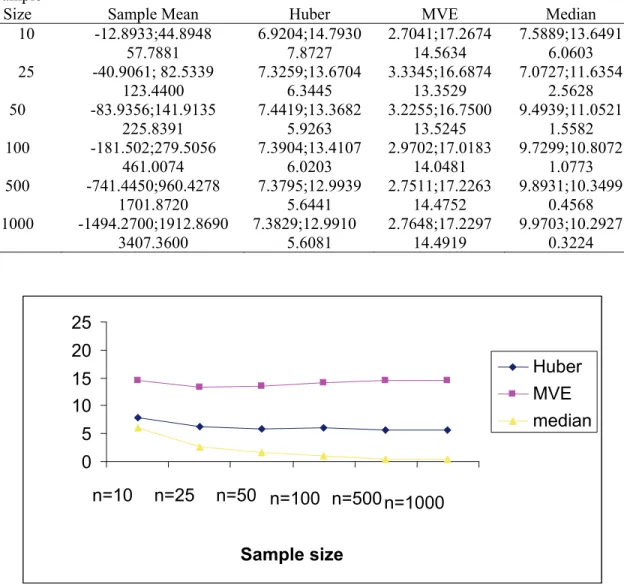
Table 3: Lower - upper Bound and Width of the Confidence Interval of Estimators When Data Consist of Many Outlier
Sample
Size Sample Mean Huber MVE Median
10 -12.8933;44.8948 57.7881 6.9204;14.7930 7.8727 2.7041;17.2674 14.5634 7.5889;13.6491 6.0603 25 -40.9061; 82.5339 123.4400 7.3259;13.6704 6.3445 3.3345;16.6874 13.3529 7.0727;11.6354 2.5628 50 -83.9356;141.9135 225.8391 7.4419;13.3682 5.9263 3.2255;16.7500 13.5245 9.4939;11.0521 1.5582 100 -181.502;279.5056 461.0074 7.3904;13.4107 6.0203 2.9702;17.0183 14.0481 9.7299;10.8072 1.0773 500 -741.4450;960.4278 1701.8720 7.3795;12.9939 5.6441 2.7511;17.2263 14.4752 9.8931;10.3499 0.4568 1000 -1494.2700;1912.8690 3407.3600 7.3829;12.9910 5.6081 2.7648;17.2297 14.4919 9.9703;10.2927 0.3224
Figure 3:Estimators with respect to the sample size and the lenght (many outlier). Length of CI is on the Y axis.
0
5
10
15
20
25
n=10
n=25
n=50 n=100 n=500n=1000
Sample size
Huber
MVE
median
CONFIDENCE INTERVALS BASED ON ROBUST ESTIMATORS
258
Robust estimators of location and scale for generated samples were calculated. Classical and robust confidence intervals and the width of the confidence intervals were obtained for 95%. Results were given for the 1000 replications. Lower and upper bounds and the witdh of the CI are shown in Tables 1-2 and 3 with respect to the sample sizes and the outliers. Figures 1, 2, and 3 also indicate the estimators according to the sample size and outlier(s).
Conclusion
The numerical results given in Tables 1, 2 and 3 show the behaviour of the confidence intervals calculated under different conditions. It is known that the mean is very sensitive to outliers. The width of the confidence intervals for each estimators are not affected by the sample size when data consist of no outlier. While the shortest width is obtained for the median among the others, the widest CI is the MVE. When the sample size is increasing, the width of the median is seen to be decreasing. Unlike others, the width of the CI based on Huber estimates does not vary with the sample size.
The CI based on the mean gives very long width when data consist of one outlier. Other CI’s based on robust estimators give similar results for the case of no outlier. Although the CI based on mean yield a large width, the case of more than one outlier, robust CI are not affected by the outliers. Irrespective of the number of outlier, the robust CI give the alike results. Note that the confidence interval based on the MVE estimator is approximately two times wider than the Huber.
It can be concluded that the width of the confidence intervals based on the MVE, Huber and the median are not affected by the outlier(s). In the Figures, note there is no difference between the CI’s when the data consist of one outllier and more than one outlier. For large samples the confidence intervals for the Huber and MVE is stationary for the case of outlier. When the distribution is nonsymmetric, utilization of the robust confidence intervals would be appropriate. The smallest CI is always obtained for the case. It should be noted that explicit inferences were not made.
References
Adrover, J. G., & Zamar, R. H., (2000). Bias robustness of three median-based regression estimates. Tecnical Report No. 194, Department of Statistics, University of British Columbia, Canada.
Du Mond, & Lenth, R. V. (1987). A Robust Confidence Interval for Location, Technometrics, 29(2), 211-219.
Fraiman, R., Yohai, V. J., Zamar, R., (2001), Optimal robust M-estimates of location, Annals of Statistics, 29(1), 194-223.
Huber, P. J., (1968), Robust confidence limits. Z.Wahrsch.verw, Geb. 10, 269-278.
Ma, Y., & Genton, G. M. ,(2001), Highly robust estimation of dispersion matrices, Journal of Multivariate Analysis, 78, 11-36.
Rousseeuw, P. J., (1984). Least median of squares regression. Journal of the American Statistical Association, 79, 871-880.
Rousseeuw, P. J, (1985), Multivariate estimation with high breakdown point. Mathematical Statistics and Applications, Vol B. W. Grossmann, G. Pflug, I. Vincze, and W. Wertz, Dordrecht, (Eds.): Reidel, 283-297.
Rousseeuw, P. J., Leroy, A. M., (1987). Robust regression and outliers detection. NY: Wiley.
Rousseeuw, P. J, Van Zomeren, B.C., (1990). Unmasking multivariate outliers and
leverage points. Journal of the American
Statistical Association, 85, 633-639.
Sachs, L., (1982). Applied statistics: A handbook of techniques. Springer-Verlag, New York.
Staudte, R., G., Sheather, S. J., (1990), Robust estimation and testing. NY: Wiley.
Tiku, M. L, Tan W. Y., & Balakrishnan N. (1986)., Robust inference. NY: Marcel.
Wilcox, R., R., (1997), Introduction to robust estimation and hypothesis testing, Academic Pres, San Diego.