DigitalCommons@UNO
Student Work
12-2016
Expectation-Centered Analytics for Instructors and
Students
Suzanne L. Dazo
University of Nebraska at Omaha
Follow this and additional works at:
https://digitalcommons.unomaha.edu/studentwork
Part of the
Computer Sciences Commons
This Thesis is brought to you for free and open access by
DigitalCommons@UNO. It has been accepted for inclusion in Student Work by an authorized administrator of DigitalCommons@UNO. For more information, please [email protected].
Recommended Citation
Dazo, Suzanne L., "Expectation-Centered Analytics for Instructors and Students" (2016).Student Work. 2906.
Instructors and Students
A Thesis
Presented to the
College of Information Science and Technology and the
Faculty of the Graduate College University of Nebraska
In Partial Fulfillment of the Requirements for the Degree Master of Science in Computer Science
University of Nebraska at Omaha
by Suzanne L. Dazo December 2016 Supervisory Committee Brian Dorn, Ph.D. Neal Grandgenett, Ph.D. Harvey Siy, Ph.D.
All rights reserved INFORMATION TO ALL USERS
The quality of this reproduction is dependent upon the quality of the copy submitted. In the unlikely event that the author did not send a complete manuscript
and there are missing pages, these will be noted. Also, if material had to be removed, a note will indicate the deletion.
All rights reserved.
This work is protected against unauthorized copying under Title 17, United States Code Microform Edition © ProQuest LLC.
ProQuest LLC.
789 East Eisenhower Parkway P.O. Box 1346
Ann Arbor, MI 48106 - 1346 ProQuest
Published by ProQuest LLC ( ). Copyright of the Dissertation is held by the Author.
10247282 2016
Expectation-Centered Analytics for Instructors and Students Suzanne L. Dazo , MS
University of Nebraska, 2016 Advisor: Brian Dorn, Ph.D.
Learning analytics is the measurement, collection, analysis, and reporting of data about learners and their contexts. An outcome and primary goal of learning analytics should be to inform instructors, who are primary stakeholders, so that they can make effective decisions in their courses. To support instructor inquiry, I apply theory on reflective practice to learning analytic development. Articulating an instructor’s pedagogical expectations is one way to begin facilitating a reflective practice. Expectations based on instructor goals serve as a natural next step and the springboard from which data can be collected. I hypothesize that a learning analytic that encodes and reifies instructors’ individual expectations will better support reflective practice for instructors and allow students to more reliably meet set expectations.
I took a user-centered approach to learning analytic research and development. First I triangulated empirical analysis of analytic use with focus groups to understand how in-structors interacted with analytics. Inin-structors had a wide range of behaviors, needs and expectations. For most instructors, analytics were used very briefly (less than 1 minute). Instructors also requested a way to aggregate data from different analytics to better sup-port their information needs. Based on these findings, I developed learning analytics within TrACE to allow for instructors to specify expectations and see student progress related to
tions.
Finally, I conducted a field study to compare both instructor analytic use and stu-dent compliance to expectations without and with the presence of these analytics. The results of the field study did not support the hypothesis. Instructors for the most part did not change their behaviors with the introduction of these analytics. Students also did not meet expectations more reliably, but one course saw a significant improvement in perfor-mance. Without visible expectations, students met significantly fewer posting expectations than other expectations. With explicit expectations, posting performance was no longer significantly less.
Acknowledgements
I would like offer my special thanks to my fellow CEL lab members whose efforts were invaluable in my research. To Nick Stepanek for his help with editing and data processing, to Aarjav Chauhan for working with me on the participatory design session and creating early mockups, and to Bobby Gibbs for helping test and tweak my prototypes, I am truly grateful.
To my good friends Susannah, Sammi, Johannes, Robert, and Nicole for cheering me on, always offering help when I need it, and reminding me that I had it in me all along. Thank you.
To my family, especially my mother Sharon and my brother Jonathan, I am very appreciative of your love and always supporting me in my endeavors.
Advice given by my committee members Dr. Harvey Siy and Dr. Neal Grandgenett have been particularly helpful in guiding me and keeping me on-track through this long process.
To Hunter Kennoy for all of the proofreading, motivational talks, and love, I’ll always be thankful.
Finally, I would like to thank Dr. Brian Dorn for advising me through this process, challenging me to be a stronger researcher and writer, finding the time to meet with me, and always having a statistics book on hand.
This work is funded in part by the National Science Foundation under grant IIS-1318345. Any opinions, findings, and conclusions, or recommendations expressed in this material are those of the authors and do not necessarily reflect the views of the NSF.
Contents
Abstract i
Acknowledgements iii
List of Figures vii
List of Tables ix
1 Introduction 1
2 Background and Related Work 8
2.1 Theoretical Background . . . 8
2.1.1 Reflective Practice . . . 8
2.1.2 The Learning Analytic Cycle . . . 12
2.2 Implementation of Systems . . . 14
2.2.1 Instructor-centered analytics . . . 15
2.2.2 Student-centered analytics . . . 16
3 Formative Study 21
3.1 Methods Overview . . . 25
3.2 Activity Data in TrACE . . . 26
3.2.1 Results . . . 27
3.3 Qualitative Study . . . 32
3.3.1 Focus Groups . . . 32
3.3.2 Participatory Design Session . . . 33
3.3.3 Results . . . 35
3.3.4 Affinity Diagram Results . . . 39
3.4 Discussion and Design Requirements . . . 45
4 Analytic Development 50 4.1 Specifying Expectations . . . 52
4.2 Student Analytics . . . 56
4.3 Instructor Analytics . . . 60
4.3.1 Expectation Progress Report . . . 61
4.3.2 Student Report . . . 62
5 Field Study 64 5.1 Instructor Analytic Use . . . 67
5.2 Student Performance . . . 69
6 Conclusion 73 6.1 Limitations . . . 75
6.2.1 Future Work . . . 80
A Expectation specification form 81
A.1 Instructor Responses . . . 82
List of Figures
1.1 An overview of the format of the study . . . 6
2.1 The Learning Analytics Cycle . . . 14
3.1 The video playback system in TrACE. Students can create annotations point-ing to specific video content . . . 22
3.2 Sample images of the analytics available to instructors in TrACE . . . 22
3.3 Proportion of analytic use by instructor, compared across semesters. Ex-cludes instructors who only used TrACE for one semester. . . 29
3.4 An analytic to answer “What would get the students more engaged to the content and community?” . . . 37
3.5 An analytic to answer “What are student misconceptions?” . . . 37
3.6 Two analytics seeking to identify student confusion . . . 38
4.1 Examples of how expectations could be specified . . . 54
4.2 Feedback to students on their video viewing was visualized above the playhead. 56 4.3 An analytic designed by instructors to answer “What would get the students more engaged to the content and community?” Redrawn for clarity. . . 57
4.5 Student can see indicators of videos with met or unmet expectations on the course page . . . 58 4.6 A To-Do list detailing what the expectations are at the start of every video 59 4.7 Students see several badges related to the expectations they should meet . . 59 4.8 The Expectation Progress Report . . . 61 4.9 The Student Report Analytic with the Expectation Report panel open . . . 63
5.2 Average completion of expectations (up to 100%) compared between phases separated by expectation type. Classes with significant differences in perfor-mance between the control and treatment(p <0.05) are marked by *. . . . 70 5.3 Average completion of expectations (up to 100%) in the first phase, separated
by expectation type. . . 71 5.4 Average completion of expectations (up to 100%) in the second phase,
List of Tables
1.1 Summary of activities . . . 7
3.1 Instructors using TrACE from 2015 to present . . . 24
3.2 Frequency of overall analytic use normalized by number of videos in all courses 28 3.3 Median duration (in seconds) instructors spent in all analytics. Instructors with a significant difference in duration (p <0.05) are in bold . . . 28
3.4 Participatory Design participants . . . 32
3.5 Instructor questions and why it was important to them. . . 36
5.1 Overview of the phases in the field study . . . 66
5.2 A contingency table comparing analytic use (frequency) for instructors 1, 3, and 9 between phases . . . 68
Chapter 1
Introduction
With the emergence and widespread use of technology for educational contexts, the use of learning analytics for classrooms has been praised as having made data about learners visible that has previously been “unseen, unnoticed, and therefore unactionable” (Bienkowski et al., 2012). In practice, this newly available information may not be as actionable as we expect. Instructors, who play an integral role in the classroom, are also necessary for the effectiveness of these analytics. Although data is more available, a major issue in facilitating interaction between instructors and students is that many existing learning analytics do not provide all of the information needed for instructor interventions to take place (Dyckhoff et al., 2013). This study aims to fill that gap through the development of a learning analytic designed towards instructor needs. Additionally, this analytic is evaluated by its impact on instructor and student behaviors in the classroom.
Learning analytics are defined as the measurement, collection, analysis, and
report-ing of data about learners and their contexts for purposes of understandreport-ing and optimizreport-ing learning and the environments in which it occurs (Ferguson, 2012, Siemens and Long, 2011).
The goals of learning analytics are to improve course activities, identify problematic stu-dents/imbalances in the class dynamic, and allow for quick intervention by the instructor (Charleer et al., 2014).
Current research has given excellent evidence on what qualities can make for effec-tive analytics (Scheffel et al., 2014) and many tools exist with the intention of informing instructors about student activities (see e.g., (Dawson et al., 2010, Romero et al., 2010)). However, Dyckhoff et al. (2013) identified that of almost 30 learning analytics analyzed, they do not yet answer all the questions teachers have for their classes. Additionally, instruc-tors had challenges interpreting visualizations which are often created with the assumption that users are familiar with data mining techniques and complex analysis methods (Scheffel et al., 2011). Many learning analytics focus on reporting preset quantitative measures that may or may not be important to an instructor and do not cover the full extent of their data needs. In order for learning analytics to be more relevant to an instructor’s practice, these analytics need to address the instructor’s data needs for their specific course context. Learning analytic design should articulate the pedagogical intent of the teacher as opposed to being imposed by developers (Lockyer and Dawson, 2012, Wise, 2014).
Some setbacks include a gap in studies on the entire course context Greller and Drach-sler (2012), a lack of time in development to involve teachers, and a lack of existing commu-nity that prioritizes the involvement of instructors in design (Nelson et al., 2008). It has been suggested that researchers should focus instead integrating learning analytics into everyday practice and develop better and more usable tools for learners and teachers (Chatti et al., 2012, Dyckhoff et al., 2013). In moving forward, one way to address these issues is with a
user-centered approach that seeks to understand how instructors are actually using learning
tool that has encountered many of these pitfalls in learning analytic design (Elson, 2016). TrACE is an online video-playback platform that was developed with the goal of sup-porting collaboration among students within video-based course contexts (Dorn et al., 2015). Instructors upload videos to this platform for students to watch, and the system allows stu-dents to annotate and reply to annotations in videos. As a part of this system, an analytic dashboard was developed to allow for instructors to interpret student viewing behaviors, which was a need identified among several practitioners and education researchers (Maher et al., 2015, Lacher and Lewis, 2015). A study on this system in particular is useful as video elements are widely used in large-scale online education platforms (e.g. Coursera, Udacity, Khan Academy), but as a research prototype, it serves as a more flexible platform that is responsive to instructor needs on a smaller scale during development.
In developing learning analytics for TrACE and similar systems, it is necessary design based on education theory. The learning analytics cycle and reflective practice are two theories that can inform an improvement on the quality of intervention through learning analytics (more details in Chapter 2). The rationale behind this is that awareness and reflection support for educators are major goals for learning analytics (Scheffel et al., 2014). First, the learning analytic cycle (Clow, 2012) describes the flow of information in learning analytics. Some sort of intervention has an effect on learners, and these interventions are originally informed by learner-generated data in the form of metrics or analytics. Instructor actions are one type of intervention. Through analytics, instructors can make predictions about their students and take actions that would serve as an intervention on either current learners or future ones. To improve the quality of instructor interventions, the outcome and a primary goal of learning analytics should be to properly inform instructors so that they can make effective decisions. Reflective practice is a theory which can be a guide
in how to aid instructor intervention. Reflective practice is a way in which instructors can consider the goals important to them in their course contexts, gather data, and process that data to accomplish or redefine those goals (Sch¨on, 1987). When an instructor does not use reflective practice, he or she may not initiate any interventions or change his or her teaching strategies when students have issues which should be addressed (Sparks-Langer et al., 1990, Murphy and Ermeling, 2016). When analytics do not support reflection, instructors may be collecting data which overall does not support their inquiry. Although studies have been conducted to take into account instructor inquiry and the questions instructors want answered about their students, this work remains mostly in theory (Dyckhoff et al., 2013). The first step in reflective practice is to have an instructor consider his or her goals. When an instructor has course goals, expectations based on those goals serve as a natural next step and the springboard from which data can be collected. In support of applying expectations to learning analytics, instructors have already expressed interest in being able to more quickly identify if expectations are met in TrACE (Elson, 2016). Other researchers have also made similar attempts at goal-based visualizations in learning analytics. Most notably, Muslim et al. (Muslim et al., 2016) utilized a workflow of eliciting instructor goals and questions to create visualizations that apply most to an instructor’s needs. Additionally, making expectations explicit has been cited as a practice that is beneficial to students as well (Dennen et al., 2007).
A Learning Analytic that encodes and reifies instructors’ individual expectations will better support reflective practice for instructors and allow students to more reliably meet those expectations. Currently, information is provided through analytics without directly taking into consideration an instructor’s unique practice or what their goals and expecta-tions may be (Sch¨on, 1987, Van Manen, 1995). Reflective practice is only useful insofar
as the information the instructor receives can help support or challenge his or her expec-tations. For instructors to effectively make observations that allow for reflection on their practice, learning analytics should present data directly related to their course expectations. As additional support to students, Sadler (1989) provides three conditions where students can benefit from feedback in academic settings. All of these rely on the transparency of course expectations and students understanding their own behaviors in relation to those expectations.
For reflective practice to take place, instructors should be aware of student behaviors in their class. To develop an analytic that supports this, the first phase of my research is a formative study with the goal of understanding current practice and the range of expectations instructors may have (Chapter 3). The results of this exploratory study will inform the design of my Learning Analytic. RQ1 and RQ2 are questions that I hope to answer through this initial exploratory study.
• RQ1-How do instructors currently conduct inquiry on student behaviors?
• RQ2-What expectations do instructors see as valuable to model within the context of learning analytics?
An expectation-centered analytic that translates the instructor’s expectations and re-quirements for the course will be developed taking into account the results of the first phase of the research study (Chapter 4). This analytic will aggregate data relevant to instruc-tors as opposed to instrucinstruc-tors independently synthesizing conclusions from multiple sources, which can be difficult to interpret (Elson, 2016). The expectations specified by instructors will also be made available to students. By implementing an expectation-centered ana-lytic, I can evaluate its effectiveness with regards to both supporting reflective practice for instructors and supporting students to answer several more research questions (Chapter 5):
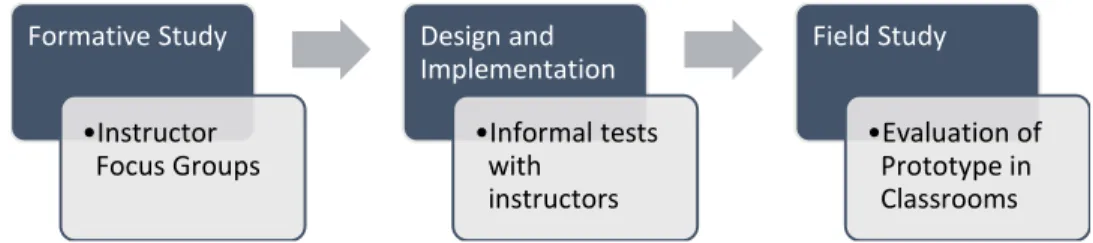
Formative Study •Instructor Focus Groups Design and Implementation •Informal tests with instructors Field Study •Evaluation of Prototype in Classrooms
Figure 1.1: An overview of the format of the study
• RQ3-How does instructor inquiry change with the presence of this analytic?
• RQ4-How do student behaviors change with the explicit presence of this analytic?
To answer my research questions, I conducted a set of studies within one iteration of design-based research (Barab and Squire, 2004, Collins et al., 2004). Design-based research is an iterative methodology that allows for interventions such as learning analytics to be studied in the learning environment as opposed to a laboratory setting. This allows for immediate impact on the classroom as well as gaining insight through each iteration that can inform both theory and practice. My research was done within the context of a single iteration of the design cycle of TrACE. I added to TrACE by creating design alternatives for analytics available in the system. Following this, I initiated a field deployment to evaluate the impact of these alternatives in classrooms. Finally, I conclude with contributions to both researchers and practitioners, limitations, and direction for future work. An overview of the methods for this thesis is included in Figure 1.1 and detailed further in Table 1.1.
T abl e 1.1: Summary of activities A learni ng an al yt ic t ha t encod es a nd r eifi es in stru ct o rs’ in di vi dua l exp ect at ion s wi ll be tt er su ppo rt r efl ect ive p ra ct ice for in st ructor s and a llow for stude nt s to mo re rel iab ly mee t sai d ex pec ta ti ons . Stu d y Ph as e Res ear ch Q ues ti ons Da ta col le ct ed Ana ly si s me th od Out co me H o w d o instru cto rs c u rren tly co n d u ct in q u iry o n st u d ent beha vio rs? -Questi o n s ask ed -Cu rren t w o rkfl o w -Ch an ges fro m r eflec tio n -Fo cus g ro u p s/ in te rv ie ws with in structo rs -In structo r acti vity data in anal ytics (frequ ency , t im e o n task , anal ytics used in a “sessi o n ”) -D esc rip ti ve Statis tics - Kruskal -Walli s t est to m easur e u sag e t rend s o ver ti m e - Af fin ity dia gra m o f tran scrip ts -M o st in struc to rs do no t acc ess an aly tics of ten o r spen d m u ch tim e in t h em -So m e an aly tics ar e m o re p o p u lar t h an o thers and b et te r sup p o rt in q u iry -Wo rkfl o w issu es in clu d e fr equ ent c o n te xt switc h in g, m ental c alcu lati o n , lac k o f ag grega tio n /h ig h -le vel vie ws , lac k o f acti o n ab le d ata What e xpect atio n s do ins tr u cto rs see as valu ab le t o m o d el within t h e co n te xt o f learn in g anal ytics ? Fo cus g ro u p s/ in te rv ie ws with in structo rs Af fin ity dia gram o f tran scrip ts - Expect atio n s m o stly r elat ed to v iew in g/ p o sting - Expect atio n s fo r v iew in g i s as si m p le as “ wat ch the v id eo b efo re cla ss ”. Oft en im p licit. -P o stin g ex p ectat io n s can b e co m p lex , as in structo rs w an t dif ferent k in d s o f c o llab o ratio n - Expect atio n s c an c h an ge o ver ti m e H o w d o es instru ct o r in q u ir y an d ex p ect atio n s c h an ge with t h e p rese n ce o f thi s anal ytic ? -In structo rs act iv it y d ata in an alyt ics - -(frequ ency , t im e o n task , anal ytics used in a “sessi o n ”) -L ist o f E xpect atio n s and related l o g data -Withi n -sub jec ts stud y - D es crip tiv e Stati stics -Wilco xo n sign ed -ran k te st an d Fis cher ’s ex ac t te st fo r An al ytic u sag e trend s o ver t im e - What ex p ec tat io n s we re m ad e -N o sig. dif feren ce in o vera ll d u ratio n o r frequ en cy b et we en se m est er s - Vi sit in g and t im e o n t as k we re st ill l o w fo r m an y -So m e in struc to rs shif te d t o v isi tin g e xp ect atio n an alyt ics m o re o ft en than o ther an alyt ic s -M an y ex p ec tat io n s w ere c o n sisten t thr o u gh o u t stud y peri o d H o w d o st u d ent beha vio rs cha n ge with the ex p licit p re sence o f t h is an alyt ic ? Stu d ent perf o rm an ce m easur ed as com pleted am ou nt req ui red am ount fo r w atchin g, po sting , an d qu iz -an swe rin g ex p ect atio n s -Withi n -sub jec ts stud y to c o m p are beha vi o rs with and w /o e xpl icit ex p ect atio n s -D esc rip ti ve st at s and Wilco xo n sign ed -ran k te st fo r p erfo rm an ce o ver ti m e in acti vit y data - Witho u t ex p lic it expect ati o n s, st u d ents we re w o rse at m eet in g po stin g e xpec tat io n s than o the r e xp ect atio n ty p es in all ca ses - With e xpl icit ex p ec tat io n s, t h ere w as no lo n ger a di ff erence - Onl y o n e co u rs e h ad sign ifican tly hig h er co m p lian ce to ex p ectat io n s
Chapter 2
Background and Related Work
To better understand where learning analytics can be improved with regards to promoting instructor reflection and increasing student activity in the classroom, the theoretical un-derpinnings for reflective practice and an overview of existing Learning Analytic systems is presented in this chapter. I also cover previous work conducted in TrACE which also contributes to the motivation for this thesis.
2.1
Theoretical Background
Learning analytics as a field is a combination of several different disciplines including action research, education, and educational data mining (Chatti et al., 2012), but in order to improve the quality of learning analytics, I focus on the theoretical underpinnings behind the learning analytics process, notably reflective practice and the learning analytics cycle.
2.1.1 Reflective Practice
Reflective practice is the process through which professionals conduct inquiry on and adjust their own behaviors during practice (Sch¨on, 1987). Although what defines reflection is still
widely debated (Larrivee, 2008, Luik et al., 2014), I present Sch¨on (1987)’s version of the reflective process as an active and iterative process consisting of the following stages:
1. Data collection- Observations on the current situation involving spontaneous and rou-tinized responses.
2. Surprise- The practitioner experiences an unexpected outcome from the data collection process that challenges their current knowledge.
3. Reflection- The practitioner considers the unexpected event as well as their current knowledge that led up to it.
4. Question structure- reflection on the thought processes that led up to this unexpected situation. Restructuring strategies of action, understanding, or framing of the prob-lem.
5. Experiment- Take new actions and explore the newly observed phenomena. This could yield the hypothesized results or lead to more unexpected outcomes and thus more reflection-in-action.
Reflective practice is not attempting to find standard solutions to any given problem, but uncovering the details of the problem through gradual discovery which eventually leads to interventions. It is a cyclical process that iterates between theorizing about the current situation and experimentation, intervention, and observation of the situation.
Traditional experiments involving hypothesis testing are controlled. In contrast, reflec-tive practice is a combination of exploration, move-testing, and hypothesis testing (Sch¨on, 1987). That is, the practitioner may intervene only to see what happens, may influence the situation with an intended outcome in mind, or simply observe if the outcome matches a predefined hypothesis. While the practitioner shapes the situation through interventions,
s/he remains open to the possibility that these interventions continue to produce unexpected outcomes. Using TrACE as an example, an instructor On the other hand, a failure in the reflective process occurs when the practitioner tries to completely control the situation. A failed reflective process includes set tasks where all input works solely towards that task. The instructor filters out evidence that could have led to reflection or changes in the class in favor of reaching predefined goals. Additionally, the practitioner may avoid being “wrong” and does not share information to other parties (such as students) that may influence the situation.
Let us consider two examples that might happen in using learning analytics. Two instructors believe that students who watch a video will learn more and do better on as-sessments. The first instructor wants students to watch the video and enforces this with participation points. In spite of students “watching” the content, test scores do not improve. The instructor continues to believe that students are not watching enough, and requires a higher percent of the video watched and assigns more participation points. The second instructor initially had the same requirement and also saw poor assessment results in her class. She uses the analytics and realizes that many students are watching the content, but many are fast-forwarding through the video. This causes the instructor to reconsider watching alone as a goal, and changed her goals to focus on comprehension instead. She adds automatic pauses and reflection prompts throughout future videos as an experiment to see if students will slow down and more closely consider the course content as they watch. The first instructor was not reflective and did not stop to reconsider if watching was the right expectation to have for students. The second instructor noticed a surprising trend, reflected, and adjusted practice accordingly.
one in which the instructor embraces it, are described as single and double-loop learning by Argyris and Sch¨on (1978). Single loop learning encompasses the behaviors wherein a practitioner focuses on achieving a set goal in the most efficient way. The goal is perceived as immutable and no reflection takes place. Either the goal is met or it is not. Conversely, double-loop learning occurs when the results of an initial action leads to questioning those initial goals and values and revising the underlying assumptions that started those actions in the first place. It is within double-loop learning that reflective practice takes place.
Reflective practice has been studied by many scholars in an attempt to characterize these different levels of reflection and create effective measures of reflective practice (Lar-rivee, 2008, Jay and Johnson, 2002, Sparks-Langer et al., 1990). Larivee defines four levels of reflection in practitioners:
1. Pre-reflection - no active reflection and the instructor does not adapt their own teach-ing based on the students responses and needs.
2. Surface reflection - An instructor’s strategies work towards a predefined goal, the instructor focuses on “what works” instead of considering instructional value of their goals.
3. Pedagogical reflection - The instructor reflects on their educational goals, the theories behind their approaches, and connects between theory and practice.
4. Critical reflection - An instructor considers the moral implications of their practice and reflects on their own beliefs and how it affects their expectations and teaching. These levels of reflection are present in other works as well (Jay and Johnson, 2002, Sparks-Langer et al., 1990) although often titled-differently (surface reflection to descriptive/initial
understanding and preflection to habitual actions) and have been validated in each re-searchers’ own educational contexts.
When applied to learning analytics, not only could an instructor use an analytic to reach his/her initially desired outcome, but through reflective practice, challenge and redefine those initial goals (Clow, 2012). Although reflective practice occurs personally and in situ, changes in expectations, actions, and goals could be external indicators of this process. Poor reflective practice would be observed as an instructor using the analytics for a fixed purpose that does not change throughout the semester, and not sharing or intervening with students based on the results discovered in analytics. In the next section, I discuss the learning analytics cycle which applies the theory and process of reflection-in-action to the context of learning analytics.
2.1.2 The Learning Analytic Cycle
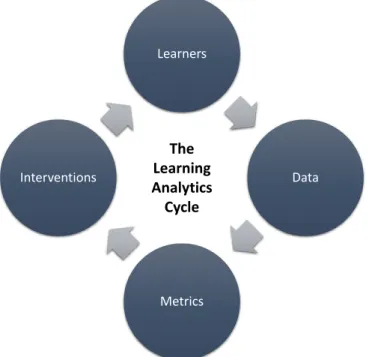
The learning analytics cycle is an iterative process that is used to engage learners in their educational environment. Reviewing it once again (Figure 2.1), I discuss the different elements of the process:
Learners can be students studying in a course or participants in informal education. Learning analytics both starts with and should affect learners.
Data can be about learners or generated by them. Examples include data traces such as demographics, posts, test results, and click-level activity data (e.g. interactions within TrACE or Blackboard). This data needs to be processed and interpreted.
Metrics/Analytics provide insight into the learning process. These can include tradi-tional dashboards, visualizations, or identifying specific students based on the data. These metrics inform the next step of the cycle.
Interventionshave some effect on the learners. Interventions can include a dashboard for the learners to reflect on their own actions, or take place when an instructor directly addresses high-risk students. It should be noted that intervention does not have to occur with the same group of students. Data from one semester could lead to an intervention in a new semester.
The data collected from the Learning Analytic Cycle may not be uniform or may come from multiple sources. It is imperative to the success of a learning analytic that the data is pre-processed (cleaned, integrated, transformed, etc.) before being presented in the metrics phase (Chatti et al., 2012). The goal of the metrics phase is to provide insight through previously unobservable patterns. In this way, the metrics supports the data collection phase in reflective practice, and also allows for the practitioner to more easily notice unexpected outcomes to initiate the reflective process. It is during this intervention phase of the learning analytics cycle that reflective practitioners (Sch¨on, 1987) reflect on their practice. Instructors can self-reflect on the effectiveness of their learning or teaching practice based on the results discovered in the analytics.
While not mentioned in the figure but mentioned in Chatti’s learning analytics process (Chatti et al., 2012), an additional post-processing phase is involved. This allows for con-stant improvement of the analytic process. This could involve collecting new data, refining the data, or looking at new analytics altogether. This ties back to reflective practice, as ideally an instructor should be able to manipulate the data available to them based on their new goals.
The Learning Analytic Cycle is a model for learning analytics that draws from educa-tion theory. The key step is ensuring that informaeduca-tion generated from learning analytics feeds back into learners via interventions. All design and development should be done with
Learners Data Metrics Interventions The Learning Analytics Cycle
Figure 2.1: The Learning Analytics Cycle
this model in mind. Clow (2012) claims the Learning Analytic Cycle “instantiates and en-ables reflective learning” in the intervention step, and understanding reflective practice can help us determine if these interventions do support instructor reflection. In theory, met-rics(analytics) should support reflective practice by allowing for quick observations related to course goals. These metrics should also be presented in a way that can bring attention to data that challenges those existing goals. This, in turn, should lead to reflection and changes in practice.
2.2
Implementation of Systems
Instructors and students are both primary stakeholders in learning analytics. However, most studies involving different stakeholder groups in learning analytics research target intelligent tutoring systems or researchers (78%) instead of students(12%) and teachers(18%) (Chatti et al., 2012). This research fills this gap in the literature to address the needs of students
and teachers for learning analytics. Usually, students generate the traces that become the data presented in an analytic dashboard, and the teacher (should) analyze this information to inform his or her practice. Thus, it is important to consider how learning analytics have been implemented for both instructors and students, and the research that has been performed for both groups.
2.2.1 Instructor-centered analytics
Guidelines for instructor-centered analytics emphasize that instructors should be considered in the design of learning analytics (Scheffel et al., 2014). The information most important for teachers include overall success rate, mastery of concepts, frequent mistakes, and sup-port for self-awareness and reflection (Scheffel et al., 2011). However, the current tools do not yet answer all the questions that teachers have in regards to the educational setting in which they are situated (Dyckhoff et al., 2013). In reality, current analytics are effective at answering questions about quantitative measures of use (what is the student doing?), but do not collect more complex information. More complex information can include qualitative evaluation(does the student like the system?), differentiation between groups of students, differentiation between learning offerings (is the student choosing online offerings instead of in-class?), data consolidation/correlation (What percent of the learning modules are stu-dents using?), and effects on performance (Dyckhoff et al., 2013). Other analytics that are not available include information about the instructor’s own actions or information from multiple data sources (Dyckhoff et al., 2013).
Some studies have looked into the qualities of effective learning analytics (Scheffel et al., 2014), and others have researched what instructors might want from learning analytics (Dyckhoff et al., 2013). Often, the target population of these studies have been Learning
Analytic researchers or instructors who have no prior experience with learning analytics. A challenge here is that it is difficult for participants to imagine features and tools they would like without having any prior experience (Gulliksen et al., 1999). Collecting data from these participants produces results that focus more on data collection, privacy, and acceptance of a learning analytic system (Scheffel et al., 2014) as opposed to instructor desires to better understand the learning process of students (Goodyear, 2010). Interviewing instructors who are already experienced users of learning analytics may yield more fruitful results. By collecting information from experienced users, we might gain more insight into the challenges these instructors face in practice that may not have been considered by researchers working outside of the classroom.
2.2.2 Student-centered analytics
Student-centered analytics allow for students to have self-directed and self-regulated learn-ing. Students should regulate their own performance in order to meet the goals and expec-tations of a course. Nicol and Macfarlane-Dick (2006) cite 7 ways that self-regulation can be supported in students:
• Clarify what good performance is. Students can only achieve goals if they know what these goals are in the first place.
• Facilitate self-assessment
• Give feedback information in relation to goals. Assist students in taking actions to bring themselves closer to accomplishing these goals.
• Encourage teacher and peer dialogue
• Provide opportunities to close the gap between their performance and success. Allow at-risk students to understand their behaviors and correct them as necessary.
• Use feedback to inform teaching, such as with reflective practice
Additionally, for students to benefit from feedback, they need to understand what good performance is for the course, how their current performance relates to ideal performance, and how to act to close this gap between their current performance and good performance. This emphasizes the need for making the expectations of instructors available to students through learning analytics. Learning analytics are not solely for the instructor or solely for the student, and making expectations clear can benefit both students and instructors in improving achievement in courses.
Several existing analytics attempt to provide students with information for self-reflection of their learning. Signals, a Learning Analytic from Purdue University, (Arnold, 2010, Arnold and Pistilli, 2012) manually collected student use data from a Learning Manage-ment System (LMS) and provided feedback on progress using a stoplight system. The goal of Signals is similar to mine: to provide analytics with actionable feedback. The presence of this information allowed students to make corrections as they realized they were off-track within the course, and students with this intervention sought help earlier. Faculty also saw that students were more proactive. Students expressed a desire for more specific informa-tion to how on-track they were, and instructors desired more acinforma-tion-oriented and helpful feedback beyond a good (green)/fair (yellow)/poor (red) metric.
Duval (2011) analyzed various learning analytics for students and emphasized that visualizations in relation to a goal can be more effective than by being presented as raw data. However, no explicit Learning Analytic examples were provided, although systems such as health trackers can be used as guidelines for goal-based analytics. While many
works focus on either student analytics or instructor interventions, none found talk about the intersection between the two, and even large scale literature reviews fail to find current systems that allow this kind of interaction (Dyckhoff et al., 2013). Overall, while students are provided with self-regulating information on their own actions, instructors are left with either basic information that does not truly inform their practice, or they are left out altogether by not being involved in the analytic process.
My contribution to this body of knowledge aims to “bridge the gap” through application and design guidelines between learners and instructors that use analytics. This motivates the creation of an analytic that allows for both the instructor to convey what they want to know from the student, and for the student to understand how their behaviors match with instructor expectations. Additionally, I aim to create an analytic that is informed by the learning analytic cycle model, which claims to support instructor reflection when followed (Clow, 2012). Finally, this research presents a unique opportunity to evaluate analytics both in the classroom context and with experienced instructors.
2.3
Preliminary Research
Preliminary research in TrACE informs and motivates the work of this thesis. A qualitative study consisting primarily of a thematic analysis of instructor journals and instructor inter-views was conducted by Elson (2016) to gain insight into instructor formative assessment practices. Several themes (Knowledge of Students,Actions, andLimitations/Shortcomings) and subcategories (Student Behavior Relative to Expectations) related closely to the work proposed in this thesis. To elaborate further, some of these categories are expanded on with qualitative examples.
First, Student Behavior Relative to Expectations was categorized as a subsection of
the Knowledge of Students theme. This section as described by Elson showed the ways
that TrACE enabled awareness of student performance relative to instructor expectations. Important factors here were the ability to quickly assess if assessments were met and being able to assess the class as a whole as well as individual students. These expectations covered the range of actions in TrACE (watching, posting, etc.) but instructors were very interested in knowing if students are meeting these expectations or falling short.
The Educator Action theme was described as the motivations behind instructional
change or intervention based on the insights/data presented to instructors through TrACE. Tying back to reflective practice or the learning analytic cycle, this would be the intervention that takes place as a result of evaluating if an instructor’s goals were being met. Just as in the other related work, Elson noted that these interventions could be with a single student, with the whole class, or with the next iteration of a course.
The final theme from Elson’s work that related to this thesis was the Limitations and Shortcomings presented by instructors with regards to the system. Educators advocated for system features to be available to students. Two of the six educators interviewed mentioned a desire for analytics students could view to help them know if they are doing what is expected of them. Elson proposed that such analytics would directly benefit instructors by encouraging students to interact with the system in a way that better meets instructor goals.
From this related work, there is an opportunity to create analytics that support re-flective practice for instructors. Also, specifying expectations and an expectation-centered analytic is something that instructors have expressed a desire to have in order to improve their practice. In the following chapter, I present a formative study that directly informs
Chapter 3
Formative Study
In order to assert the hypothesis A learning analytic that encodes and reifies instructors’ individual expectations will(1)better support reflective practice for instructors and(2)allow
students to more reliably meet said expectations, a three-phase study was conducted. A
formative/exploratory study is the focus of this chapter, and serves as a form of requirements gathering in which the results inform the design of an expectation centered analytic around instructor expectations. Future chapters build upon the study in this chapter by taking findings and developing an analytic prototype (Chapter 4) and evaluating said prototype (Chapter 5).
The goal of this formative study was twofold: (i) to offer some insight into some of the expectations instructors might have for their students and(ii)the extent to which analytics were meeting their needs in order to establish design guidelines for analytic development. To do so, I triangulated quantitative activity-log data of instructor use of TrACE from previous semesters along with data collected from a participatory design session (Kensing and Blomberg, 1998) involving instructors.
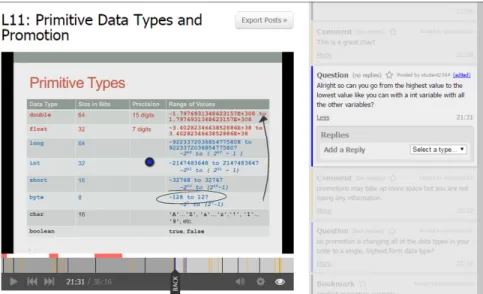
Figure 3.1: The video playback system in TrACE. Students can create annotations point-ing to specific video content
how TrACE works and how instructors and students may use it. Instructors upload videos to this platform for students to watch, and the system allows students to annotate and reply to annotations in videos (Figure 3.1).
As a part of this system, a collection of learning analytics were developed to allow for instructors to interpret student viewing behaviors. There are 8 analytics overall within
(a) Media Activity
(b) Session Summaries
(c)Percentage Viewed (d) Annotationmary Sum- (e) Viewing Summary
the system: Media Activity, Session Summary, Annotation Summary, Loyalty, Recency, Percentage Viewed, Viewing Summary, and View Count graph. Most of these analytics are at the video level for a single course and show activity for all students in that class unless otherwise specified. To better understand these analytics, I will briefly describe what questions instructors can answer and the visualization used. Screenshots of a subset of analytics are also provided (Figure 3.2).
Media Activity (Figure 3.2a)- For a single video it answers how many times, what parts, and when did students watch a video. It also shows how much time students spent and what actions they took while watching. These answers are summarized as a complex presentation of timestamps, view count numbers, and a video playback bar that fills in what portions of the video were watched in aggregate by students.
Session Summary (Figure 3.2b) (accessed via Media Activity)- For a video it answers similar questions to Media Activity (how long, how often, what actions did they take) but focused on a single student. It is presented as a list of sessions (from opening the video to leaving the video page) where each session contains a timeline with markers indicating what actions occurred.
Percentage Viewed (Figure 3.2c)- A pie chart showing what % of the video students watched.
Annotation Summary (Figure 3.2d)- Answers how many posts and replies did students make presented as a heatmap.
Loyalty - Answers how many times did students open a video also presented as a heatmap
Recency - Answers when was the last time students interacted with the video also pre-sented as a heatmap.
Viewing Summary (Figure 3.2e)- A check (yes) or X (no) answering if students opened the video.
View Count graph - A histogram showing how the number of views differ (between stu-dents, between videos, over the semester).
In order to understand instructor needs in both assessing students and reflecting on their own practice, I addressed the following research questions, outlined below:
• RQ1-How do instructors currently conduct inquiry on student behaviors?
• RQ2-What expectations do instructors see as valuable to model within the context of learning analytics?
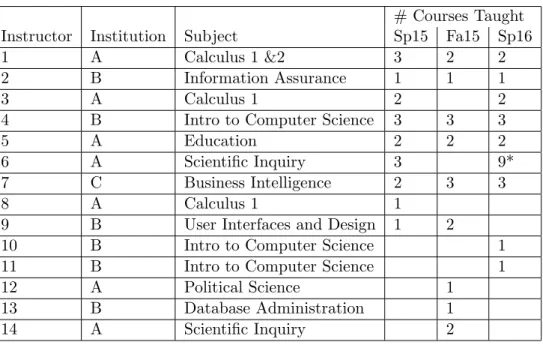
Table 3.1: Instructors using TrACE from 2015 to present
# Courses Taught Instructor Institution Subject Sp15 Fa15 Sp16 1 A Calculus 1 &2 3 2 2 2 B Information Assurance 1 1 1 3 A Calculus 1 2 2 4 B Intro to Computer Science 3 3 3 5 A Education 2 2 2 6 A Scientific Inquiry 3 9* 7 C Business Intelligence 2 3 3 8 A Calculus 1 1
9 B User Interfaces and Design 1 2
10 B Intro to Computer Science 1 11 B Intro to Computer Science 1 12 A Political Science 1
13 B Database Administration 1 14 A Scientific Inquiry 2
3.1
Methods Overview
The participants for this study included 14 instructors that used TrACE’s analytics from January 2015 to May 2016 (Spring ’15 to Spring ’16 in North American vernacular). Ex-cluding one instructor who did not use analytics, Table 3.1 includes basic information about the instructors, including how many courses they taught in the Spring ’15, Fall ’15, and Spring ’16 semesters. Instructors were assigned a random ID and course names were gener-alized for anonymity. The majority of these instructors had used TrACE prior to this study, so they may have already formed habits in their analytic use. This was a key distinction from many other studies on system use, which were tested with first-time users of learning analytics (Arnold and Pistilli, 2012, Muslim et al., 2016, Ali et al., 2012). These classes were small to medium in size, with the largest class having 59 students. There was a mix of undergraduate and graduate courses, the majority being in STEM disciplines with a few education and political science courses as well. On average, instructors taught 1.8 courses per semester with a maximum of 3 courses in any given semester (one instructor had 9 “courses” in the system, but this was a single class divided into groups). Some instructors taught multiple sections or taught the same course across multiple semesters with the same video content. During the study, instructors were given free reign over how the analytics were used, and they were only provided with an introductory tutorial on the analytics at the start of each term.
Fine grain data was collected on instructor analytic use within TrACE. This enabled me to analyze how instructors were using the system at the time, which analytics were preferred, and some basic patterns of behavior (having switched between many analytic screens or only looking at one). These methods are elaborated upon in Section 3.2. Although insights into instructor behavior were difficult to infer from the data alone, combining this with focus
group data provided a clearer picture of the context in which instructors conducted inquiry on their students.
The qualitative portion of this formative study included two 2-hour participatory de-sign (Kensing and Blomberg, 1998) sessions where instructors were invited to discuss their inquiry process and brainstorm analytic designs that would help support those inquiries. The first part of the design sessions was a focus group related to their expectations in courses that used TrACE, and the second consisted of a brainstorming and sketching ses-sion where instructors produced analytic designs. The methods for the qualitative portion are elaborated upon in Section 3.3.
3.2
Activity Data in TrACE
To answer my first research question, How do instructors currently conduct inquiry on student behaviors?, I analyzed the data from 14 instructors to find out:
• How often do instructors visit analytics?
• How long are instructors spending in analytics?
• Do instructors prefer some analytics over others?
• Is interaction consistent across semesters?
Logfile data that informed this study included which analytics were accessed, who accessed them, timestamps, and other action details (such as applying filters or closing reports).
To answer these first two sub-questions, the frequency and duration of analytic use were calculated for each instructor. An action was logged every time an instructor entered an analytic, took an intermediate action (e.g., changing filters, looking at different students, changing the video targeted for analysis), exited. If a session timed out (i.e. there were no
consecutive actions for at least 15 minutes) then the duration of that session was calculated using the timestamp of the last action recorded. Sessions with durations of less than one second were filtered out, as they were likely misclicks where the instructor would not have gained any useful information from the analytic. Duration data was not evenly distributed among instructors, so medians and non-parametric tests were used for my analyses.
To understand instructor changes in behavior, instructor analytic visit frequency was directly compared across semesters both in a raw form and as a ratio of Frequency/# Videos in all courses. I used a Visits to Videos ratio because an instructor may not have been teaching the same courses or using the same videos every semester. Finally, the frequency of visits was also split between each analytic in the system, and calculated as the proportion of total visits. For the duration of instructor visits, instructor data was not normally distributed, so a Kruskal-Wallis test was used to answer the last two sub-questions.
3.2.1 Results
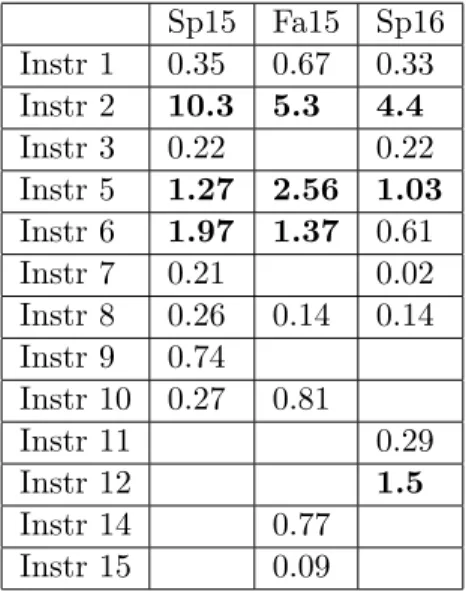
First, I wanted to answer how often instructors visited analytics through an analysis of the frequency of visits. The instructors used the analytics within TrACE 1268 times overall with a distribution of 494 sessions in Spring ’15 (39%), 410 sessions in Fall ’15 (32.3%), and 364 sessions in Spring ’16 (28.7%). How often instructors visit the analytics was not evenly distributed for any of the semesters observed. Table 3.2 presents how often an instructor visited any analytic normalized by the number of overall videos in their course. Instructors that visited more than once per video are in bold. 69.3% of instructors did not visit an analytic at least once per video, so the majority of instructors may be viewing multiple videos for each visit, or not viewing analytics for those videos at all.
Table 3.2: Frequency of overall analytic use normalized by number of videos in all courses Sp15 Fa15 Sp16 Instr 1 0.35 0.67 0.33 Instr 2 10.3 5.3 4.4 Instr 3 0.22 0.22 Instr 5 1.27 2.56 1.03 Instr 6 1.97 1.37 0.61 Instr 7 0.21 0.02 Instr 8 0.26 0.14 0.14 Instr 9 0.74 Instr 10 0.27 0.81 Instr 11 0.29 Instr 12 1.5 Instr 14 0.77 Instr 15 0.09
Table 3.3: Median duration (in seconds) instructors spent in all analytics. Instructors
with a significant difference in duration (p <0.05) are in bold
Sp15 Fa15 Sp16 Instr 1 6 18.5 42.5 Instr 2 19 17 20 Instr 3 52 24 Instr 5 42.5 61 58 Instr 6 35 28.5 83.5 Instr 7 31 35 Instr 8 8.5 33 38 Instr 9 11 Instr 10 35 44 Instr 11 35.5 Instr 12 70 Instr 14 27
Continuing to the next subquestion, I looked to then answerhow much time do
instruc-tors spend in analytics? Table 3.3 shows the median time instructors spent in the analytics
overall. This median was around 30 seconds overall for instructors, but this greatly varied (6 seconds up to 83.5 seconds). Regardless of the variation, it was apparent that most in-structors did not spend much time using analytics, and only three inin-structors had medians greater than one minute. Comparing frequency to duration, Instructors 4 and 11 stood out for having spent more time in the analytics and also visiting at least once per video. These
0% 10% 20% 30% 40% 50% 60% 70% 80% 90% 100% F A 1 5 S P 1 5 S P 1 6 F A 1 5 S P 1 5 S P 1 6 S P 1 5 S P 1 6 F A 1 5 S P 1 5 S P 1 6 F A 1 5 S P 1 6 S P 1 5 S P 1 6 F A 1 5 S P 1 5 S P 1 6 F A 1 5 S P 1 5 1 2 3 5 6 7 8 1 0
Annotation Summary Media Activity Percentage Viewed Loyalty Recency Session Summary Viewing Summary View Count Graph
Figure 3.3: Proportion of analytic use by instructor, compared across semesters. Excludes
instructors who only used TrACE for one semester.
users may have have developed a consistent procedure to analyze student behaviors in every video.
I next looked at whether instructors demonstrated a preference for some analytics over others. Five instructors in Spring ’15 (55.6%), one instructor in Fall ’15 (12.5%), and four instructors in Spring ’16 (44.4%) had the majority of their sessions in a single analytic. Combined, a third of all instructors had a majority analytic. Media Activity, Percentage Viewed, and Annotation Summary were the most popular analytics (Figure 3.3).
Preference can also be broken down by duration to determine if instructors also spend more time with some analytics over others. When performing a Kruskal-Wallis test to compare differences in duration between analytics within a semester, most instructors did
not have a significant difference in duration between analytics. This could be either because there were not many visits to the analytics individually in the first place, or there was no preference at all. Excluding two instructors that only use a single analytic, only 4/11 instructors showed a significant preference for an analytic in at least one semester. These 4 instructors were instructor 2 (X2(7) = 41.1, p <0.001) in Spring ’15, instructor 3 (X2(2) = 9.681, p = 0.008) in Spring ’15, instructor 4 in Fall ’15 (X2(7) = 34.3, p < 0.001) and Spring ’16 (X2(7) = 14.67, p = 0.04), and instructor 11 (X2(6) = 15.7, p = 0.015) in Spring ’16. To determine popular analytics (by duration, instead of frequency) I ranked the analytics by the mean usage (as duration) and calculated how many instructors spent the most time in that analytic. The results show that Media Activity (5), Percentage Viewed (3), Recency (2), Annotation Summary (2), and View Count Graph were used the longest. Media Activity and Percentage Viewed were also the most frequent, so some instructors were both dedicating more time and visits to these analytics.
To answer the final sub-question and understand if there were any differences between semesters, I compared frequency of analytic visits (visits per video) as well as duration (Kruskal-Wallis test). Instructors who visited often (at least once per video) continued to do so. Only one instructor who visited often decreased to less than one visit per video in a future semester. Instructors who did not view analytics often also maintained their trends; no instructor that viewed less than once per video ever changed their habits to visit more often than once per video. Another notable trend among all instructors who used analytics for multiple semesters was that from the Fall ’15 to Spring ’15 term, every instructor had visited the analytics either the same amount or less per video. This could be an indicator that instructors have plateaued in their use of analytics.
significant (p <0.05) difference in access (Instructors 1, 4, 5, 7). For instructors who spent more time in the analytics but visited less often, this could mean these instructors were analyzing more courses and videos in one sitting as opposed to shorter more surface level bursts. On the other hand, it could indicate that the analytics were complex and difficult to parse so more time was needed to understand them. These possibilities were kept in mind when interviewing instructors about their analytic use (Section 3.3).
It was becoming more clear that Percentage Viewed and Media Activity were commonly used by many instructors. In looking more closely at these specific analytics, I propose some possibilities as to why these analytics were so popular. Initially, the Viewing Summary and Percentage Viewed analytic seem to answer the same question (Did my students watch the video?). When directly comparing the two, Viewing Summary can be misinterpreted as a false positive, as just opening a video counts as a “watch” whereas Percentage Viewed is much more detailed and allows for the instructor to see how much content was viewed at a glance. Media Activity is a much more detailed analytic that can answer a variety of questions for instructors (i.e. When are my students watching?, How often are they watching?, What parts have they watched?). Two of these questions: when (Recency) and how often (Loyalty) are covered in other analytics that were not used as often by instructors. Media Activity allows instructors to find both pieces of information in one location.
Annotation Summary was another common analytic, and it is the only analytic de-signed to report on student posting behaviors. This makes it the only option available for instructors who want to know if students were participating without opening videos and reading individual posts from students. Which analytics were most used could also tie into expectations. If learning analytics support instructor intervention as related to their goals,
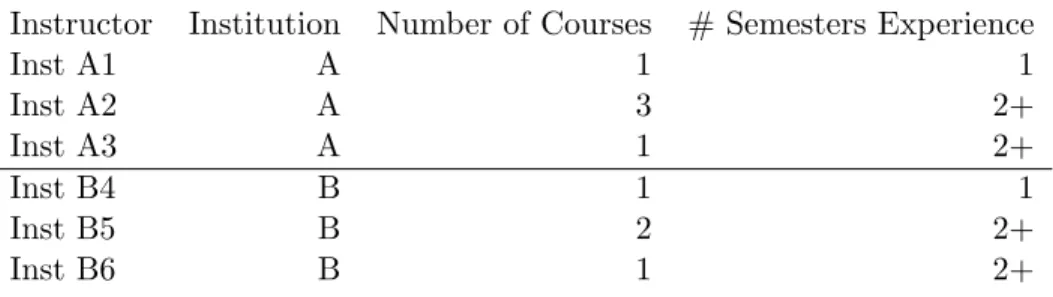
Table 3.4: Participatory Design participants
Instructor Institution Number of Courses # Semesters Experience
Inst A1 A 1 1 Inst A2 A 3 2+ Inst A3 A 1 2+ Inst B4 B 1 1 Inst B5 B 2 2+ Inst B6 B 1 2+
certain analytics may be tied to specific expectations of students (watching, posting, or oth-erwise). While most instructors did not have a clear preference for an analytic, these more commonly used analytics could hint at the questions that instructors were most interested in answering about their students and the types of expectations that instructors had. The following qualitative study explored these questions and instructor needs more in-depth.
3.3
Qualitative Study
In Spring 2016, two 2-hour participatory design sessions were conducted with three in-structors each at Institution A (A metropolitan doctoral university in the Midwest) and Institution B (a medium-sized residential private university in New England)(Table 3.4). All instructors who had used TrACE over the past calendar year were invited via email to participate and were compensated for their time with Amazon gift cards. Of these 13 instructors, 6 total instructors had accepted the invitation. Four of the six instructors had also taught the courses from the Fall 2015 student surveys reported on earlier. A descrip-tion of the methodology for this participatory design session will be split between the focus group and the rest of the design session.
3.3.1 Focus Groups
Instructor Expectations-What expectations do you have for your students, and how do these expectations relate to your overall goals for the course?
Evaluation of Expectations-To what extent are you aware that students are meeting the
expectations? How confident are you that your students are meeting this expectation?
Clarity of Expectations-To what extent do you enforce these expectations of students?
How do students know what the expectations are?
Changes in Expectations-How have your expectations changed since you’ve started using
TrACE?
The focus group was transcribed and analyzed to extract examples of expectations, goals motivating these expectations, and how these expectations were situated within the classroom context. Results of these focus groups were transcribed and analyzed to expose the range of expectations that instructors may have for their students. Affinity diagramming (Beyer and Holtzblatt, 1999) is a form of contextual inquiry through which work activity notes, or details on the instructor’s current workflow were extracted and grouped. These groupings were then labeled and used to better understand the general needs, problems, functional requirements and nonfunctional requirements that the system needs to fulfill for these users.
3.3.2 Participatory Design Session
Following the focus group, instructors were shown aggregate data represented as graphs of the Spring 2015 data. The two graphs included data on frequency over the course of a semester, and the duration in the various analytics of TrACE. They were asked about their initial interpretations of the data as well as how this reported data relates to or contrasts their current use of TrACE. Transcripts from this portion of the session were analyzed to
extract instructor descriptions of their current use of the system, hypotheses for past system use, and rationale for their current system use. Comments such as “We’re getting tired at the end of the semester. There’s a lot of stuff going on” and “There are a little bit complex metrics and sometimes I don’t have the time to process what you’re telling me. So I tend to use them very infrequently” were examples of what statements were extracted.
Next, instructors were asked to report on questions that they have about student behavior. The questions asked to prompt instructors are included below:
• What are some questions you have thought about students in the class you’re teaching that uses TrACE?
• As a teacher using TrACE, how does the answer to this question help you?
To answer the first prompt, each of the instructors came up with a list of questions individ-ually. Then, they collaborated and reduced the list to 6 questions which they thought were of top priority and that encapsulated most of their areas of concerns. The second prompt was then shown to instructors. Individual responses were placed next to the corresponding question. Instructors selected their top priority questions and, in groups, they were asked to sketch out what an analytic or visual aid would look like that would help answer a given question. The instructors worked with the researchers/developers in sketching out their ideas on paper. There were three smaller sketching sessions that lasted 15 minutes, for a total of 45 minutes. After the sketching session was complete, instructors explained their sketches to the other participants and researchers/developers for another 20 minutes.
Artifacts from the participatory design session included the exhaustive list of questions and rationales generated by instructors and the sketches created as a result of the design session. Partial transcripts from audio recordings documented the experience. During
sketching sessions and when conversations overlapped, transcripts were supplemented by field notes from the three researchers present.
3.3.3 Results
Table 3.5 is the exhaustive list of the questions that instructors asked along with how it would be useful for them. One question was excluded due to the fact that it was not posted as a question, instructors could not provide reasons for how it would be useful to them, and it was not selected for sketching.
In the first participatory design session, instructors sketched either alone or in a pair, with pairs rotating for each sketch. This produced 5 designs in total covering 5 questions. One group had reworked an existing sketch a second time, so there was one fewer sketch than the intended six. In the second design session, only a single SMART board was available for sketching. The SMART board could accommodate two participants at once, so all three participants worked together to design analytics from three questions. Although all of the designs were analyzed, a sample of the designs are presented here. These samples were chosen because they embodied many of the common responses and needs instructors had throughout this study. There were several questions posed that related to improving the quality of their course and supporting their goals (such as developing a community of learners), but did not easily translate to an analytic that an instructor could use.
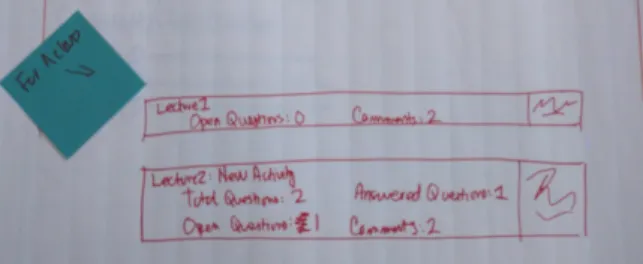
Some of the analytics sketched by instructors focused on the student view and new functionality within TrACE as opposed to a visualization the instructor could use in an analytic. One example of this was a design answering the question “What would get the students more engaged to the content and community?”(Figure 3.4). The rationale behind this was that there was a need for students to know their status on videos in order to get
Questions How it can be helpful
Is this lecture useful/engaging? Feedback over time and semesters on video content Let's me know if the lecture should be changed to increase comprehension
Allow me to rework lectures or portions of lectures to better serve students
Are students engaged when watching the video?
Students need to pay attention to do well
Know if students are exhibiting passive vs. active learning See that students are committed to what I'm trying to teach
Where I need to change vs. where the student needs to change
Are my students confident in the subject matter?
Feedback on student performance
Help identify students that may need additional help with material
Allow me to guage proficiency but also how solidly they believe in their knowledge
What would get the students more engaged to the content and community?
ID barriers to community participation ID barriers to understanding video content Help alter delivery of content such that it is more meaningful and interesting to students
Tailor in-class activities or online interactions What are barriers to them asking questions
and how to address them
Be able to encourage student interaction Does a reply really answer the question
that was posted?
Do I need to answer the question again or clarify further Are students asking good questions and/or helping each other?
What are student misconceptions? Tailor my intervention in the flipped lab What information needs to be added to lectures Where do students have confusion [while
watching a video]
Tells you what you are going to teach in class based on where students are confused
Where I should clarify more for next iteration How much time do students spend on the
material?
Commitment and effort in independent learning Tells me how valuable mat'l is to them. Attitude of students throughout the course
Did the material do what I thought it would do (in terms of commitment)
Are students revisiting or reflecting on the material at some point?
Know what information is valuable to them
Indicators of higher level thinking and deeper reflection Gauge critical thinking
Are students watching videos with enough time to reflect and integrate before class?
Use to talk to students about their study habits
Figure 3.4: An analytic to answer “What would get the students more engaged to the content and community?”
them more engaged. The sketch was a textual representation of students’ status on the video list page. Students could get an idea for the number of comments they posted, number of questions left to answer, and class averages in comments and questions. Although useful and important to an instructor, there was a lack of design for what the instructor could observe about the student.
(a) A reorganization of the
analytics focused on a single student overview
(b)Report quiz results from students in aggregate
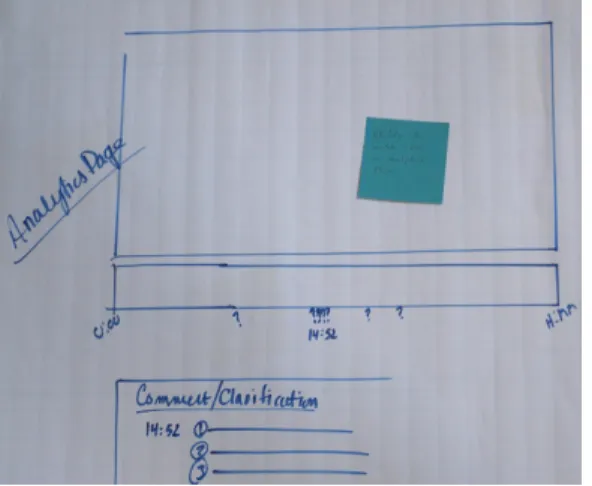
Figure 3.5: An analytic to answer “What are student misconceptions?”
Figure 3.5 represents the need for instructors to have varying