Title Determinants of the Size and Structure of Corporate Boards: 1935-2000
Author(s) Lehn, Kenneth; Patro, Sukesh; Zhao, Mengxin Citation
Issue Date 2008-04
Type Technical Report Text Version publisher
URL http://hdl.handle.net/10086/15748 Right
Center for Economic Institutions
Working Paper Series
Center for Economic Institutions
Working Paper Series
Institute of Economic Research Hitotsubashi University
2-1 Naka, Kunitachi, Tokyo, 186-8603 JAPAN Tel: +81-42-580-8405
Fax: +81-42-580-8333 e-mail: [email protected]
CEI Working Paper Series, No. 2008-13
“ Determinants of the Size and Structure of Corporate Boards: 1935-2000 ”
April 2008
Determinants of the Size and Structure of Corporate Boards: 1935-2000
Kenneth Lehn
a, Sukesh Patro
b, and Mengxin Zhao
cDecember, 2007
Corresponding author: Kenneth Lehn
Katz Graduate School of Business
University of Pittsburgh Pittsburgh, PA 15260 Phone: 412-648-2034 Fax: 412-624-2875 E-mail: [email protected] a
Katz Graduate School of Business, University of Pittsburgh, Pittsburgh, PA 15260; bCollege of Business Administration, Kansas State University, Manhattan, KS 66506; cMcCallum Graduate School of Business, Bentley College, Waltham, MA 02452. We thank Jeffrey Coles, David Denis, John H. Evans III, J. Harold Mulherin, Anil Shivdasani, Shawn Thomas, participants at the UNC-Duke Corporate Finance Conference 2004 , the CEPR-SITE workshop on Understanding Financial Architecture: On the Economics and Policies of Corporate Governance at Stockholm 2004, the 12th SFM conference in Taiwan, the EFMA 2005 annual meeting and workshop participants at Arizona State University, Chinese University of Hong Kong, University of Delaware, Northeastern University and the Securities Exchange Commission (SEC) for their comments.
Determinants of the Size and Composition of Corporate Boards: 1935-2000
Abstract
We argue that the size and composition of corporate boards are determined by tradeoffs involving the information that directors bring to boards versus the coordination costs and free rider problems associated with their additions to boards. Our hypotheses lead to predictions that firm size and growth opportunities are important determinants of these board characteristics. Using a sample of 82 U.S. firms that survived over the period of 1935 through 2000, we find strong support for the hypotheses. The hypotheses also find support in the relation between changes in board size and firms’ merger and divestiture activity, and changes in the geographical diversification of firms. We find no robust relation between firm performance and either board size or composition after accounting for the determinants of these board characteristics.
JEL Classification code: G32, G34
Key words: Board size, board composition, mergers and acquisitions, firm size, growth opportunities, diversification, geographical diversification, firm performance, and endogeneity.
1. INTRODUCTION
Much of the scholarly literature and public discourse on corporate governance in recent years has focused on the size and composition of corporate boards of directors. Many scholars, regulators, and investors argue that corporate boards should be small and comprised largely of independent directors. Scholarly research is often cited to support this position, including papers documenting an inverse relation between board size and firm value, and others documenting a relation between proxies for the independence of boards and firm performance.
In both the scholarly literature on boards of directors and the public debate over corporate governance, explicit recognition that the size and composition of boards emerge endogenously has gathered momentum only recently.1 If there are tradeoffs associated with different board sizes
and compositions (we presume there are) and if capital and product markets provide incentives for firms to maximize value (we presume they do), then we expect firms to choose board sizes and compositions that are suitable for their circumstances, at least on average. This perspective leads us to the following question – is the observable variation in the size and composition of boards consistent with value-maximizing processes?
Adopting the view that boards are endogenously chosen, this paper examines the size and composition of boards for a unique sample of firms – 82 publicly traded U.S. firms that survived over the period of 1935 through 2000. We deliberately choose these firms because they have survived for so long, suggesting to us that their governance structures are likely to be appropriate for their purposes.2 We document how the boards of these companies evolved during 1935-2000
and test hypotheses about the factors affecting their size and composition. Our analysis reveals the following main results:
1
Some early exceptions are Williamson (1975), Fama and Jensen (1983) and Hermalin and Weisbach (1998).
2
o Board size is directly related to firm size and inversely related to proxies for growth opportunities.
o Insider representation on boards is inversely related to firm size and directly related to proxies for growth opportunities.
o Some persistence exists in both board size and composition, beyond what the variables in our model predict, suggesting the possibility of path dependence in board structure. o Changes in board size over time are directly related to merger and acquisition activity undertaken by the firm and these changes tend to reverse, although not completely, in the years subsequent to the merger.
o Board size and changes in board size are positively associated with past changes in the degree of geographical diversification of the firm’s business. However, insider representation does not seem to be visibly affected by these changes.
o Industry shocks, measured as the fraction of firms with the same SIC codes (as the sample firms) that get delisted due to merger and acquisition activity, lead to decreases in board size.
o No robust relation exists between firm performance and either board size or insider representation after accounting for the endogeneity of board structure to firm characteristics.
The results support the proposition that board size and composition are determined endogenously in ways consistent with value maximization. The results suggest caution in interpreting empirical evidence that purports to draw causal links between board variables and firm performance when board variables are treated as exogenous (for example, Yermack (1996)). They also suggest that a “one size fits all” approach to board size and composition is misguided (similar to Coles, Daniel, and Naveen, 2007), since a large part of the considerable variation in board size and composition is explained by variables such as firm size and growth opportunities, suggesting an underlying economic logic at work in determining board structure.
Our results contribute to the recently growing literature that theoretically models (Harris and Raviv 2008, Raheja 2005 and Adams and Fereira 2006) and empirically examines (Boone, Field,
Karpoff, and Raheja 2007, Coles, et al 2007 and Linck, Netter, and Yang 2007) determinants of board size, composition and control and their relation with firm performance. The approach in this paper is complementary to that of the recent empirical papers in that we work with the same research question using a significantly longer time period and a significantly smaller sample. The similarity of our results to regularities already documented in the literature, despite the significant differences in approach, occasion a reiteration of the call by Harris and Raviv (2008) that “…empirical work on corporate board size and composition (should) take the endogeneity issue seriously”.
The rest of the paper is organized as follows. Section 2 develops hypotheses and reviews relevant literature. In Section 3 we describe the data set and present descriptive statistics for the key variables. Section 4 presents regression results of the determinants of board size and composition. Section 5 re-examines the relation between board structure and its determinants by relating changes in these determinants to changes in board structure that occur around firms’ merger and acquisition transactions. Section 6 examines the relation between board characteristics and firm performance. Section 7 discusses the results and provides concluding comments.
2. HYPOTHESES AND REVIEW OF RELEVANT LITERATURE
Boards of directors serve two general functions. First, they advise managers about a firm’s business strategy (Williamson (1975), Fama and Jensen (1983)), which we refer to as the advisory function of boards. Second, they monitor the performance of managers (Fama (1980), Hermalin and Weisbach (1998), Monks and Minow (2000)), which we refer to as the monitoring function of boards. We take the perspective that the costs and benefits of the two functions are likely to vary across firms in ways that result in systematic relations between the attributes of firms and the size and composition of their boards.
A. Board size
Several scholars have asserted that small boards operate more effectively than large boards because of the high coordination costs and free rider problems associated with large boards. For example, Lipton and Lorsch (1992, 65) argue that “[w]hen a board has more than ten members it becomes more difficult for them all to express their ideas and opinions.” Similarly, Jensen (1993, 865) conjectures that “keeping boards small can help improve their performance. When boards get beyond seven or eight people they are less likely to function effectively […]”.
In a recent theoretical paper, Harris and Raviv (2008) trade off the benefits of greater expertise with more outside directors against the costs of an aggravated free-rider problem to arrive at an optimal number of outside directors on the board. Their model provides an alternative, non-causal explanation for an observed correlation (negative or otherwise) between firm profits and board size. Raheja (2005) develops a model which trades off the higher agency costs of greater insider representation on boards against the higher co-ordination/information costs of greater outsider representation. Raheja’s (2005) model predicts that smaller boards are not more useful unconditionally – for example, they are likely to be more useful in highly competitive industries.
In empirical studies Baker and Gompers (2001) report that board size is increasing in asset tangibility for a sample of U.S. firms conducting initial public offerings (“IPOs”) and Mak and Roush (2000) find an inverse relation between board size and growth opportunities for a sample of New Zealand IPOs. More recently, Coles et al (2007); Linck et al (2007); and Boone et al (2007) model board size and composition as functions of asset characteristics and firm governance characteristics. The combined findings of these papers support the model-based predictions.
Linck et al (2007) find that board size decreases in a firm’s growth opportunities and stock return volatility and increases with firm size. Boone et al (2007) track firms for ten years after the IPO and find that board size increases with firm size and diversity. Coles et al (2007) report similar findings regarding the determinants of board size. They then specifically examine the relationship between the market-to-book ratio of firms and board size. Their results lead them to the conclusion that “certain classes of firms are actually likely to benefit from larger boards […]”.
We take the perspective that there are tradeoffs associated with different board sizes, tradeoffs that are likely to vary across firms and industries. The major advantage of large boards is the greater collective information that the board possesses about factors that affect the value of firms, such as product markets, technology, regulation, mergers and acquisitions etc. This information is valuable for both the advisory (Haleblian and Finkelstein (1993)) and monitoring functions of boards.
The major disadvantages of large boards are the coordination costs and free rider problems referred to above. We presume that coordination costs increase in board size. Economic analyses of constitutional democracies typically cite the costs of making collective decisions with the entire population as the raison d’etre of representative government. Buchanan and Tullock (1974) generalize this to all cases of collective decision-making, stating that “the expected costs of organizing decisions, under any given rule, will be less in the smaller unit than in the larger.” The free rider problems associated with large boards stem from the observation that the average influence of a board member varies inversely with board size. With less influence, board members have reduced incentives to bear the private costs of investing in information and actively monitoring the firm’s managers. Just as the free rider problem among stockholders increases with
the diffusion of stock ownership, the free rider problem among board members increases as the board becomes larger.
We take the perspective that the choice of board size is governed by the tradeoff between the aggregate information that large boards possess and the increased costs of decision-making associated with large boards. We examine two attributes of firms that are likely to affect this tradeoff, and hence, the optimal size of boards: firm size and growth opportunities.
Firm size. We expect a direct relation between the size of firms and the size of their boards. Large firms are, by definition, engaged in a higher volume of activities than small firms. In addition, large firms are likely to be engaged in a greater diversity of activities than small firms, such as operating in different product and geographic markets, engaging in more merger and acquisition activity, using more sophisticated financial and marketing techniques, and so forth. Because of the higher volume and greater diversity of activities, large firms have more demand for information than do small firms, including information about product markets, foreign markets, mergers and acquisitions, technology, and labor relations.
As an illustrative example, consider the cases of Wal-Mart and Cost-U-Less, two companies that operate retail discount department stores. Wal-Mart, with a market capitalization of $197
billion and 1.9 million employees, has 15 members on its board.3 Cost-U-Less, with a
corresponding market capitalization of only $44 million and 600 employees, has only 6 members on its board.4 In addition to being substantially larger than Cost-U-Less, Wal-Mart is engaged in
more diverse activities. Whereas Cost-U-Less is quite focused, operating 11 warehouse clubs only in island markets, Wal-Mart is quite diverse, operating thousands of stores of various formats in the U.S. and many foreign markets. In addition to its retail operations, Wal-Mart owns a food
distribution subsidiary. We presume that the greater size and diversity of Wal-Mart’s activities accounts for most of the difference in the size of the two companies’ boards and therefore we predict a direct relation between the size of firms and the size of their boards. In our empirical tests, we check for nonlinearity in this direct relation. To enrich the measurement of firm size, in addition to its market capitalization, we measure firm size by the geographical spread of the firm’s operations and the number of unrelated business segments within the firm.
Growth opportunities. We expect an inverse relation between growth opportunities and board size for two reasons. First, it is widely accepted that the costs of monitoring managers increase with a firm’s growth opportunities (Smith and Watts (1992), Gaver and Gaver (1993)). As a result, the free rider problem associated with large boards is more severe in firms with high growth opportunities. In order for board members to have sufficient private incentives to bear the high monitoring costs in high growth firms, boards must be small.
Second, firms with higher growth opportunities generally require nimbler governance structures. Since these firms are usually younger and operate in more volatile business environments than low growth firms, they require governance structures that facilitate rapid decision-making and redeployment of assets. By more volatile business environments, we refer to markets characterized by frequent technological change, unstable market shares, rapidly changing relative prices, and so forth. As the costs of altering corporate strategy in response to these factors is likely to be inversely related to board size, we expect that the more volatile the environment in which a firm operates, the smaller will be its board.5 This argument is consistent with the
5
Kole and Lehn (1999) find that board sizes of airlines declined after the industry was deregulated in 1978, which is consistent with our hypothesis since deregulation creates less stable business environments, thereby enhancing the value of both nimbleness and the monitoring function of boards. Frye & Smith (2003) similarly find that regulated firms, which have less need for nimble boards, increase their boards more than unregulated firms following initial public offerings.
empirical findings of Cheng (2007) that larger board size is associated with less variable firm performance.
To illustrate how growth opportunities could be related to board size we consider the example of two companies with different growth opportunities, Honeywell, a diversified manufacturing firm, and Genentech, a biotechnology company. Honeywell generally would be viewed as a lower growth company than Genentech. This is borne out by various proxies for growth opportunities. For example, the ratio of the market value of Honeywell’s equity to the book value of its equity is 5.2, compared with a corresponding ratio of 7.3 for Genentech. Honeywell has a market capitalization of $47 billion, versus $80 billion for Genentech, making Honeywell considerably smaller than Genentech, at least in terms of market capitalization.6 All
else equal, this would tend to cause its board to be smaller than Genentech’s.
Notwithstanding the size difference in the two companies, Honeywell’s board is much larger than Genentech’s. Honeywell has 12 directors, including only one inside director. Despite its size advantage, Genentech’s board with only 7 members is considerably smaller than Honeywell’s, which, we hypothesize, gives it a nimbler governance structure and stronger incentives to monitor. Both of these features of small boards are expected to be valued more highly at Genentech, which has higher growth opportunities and, presumably, more information asymmetries. This is also consistent with the homogeneity and technical expertise of Genentech’s board members (four of them hold PhD’s, another an M.D., and one has a Doctor of Law degree).
B. Board composition
The early literature on corporate boards mainly focused on board composition i.e. board independence. Although results from early empirical tests were mixed, Lipton & Lorsch (1992) suggested that there be a ratio of at least two independent directors for every potentially affiliated
director. Jensen (1993) argues that since inside directors will be virtually ineffective in critically evaluating the CEO they should not find place on the board and the only inside director on the board should be the CEO.
Hermalin & Weisbach (1998) develop a bargaining model in which the board’s independence as a monitor evolves as a function of the bargaining power of the CEO (increased by successful past performance) and the incumbent board. Raheja (2005), whose model takes into account both the monitoring and advising roles of the board, finds that outsider dominated boards may be more optimal in firms with lower information costs. However, value considerations in firms where insider information is critical could optimally yield insider dominated boards. In a similar vein, Harris and Raviv (2008) use a model of board control (rather than fraction of insiders/outsiders) to show that when insiders have important information relative to outsiders, insider-controlled boards are preferred and in fact outsider-controlled boards may be value-destructive. Interestingly, Adams and Ferreira (2007) model a potential conflict between the dual roles of the board i.e. monitoring and advising, to show that management friendly boards can be optimal.
Consistent with the models discussed above, in empirical work Bathala and Rao (1995) document an inverse relationship between growth opportunities and the proportion of boards consisting of outsiders. Linck et al (2007) find that board independence decreases in a firm’s growth opportunities and stock return volatility and increases with firm size. Similarly, Boone et al (2007) and Coles et al (2007) find that board independence increases with firm size and diversity. Further, Coles et al (2007) conclude that “certain classes of firms are actually likely to benefit from […] boards with more insider representation”.
6
We have two hypotheses regarding the determinants of board composition based on the same two firm characteristics, size and growth opportunities, that we suggest as determinants of board size.
Firm size. The potential for agency conflicts between managers and shareholders is expected to increase in firm size (Barclay and Smith (1995a, b)). The principal reason for this is that the percent of equity held by top managers is expected to vary inversely with firm size. In addition, larger firms may have greater agency costs of free cash flow (Jensen (1986)) and less transparency with respect to the performance of its individual units (Scharfstein (2000), Scharfstein and Stein (2000)). We expect a direct relation between the independence of boards and firm size as a means to mitigate the agency problems associated with firm size.
Growth opportunities. The information asymmetries associated with high growth firms, as discussed before, are expected to affect board composition. First, information asymmetries impair the ability of outside directors to fulfill their advisory function in high growth firms. Either the outside directors make decisions based on less information than their counterparts in low growth firms, or they incur high costs of obtaining information to allow them to make more informed decisions. Perhaps the major way of obtaining the information is through discussions with the firm’s CEO. However, the opportunity cost of the CEO’s time is especially high for high growth firms, making this a highly inefficient means of mitigating information asymmetries. Furthermore, since the director also serves a monitoring function, the CEO may have incentives to obscure certain types of information. For this reason, we expect an inverse relation between growth opportunities and the proportion of boards consisting of independent directors.
Relatedly, high growth firms require more nimble governance structures than their low growth counterparts, for reasons discussed above. One of the major costs of an outsider
dominated board in firms with substantial information asymmetries is that the board’s decision-making is likely to be deliberate, not nimble. Since the optimal exercise of flexibility options often requires speedy decisions, insider domination of boards may be desirable for high growth firms.
The costs associated with the monitoring function of boards also differ for high growth versus low growth firms. Myers (1977) argues that agency costs can be fairly high for high growth firms as managers have greater flexibility with regard to future investments and a greater potential for wealth transfers from potential investors to inside owners (Gaver and Gaver (1993)). To mitigate the potential agency problems associated with high growth firms one might expect to find greater representation of outside directors on boards of high growth firms. On the other hand, the information asymmetries that raise the costs of external monitoring of managers are likely to result in higher insider ownership of equity (Holmstrom (1979), Smith and Watts (1992)). If so, higher insider ownership of equity is likely to result in less demand for outside directors on the board. If insider ownership of equity is a more effective remedy for the agency costs associated with information asymmetries in high growth firms, then high growth firms are likely to have more insider representation on boards. This is ultimately an empirical issue.
To summarize, we expect board size and insider representation on boards to evolve in ways consistent with value maximization. This leads us to the predictions that (i) board size is directly related to firm size and inversely related to growth opportunities and (ii) insider representation on boards is inversely related to firm size and directly related to growth opportunities.
We test our predictions in two settings. First, in Section 4 we use panel models to relate firm characteristics to board size and insider representation. Then, in Section 5 we relate the changes in board size and insider representation to M&A activity undertaken by the sample firms.
3. SAMPLE AND DESCRIPTIVE STATISTICS
A. Sample and data
To test the hypotheses discussed in the previous section, we compile time series data for a sample of manufacturing firms that survived from 1935 through 2000. The sample consists of all firms in the Center for Research on Security Prices (“CRSP”) database which survive from 1935 through 2000 and for which data is available in the Moody’s Industrial Manual. We deliberately impose a high survivorship requirement since firms that survive over long periods of time are presumed to have governance structures that are appropriate for their circumstances. Also, the longer time period facilitates examination of firms’ boards over intervals that are sufficiently long to allow these firms to make visible adjustments in their board structure (we use five-year intervals to measure board structure).
However, the sample selection criterion also imposes multiple constraints on our empirical tests. First, the reduction in sample size that results due to the survivorship requirement considerably reduces cross-sectional variation in asset and governance characteristics. Second, the sample extends to a period in which accounting data (pre-1950) and governance data (pre-1980) are meager and not easily available. Although we somewhat overcome the second constraint by hand collecting the data, the database thus created is by no means as rich as the usual datasets employed in empirical studies of governance (the specific details of our data set including certain standard data items that are not available to us are discussed below), We believe that the net effect of our sample selection criteria forces us to proceed in a setting of empirical parsimony in which we significantly bias ourselves against systematic findings.
There are 134 firms in the CRSP database that survive from the period 1935 through 2000.7
We search the Moody’s Industrial Manual for these firms. If a firm is not in the Manual for at least half the sample period i.e. 7 out of 14 sample years we exclude the firm from the sample. This reduces our sample size to 82 firms (list in alphabetical order is in Appendix A). Not surprisingly, the sample includes many prominent large U.S. corporations, such as General Electric, Procter & Gamble, and Coca-Cola, as well as smaller companies such as Tootsie Roll Industries, Foster Wheeler, and L.S. Starrett. The companies span a wide range of manufacturing industries, including coal mining, oil and gas extraction, food and kindred products, tobacco products, chemical and allied products, petroleum refining, electronic and other electrical equipment and components etc.
Accounting and board information is collected from various editions of Moody’s Manuals.8
Although COMPUSTAT data is available from the early 1950s, we use Moody’s as the source of accounting data throughout the sample period to maintain consistency in the reporting of these data. We collect data at 5-year intervals beginning with year 1935 (then 1940, 1945 and so on). We collect the following board data items from the Moody’s Manuals for each firm in each sample year: (i) the number of directors, (ii) the number of inside directors (that is, directors who are or were officers of the firm). The Moody’s Manuals do not provide adequate information to consistently classify directors as “gray” (or not), as is customary in the literature on boards.9
However there is sufficient information to consistently identify insider directors. As a result, in
7
Of all the firms that were listed in the CRSP database as of December, 1935, about 59% were eventually delisted due to a merger, 35% were delisted due bankruptcy related reasons and the remaining 6% were delisted for other reasons.
8
Prior to 1955, Moody’s Manual was titled “Moody’s Manual of Investments and Security Rating Service”. Post 1955, there are several editions of Moody’s Manual including Moody’s Bank and Finance manual, Moody’s Industrial Manual, Moody’s Municipal & Government Manual, Moody’s Public Utility Manual, and Moody’s Transportation Manual. Our data is primarily collected from Moody’s Industrial Manual.
9
As defined in Hermalin and Weisbach (2001), inside directors are employees and former employees of the firm; outside directors are not employees of the firms and usually do not have any business ties to the firm aside from their
this paper we measure board composition as the percentage of the board consisting of inside directors.
The recent literature on boards, both theoretical (Hermalin & Weisbach 1998, Raheja 2005) and empirical (Boone et al, 2007 Linck et al 2007, Coles et al 2007) has focused on the interaction of ownership structure (CEO and director ownership) and board structure. In our sample this is an interaction that remains unexplored due to the severe constraints on the availability of ownership structure data for our sample period.10 To account for the effects of this unavailable data and other
un-modeled firm specific effects we mainly rely on firm-fixed effects models to test our hypotheses.
We also collect the following accounting, M&A, business segments, and geographical diversification data items from the Moody’s manual for each sample year: (i) total sales, (ii) total assets, (iii) property, plant and equipment, (iv) book value of equity, (v) book value of long term debt, (vi) book value of preferred stock, (vii) operating profits (viii) number of acquisitions and divestitures in the preceding five-year period (ix) the number of unrelated businesses that the firm is engaged in and (x) the geographical diversification of the firm’s domestic operations. Geographical diversification of the firm’s operation is measured as the number of states in which the firm has manufacturing or storage facilities or both. For retailing firms in the sample such as Foot Locker, Philips Van Heusen etc we use the number of states with store locations. Due to significant cross-sectional differences in how geographical information is reported by Moody’s we limit its use to fixed-effect panel models where within-firm changes are used to explain variation in board characteristics.
directorship; “gray” directors are those directors who are attorneys or business persons having long standing relationships with the firm.
A number of variables frequently used in the literature are not reported consistently in the Moody’s manual and thus do not enter our regression specifications. These include proxies for the extent of growth opportunities (R&D and advertising expenditures) and the dollar values of the acquisitions (divestitures) undertaken.
We use monthly stock prices from CRSP to calculate market values of equity. In the spirit of Mitchell & Mulherin (1996) we measure industry shocks as the fraction of firms that are delisted from the CRSP database due to mergers, measured annually at the 2-digit SIC code level and then summed over the preceding five-year period. Data on inflation which is used to deflate dollar-denominated variables is obtained from the Bureau of Labor Statistics (U.S. Department of Labor) website. Complete data for all 14 years exists for 76 firms of the 82 firms.
B. Descriptive statistics
Table I reports descriptive statistics for the key variables by year.
Panel A displays the mean and median of sales, book value of assets and market value of equity. All values are reported in constant 2000 dollars. Mean and median equity value grow substantially over time, from $2.2 billion and $476 million, respectively, in 1935 to $32.1 billion and $6.9 billion, respectively, in 2000. Similar patterns exist for sales and book asset value.
Panel A also reports descriptive statistics of three measures of growth opportunities: (i) market-to-book value of assets, (ii) market-to-book value of equity and (iii) the ratio of property, plant and equipment (PPE) to the book value of total assets. The variables show an increase in growth opportunities from 1935-1965, a decline in growth opportunities from 1965-1980, and an increase in growth opportunities from 1980-2000. For example, the median market-to-book value of assets increases, in a non-monotonic way, from 1.3 in 1935 to 1.7 in 1965, declines to 1.1 in
10
Holderness, Kroszner and Sheehan (1999) is the only paper that we are aware of that examines the ownership structure of U.S. firms in a period comparable to ours. They use a dataset of officer and director ownership of over 1500
1980, and increases to 1.5 in 2000. There is a similar and more pronounced pattern in the market-to-book value of equity. The ratio of property plant and equipment to total assets, which is inversely related to growth opportunities, declines from 0.389 in 1935 to 0.315 in 1965, increases to 0.366 in 1980, and falls to 0.282 in 2000. Hence, all three measures reflect considerable variation in growth opportunities over time.
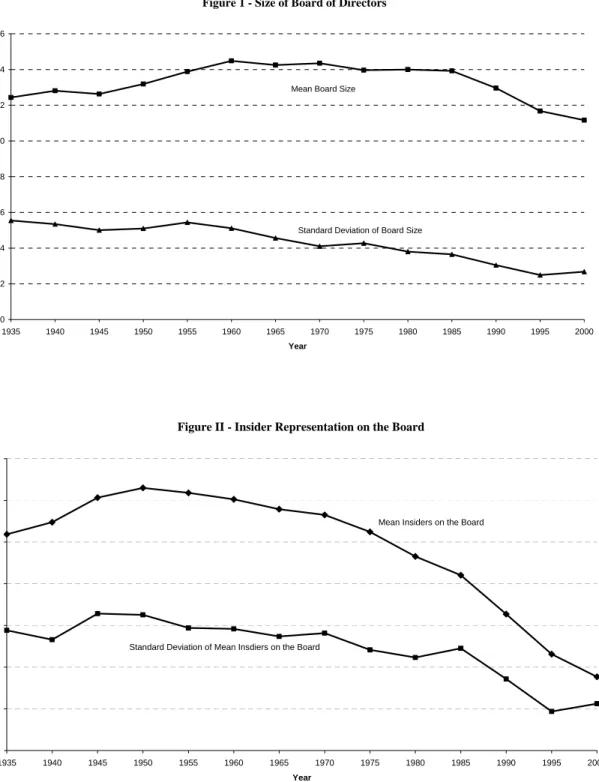
Panel B of Table I provides descriptive statistics for the board variables. Median board size increases from 11 in 1935 to a peak of 15 in 1960, and declines rather steadily thereafter to a low of 11 in the most recent year, 2000. Mean board size reveals a similar pattern, peaking at 14.48 in 1960 and taking its minimum value of 11.16 in 2000. Mean board size is substantially lower in 2000 than it is at the beginning of the sample period in 1935, when it takes the value of 12.43.11
The firms in our sample (mean asset size in 1995 of approximately $19 billion) are on average larger than those in Linck et al (2007) (mean asset size of $1.6 billion). In line with this difference in firm size the average board size of our sample is also much higher (11.68 compared to 7.5). A similar comparison holds between our sample and that of Coles et al (2007) – our sample mean sales of $16 billion in 1995 compared to their average of $4.1 billion and mean board sizes of 11.64 and 10.4 respectively.
An interesting pattern exists in the standard deviation of board size – it declines substantially and rather steadily from 5.545 in 1935 to 2.682 in 2000. Similarly, the coefficient of variation in board size also decreases almost monotonically, from 0.45 in 1935 to 0.24 in 2000. These data strongly suggest a convergence towards smaller boards over time. This might have occurred because the firms in the sample became more similar over time, although the cross-sectional U.S. corporations in the 1930s maintained by the SEC.
11
standard deviations in firm size and growth opportunities suggest otherwise, or more likely because firms mimic best board practices from other firms, resulting in less variation over time.
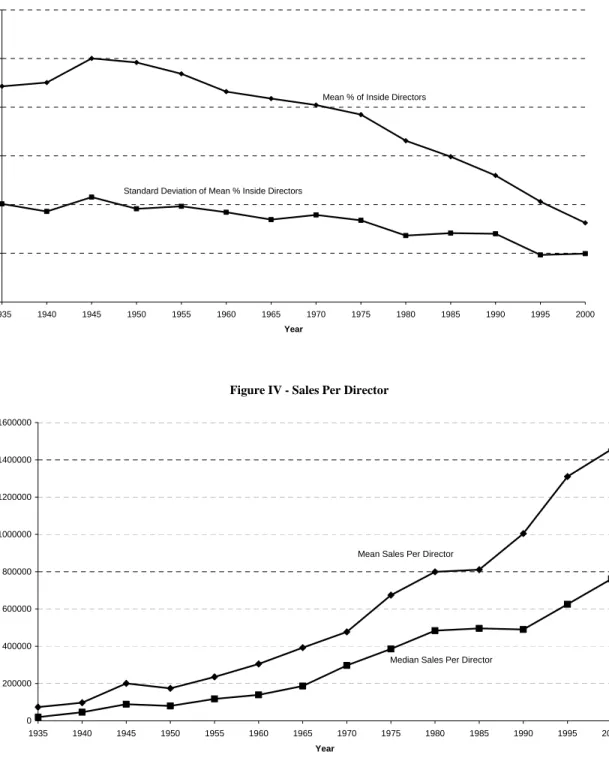
A clear pattern exists in the representation of insiders on boards over time. The mean number of insiders increases from 5.19 in 1935 to approximately 6 throughout the 1950s and 1960. Since 1960, the mean number of insiders has declined steadily, from 6.03 in 1960 to 1.77 in 2000. This decrease of 4.36 in the average number of insiders in the 1960-2000 period is actually larger than the decrease of 3.32 in average board size over the same period, indicating that the decrease in board size over this period is mainly due to a decrease in the number of insiders. Unlike board size, however, board composition does not display a converging pattern over time. The standard deviation of the number of insiders declines from 2.881 in 1935 to 1.123 in 2000, but the coefficient of variation increases from 0.556 in 1935 to 0.636 in 2000. Figures I, II and III plot the mean and standard deviation of board size, the number of insiders and percentage of insiders on the board.
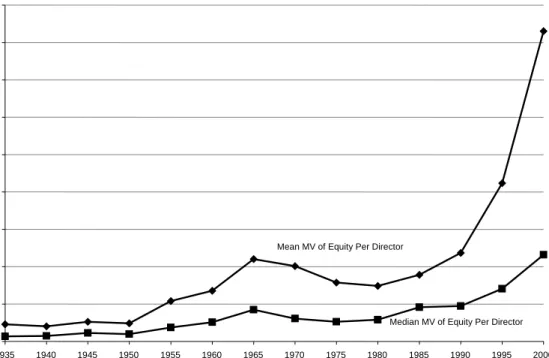
Although board size follows a hump pattern over the period of 1935 through 2000, we observe sharp and monotonic increases in the ratio of firm size to the number of directors over this period. Panel C of Table I reports summary statistics for sales per director, assets per director and market value of equity per director, all expressed in constant 2000 dollars. The median equity value per director increases rather steadily from $40 million in 1935 to $254 million in 1965, declines to less than $200 million during 1970-1980, and then increases steadily to $696 million in 2000. The mean value of this variable shows even more growth, increasing from $137 million in 1935 to $2.5 billion in 2000. Similar results hold for the mean and median values of sales per director and assets per director. We infer from these data that the responsibilities of directors, and the complexity of their work, have increased substantially over time. Figures IV and V show how
per-director sales and market capitalization have evolved during the sample period. Panel C also reports the degree of industrial and geographical diversification of the firm’s operations. The number of unrelated business segments increases from a mean of 1.297 in 1935 to 2.724 in 2000 with the largest jump occurring between 1955 to 1960 (from 1.608 to 2.014) a period generally accepted as the beginning of the conglomerate merger wave. The change in the number of business segments remains at a substantially higher level thereafter and until 1985. After this we see the only two declines in this measure, from 1985-1990, and from 1990 to 1995, a period that coincides with the refocusing merger wave of the 1980s. The measure of geographical diversification shows an almost monotonic increase from a mean (median) of 6.3 (4) states in 1935 to 18.2 (13) states in 2000.
Table II reports data on the serial correlation of board size (Panel A) and insider representation (Panel B). Most of the correlations in Panel A are high and significant at the 1% level or better. In addition there are some interesting patterns. The correlation coefficients of board size in year 1935 with other years (column 2) decrease from 0.936 (year 1940) to 0.270 (year 2000). A similar pattern holds for other years. Also, the correlations of one period lags (for example, year 1935 with year 1940, year 1940 with year 1945, and so on) decreases over time (for example, from 0.936 for year 1935 with year 1940 to 0.615 for year 1995 with year 2000). This data are consistent with the conjecture that although there is some path dependence in board size, it has become less pronounced over time.
Panel B of Table II reports the corresponding correlations for the number of inside directors. The data reveal a similar pattern as the one detected for board size – there is a decreasing trend in the serial correlations as the time period gets longer and the correlation between one-period lagged values declines over time. These results are consistent with the view that there is some
path dependence in board composition, although this also has become less pronounced over time. We examine the persistence of board size and composition in more detail in the regression analyses discussed in the next section.
4. FIRM SIZE, GROWTH OPPORTUNITIES AND BOARD STRUCTURE
To test the hypotheses that board size and composition are determined by firm size and growth opportunities, we estimate a series of firm-fixed effects regression models on the panel data consisting of the 82 firms over the period from 1935 through 2000. Since we measure the values of the variables at five-year intervals, we have 14 observations per firm, except for four firms for which some data were not available.12 We use a firm-fixed effects model to account for
persistent firm-specific determinants of board structure (for example, whether the firm is family-owned, ownership characteristics, and the like) which are not modeled in our analysis.
The independent variables of interest are firm size and growth opportunities. In the reported regression results we use the market value of equity as the proxy for firm size (Mkt. Cap.).
Regressions with sales and the book value of assets as the proxies for firm size yield similar results. Growth opportunities are measured by the ratio of the market to book value of assets (MTB Assets) and the ratio of property plant and equipment to total assets (PPE Ratio). These independent variables enter the equation in natural log form. Consistent with arguments presented by Hermalin & Weisbach (1988) we include the number of unrelated businesses that the firm is engaged in (# of business segments), as a control variable. Similarly, we include the geographical diversification of the firm’s operations (Geographical Spread) in both the board size and composition equations. The regression results are displayed in Table III. Panel A of Table III
12
We are unable to find ITT Industries (1940-60 and 1990), NL Industries (1945, 1955, 1985-1995), Inco Ltd. (1945, 1955, 1975 and 1985-00) and Schlumberger Ltd. (1975 and 1985-00) for different years in our sample period. Missing years are indicated in the parentheses. For the missing firm-years we use Compustat data if available. The results are robust to the exclusion of these observations.
reports panel model estimates for board size. The coefficients on the market value of equity are positive and significant at the 0.05 level or better in each model, supporting the hypothesis that firm size is directly related to board size. This result is consistent with the results of Boone et al (2007), Coles et al (2007) and Linck et al (2007). This variable alone explains almost 60% of the variation in board size.13 Column (1) shows that a strong nonlinear relation exists between market
value of equity and board size, with board size attaining a maximum value when market value of equity is approximately $250 billion. Although, the negative sign on firm size beyond a market capitalization of $250 billion is a bit puzzling, there are very few observations with market capitalizations above this level. Also this result conforms with the observation that firm size exhibits considerably more variation than board size14 and is consistent with the general argument
in the literature that beyond a relatively low number of board members, the coordination costs and free rider problems associated with additional board members are prohibitively large, regardless of firm size.
Both proxies for growth opportunities enter with the anticipated signs and are significant at the 0.01 level or better. When the market value of equity is specified linearly, the coefficients on MTB assets and the PPE ratio are -0.043 and 0.039, respectively, and both are significant at the 0.05 level. The absolute value of the coefficient on MTB assets is higher than the coefficient on the market value of equity, indicating that board size is more elastic with respect to this measure of growth opportunities than it is to firm size. Unlike the case for firm size, we had no a priori
view that a nonlinear relation exists between board size and growth opportunities and none was found in a regression model (result not tabulated). The coefficients on MTB assets and PPE ratio do not change appreciably when the proxy for firm size enters the equation in nonlinear form.
Taken together the results indicate a robust relation between growth opportunities and board size. When we account for the potential effects of secular trends on the relationship between board size and firm size and growth opportunities, by including time dummies for each five-year period in the sample. The overall results remain unchanged with only a slight increase in the adjusted r-squared from 62% to 65% (Column 4). Finally, when we include the number of business segments, the coefficient is insignificant. However, geographical diversification has a positive and significant coefficient (at the 1% level).
Panel B in Table III shows the regression results for models of insider representation (the percentage of board members who are inside directors). The coefficient on the market value of equity, when it is specified in linear form (Column (2)), is -0.051 and significant at the 0.01 level, consistent with the hypothesis that firm size is inversely related to insider representation on boards. The nonlinear specification (Column (1)) reveals that insider representation is actually increasing in firm size until the market value of equity reaches $40 million and then it declines (only 2% of the observations have market capitalizations of less than $40 million).
The panel also reveals a highly significant relation between growth opportunities and insider representation, in the direction that we anticipate. The coefficient on MTB assets enters the model with a positive coefficient that is significant at the 0.01 level (Column 2 and 3). The coefficients are 0.073 (Column 2) and 0.064 (Column 3), on par with the coefficients on the proxy for firm size. The strong association between this proxy for growth opportunities and board composition supports the hypotheses developed in Section 2 and is consistent with the results of Boone et al (2007), Coles et al (2007) and Linck et al (2007).The coefficients on PPE ratio have the anticipated negative sign but are generally insignificant. The number of business segments is
14
For example, firm size in 2000 ranges from $7.7 million (Raytech Corp) to $475 billion (General Electric), a multiple of 60,000. Yet, board size ranges from 4 (Tootsie Roll) to 21 (Exxon Mobil), a multiple of only 5.
positively and significantly related with the percentage of insiders, but the coefficient of geographical spread measure is insignificant.
As discussed earlier, both board size and board composition show a high degree of serial correlation, suggesting the possibility of path dependence in these board characteristics – an issue that has received little empirical attention in the literature due to lack of time-series data on boards. To examine this in more detail, we include lagged values of board size in the board size regressions and lagged values of insider representation in the insider representation regressions as independent variables. If board size and composition are path dependent, then significant and positive relations should exist between the contemporaneous and lagged values of these variables, after controlling for firm size and growth opportunities.
Panel A of Table IV contains results from 13 separate regressions in which the dependent variable is the natural log of board size in 2000. In each regression we include the nonlinear specification of the market value of equity and the two proxies for growth opportunities, MTB assets and PPE ratio, as independent variables.15 In each of the 13 regressions, a different lagged
value of the board size variable is included as an independent variable. For example, in one regression 1995 board size is included as an independent variable, in another 1990 board size is included etc. The results reported in Panel A are consistent with the conjecture that there is some path dependence in board size. The coefficients on both the 1990 and 1995 lagged values of board size are approximately 0.39 and both are highly significant, indicating a fairly high elasticity of board size with respect to board size up to ten years earlier. Inclusion of the 1995 and 1990 board sizes increases the adjusted R-squared about 8% over the adjusted R-squared of the model that does not include lagged board size (results not reported), further indicating the high degree of
inter-temporal correlation in board size. The coefficient drops to 0.245 for 1985 board size, but it remains highly significant.
Panel B of Table IV contains the corresponding results for insider representation on boards. The results show that inclusion of the 1995 lagged value of insider representation to the model compared with the model including no lagged values of insider representation increases the adjusted R-squared from 10.82% (result not reported) to 31.37%, indicating a high degree of serial correlation. The coefficient on the 1995 value of insider representation is 0.502 and highly significant, indicating a high correlation of insider representation over the five year interval. The coefficient on the 1990 lagged value of insider representation drops substantially to 0.166, and is significant at the 0.05. None of the other lagged values of insider representation are significant, indicating substantially less serial correlation, and perhaps less path dependence, in insider representation than in board size.
5. ARE CHANGES IN THE SIZE AND COMPOSITION OF BOARDS ASSOCIATED
WITH M&A AND DIVESTITURE ACTIVITY?
A major reason why a firm’s size and growth opportunities change over time is that the firm changes its asset mix through mergers and acquisitions (M&A) and divestitures. In this section we examine whether M&A and divestiture activity is associated with changes in the size and composition of boards. To measure M&A and divestiture activity of the firms in our sample over 1935-2000, we consult Moody’s Industrial Manual, which reports the history of acquisitions and divestitures of each company listed in the manual. We read this history for each of the 82 firms in our sample to collect data on the number and transaction values of (i) mergers and acquisitions in which the firm acquired another firm, or a division, subsidiary or certain assets from another firm and (ii) divestitures involving spin-offs, carve outs, asset sales, or sales of subsidiaries and divisions. We then aggregate the number of these transactions for every five-year interval during
1935-2000 to match the board data. Because dollar values are reported for only about 25% of the transactions our analyses are based on the number of acquisitions/divestitures rather than the value of these transactions.
Mitchell and Mulherin (1996) and Mulherin and Boone (2000) show that industry shocks are a primary cause of merger and divestiture activity. In addition to causing such activity these industry shocks could also explain governance changes.16 To examine this impact we calculate a
measure of industry shocks following Mitchell and Mulherin (1996). For each year in our sample period we calculate the fraction of firms that are taken over in the same 2-digit SIC code industry as the sample firm. We then calculate the sum of this fraction in the preceding five years for each sample firm-year. We use this as an explanatory variable for examining the effect of industry shocks on board size and composition.
Table V reports the yearly distribution of board structure and M&A transactions. The mean and median number of acquisitions, number of divestitures, and net number of acquisitions are reported for each five-year interval. The number of acquisitions and divestitures follows a pattern over time that is similar to the one displayed by board size. The mean (median) net number of acquisitions generally increases from 1935 to 1970 and generally declines thereafter. We do not find a similar pattern between insider representation on boards and the net number of acquisitions. Figures VI and VII plots board size and insider representation respectively (expressed in percentage form using 1935 as the base year), alongside the mean number of acquisitions, divestitures and net number of acquisitions over the sample period.
To test whether a significant relation exists between changes in board structure and M&A/divestiture activity, we estimate a set of panel regressions in which changes in board size and insider representation are regressed on, among other independent variables, measures of
M&A/divestiture activity. The contemporaneous change in board size (insider representation) is calculated as the difference in board size (insider representation) at the end of year t minus the board size (insider representation) at the end of year t-5. M&A/divestiture activity and industry shocks are also similarly computed over the period from year t-5 to year t. To examine the permanence of the changes that occur in board structure we also examine the subsequent change in board size (insider representation) computed as the change from year t to year t+5.17
Panel A of Table VI reports panel estimates of changes in board size. The independent variables of interest are the net number of acquisitions (Columns 1-4) and alternatively, the industry shock measure as an independent variable (Columns 5-8). Also included in the model are the change in the market value of equity, the change in the market-to-book ratio of assets, the change in the PPE ratio, and changes in the degree of industrial and geographical diversification, all computed from the previous period (year t-5) to the current period (year t).
Column 1 shows a significant (at the 0.01 level) positive relation between the contemporaneous change in board size and the net number of acquisitions. This result is robust to inclusion of the variables in the multivariate model. More acquisitions relative to divestitures lead to increases in board size, consistent with the hypothesis and the evidence documented above that firms adapt their board size to their asset size. This result is also consistent with the findings of Boone et al (2007) who find that mergers tend to increase the board size of IPO firms. Also, the results show that increases in the geographical spread of firm operations are also significantly associated with increases in board size – the coefficient of 0.0529 on the change in geographical spread is significant at the 1% level.
16
We thank an anonymous referee for this suggestion.
17
Column 3 shows a significantly negative (p < 0.01) relation between the subsequent change in board size and M&A activity. This suggests that the increase in board size due to net acquisitions is not permanent and may be necessitated to fulfill a temporary increase in monitoring and advisory needs around mergers. The magnitude of the coefficient at 0.017 is substantially smaller than the corresponding coefficient obtained for the contemporaneous change in board size of 0.030 suggesting that the reversal in board is not complete. The result for the extended model in Column 4 is very similar to the result in Column 3. Also, the positive and insignificant coefficient on the geographical diversification measure shows that there isn’t a similar reversal associated with increases in board size due to greater geographical diversity in firms’ operations.
Columns 5-8 report regression results of the effect of industry shocks on contemporaneous and subsequent changes in board size. We find that similar to M&A activity at the firm level, subsequent to industry shocks there is a decrease in board size (Column 7 and 8). However, different from M&A activity measured at the firm level, the contemporaneous change in board size is also significantly negatively related to industry shocks in a univariate setting (Column 5). This result is not robust to the inclusion of the other variables in the extended model (Column 6). The decrease in board size due to industry shocks is consistent with Kole and Lehn’s (1999) finding that airline firms decrease their board size after deregulation. Kole and Lehn (1999) argue that this is in order to facilitate a quicker response to the market forces of a deregulated industry. Similar to the model’s that use M&A activity measured at the firm level, Column 6 shows that changes in geographical diversification are significantly associated with increases in contemporaneous board size and do not affect subsequent changes in board size.
Panel B of Table VI reports the corresponding analyses for the change in the percentage of insiders. There is no significant association between the change in percentage of insiders and the net
number of acquisitions made by the firm. This is true of both the contemporaneous as well as subsequent change in the percentage of insiders. The lack of significance is similar to the finding of Boone et al (2007) of the insignificance of a merger variable (indicating a merger in the previous period) in predicting board independence. In a univariate setting industry shocks are significantly negatively related to both the contemporaneous and subsequent change in the percentage of insiders (Columns 5 and 8 respectively). However, these results are not robust to the addition of the changes in firm size and growth opportunities to the model.
6. REVISITING THE RELATION BETWEEN FIRM PERFORMANCE AND THE
SIZE AND COMPOSITION OF BOARDS
Previous literature has documented a relation between different measures of firm performance and the size and composition of boards (for example, Yermack, 1996, Hermalin and Weisbach, 1990). The experimental design in these studies treats the attributes of boards as being exogenously determined. Boone et al (2007), Coles et al (2007) and Linck et al (2007) treat board characteristics as endogenous variables. Further Coles et al (2007) specifically estimate the relationship between Tobin’s Q, board size and board composition simultaneously. Their estimation yields results that suggest that the relationship between firm performance and the structure of boards differs based on characteristics such as firm complexity.
To examine whether the relation between firm performance and board characteristics is affected when board characteristics are treated as endogenous variables we first report results for a fixed effects regression model in which firm performance is the dependent variable and board characteristics are treated as exogenous variables. We then report results from two-stage least squares (2SLS) estimates, in which board size and composition are treated as endogenous variables.
Table VII reports results from fixed-effects models in which firm performance is regressed on, among other variables, the size and composition of boards. Two measures of firm performance are used: (i) the ratio of the market value of assets to the book value of assets and (ii) operating margin (the ratio of operating income to sales).18 Independent variables include a proxy
for firm size (either firm market value or sales) and either board size or the percentage of insiders. When the market-to-book ratio serves as the dependent variable, we also include operating margin, the PPE ratio and subsequent sales growth (measured as the natural log of the ratio of realized sales five years hence to sales in the contemporaneous year) as independent variables.
Panel A of Table VII reports the results for the model in which the dependent variable is the market-to-book ratio. When firm market value (sales) is used as the proxy for firm size, the coefficient on board size in is negative and significant (insignificant), consistent with Yermack (1996). Board composition enters with a positive and significant coefficient, indicating a direct association between the percent of insiders on the board and market-to-book ratios, when the proxy for firm size is firm market value. When the proxy for firm size is sales, the coefficient on board composition is not significant. Panel B presents the corresponding results for models in which operating margin serves as the dependent variable. The coefficient on board size is negative and insignificant. The coefficient on board composition is positive and significant at the 0.01 level. We next examine whether the results in Table VII change significantly when board size and composition are treated as endogenous variables.
B. Treating board characteristics as endogenous
Table VIII presents results from a two stage least squares (“2SLS”) model in which the dependent variables are board characteristics and firm performance. In Panel A, we estimate in
turn, the determinants of board size and market-to-book ratio, and the determinants of board size and operating margin in two sets of simultaneous equations. Because the market-to-book ratio is playing the role of a performance measure in the second equation where it is the dependent variable, in the board size equation, where it was originally used as a proxy for growth opportunities, we replace it with an instrumental variable. Specifically we use the lagged market-to-book ratio (i.e. the market-market-to-book ratio five years ago) as the proxy for the extent of growth options.19 In the performance equations we include the subsequent sales growth as a proxy for the
extent of growth options.
Panel A shows that the lagged market-to-book ratio and firm size enter the board size equation with significant coefficients that have the anticipated signs. The coefficient on the lagged market-to-book ratio of -0.071 is comparable to -0.061, obtained when the contemporaneous market-to-book ratio is used (Table III, Column 3) thereby suggesting that it is a suitable instrument. The estimated coefficient on board size in the market-to-book equation is positive and marginally significant. In the operating margin equation board size is insignificant. The absence of a negative relation between board size and firm performance is inconsistent with the view that smaller boards improve firm performance. Panel B shows the corresponding results for the percentage of insiders. Again, both the lagged market-to-book ratio and firm size enter the board composition equation with coefficients that are significant and have the anticipated signs. The coefficient on board composition is marginally positive (10% significance level) in the market-to-book ratio equation and insignificant in the operating marginal equation. These results are inconsistent with the view that more outside directors cause increases in firm performance.
7. DISCUSSION AND CONCLUSION
19
We find that two variables, firm size and growth opportunities, explain a large amount of the cross-sectional and intertemporal variation in the size and composition of boards. Board size increases in firm size and decreases in growth opportunities, whereas insider representation decreases in firm size and increases in growth opportunities. Net acquisitions lead to board size increases that are partially reversed subsequently. Industry shocks lead to decreases in board size. The results suggest that an underlying logic, one consistent with value maximization, explains the variation in board size and composition.
The evidence on the endogeneity of board size and composition has important implications for both the scholarly literature on boards and the public discourse on reform of corporate boards. First, many scholarly empirical papers treat board characteristics as exogenous and infer from their results that certain board sizes and compositions cause differences in firm value and other measures of firm performance (for example, Yermack (1996), Eisenberg, Sundgren and Wells (1998)). In light of our results, and other studies that attempt to account for the endogeneity of board characteristics (Hermalin and Weisbach (1991), Bhagat and Black (1999), Boone et al (2007), Coles et al (2007), Linck et al (2007)), we are skeptical that one can infer causality from studies that treat board characteristics as exogenous. We find that after treating board size and composition as endogenous variables, no robust relation exists between firm performance and these board characteristics.
Second, the results suggest that “one size fits all” approaches to reform of corporate boards are likely to impair the effectiveness of boards. For example, advocates of small boards (for example, Lipton and Lorsch (1992), Jensen (1993)) appear to be underestimating the informational advantage of large boards for firms that are large, relatively easy to monitor, and less in need of nimble governance. Similarly, those who advocate that boards consist of a
minimum number of outside directors (or a maximum number of inside directors) are underestimating the costs that such boards would have on firms with high growth opportunities, large information asymmetries, and a greater need for nimbleness. For example, such constraints could impose high costs on firms such as Genentech, where scientific knowledge and quick decision-making are likely to be highly valued.
Appendix A
List of sample firms
Name of Company* Name of Company*
AMPCO PITTSBURGH CORP KRESGE S S CO
ARCHER DANIELS MIDLAND CO KROGER COMPANY
BOEING CO MARATHON OIL CORP
BRIGGS & STRATTON CORP MAY DEPARTMENT STORES CO
BRISTOL MYERS SQUIBB CO MAYTAG CORP
BROWN SHOE INC NEW MCGRAW HILL COS INC
BRUNSWICK CORP MELVILLE CORP (CVS)
CATERPILLAR INC MESTEK INC
CHEVRONTEXACO CORP NAVISTAR INTERNATIONAL CORP
COCA COLA CO NL INDUSTRIES
COLGATE PALMOLIVE CO OLIN CORP
CONOCOPHILLIPS PENNEY J C INC
CROWN CORK & SEAL INC PEPSICO INC
CURTISS WRIGHT CORP PHARMACIA CORP
DANA CORP PHELPS DODGE CORP
DEERE & CO PHILIP MORRIS COS INC
DU PONT E I DE NEMOURS & CO PHILLIPS VAN HEUSEN CORP
EASTMAN KODAK CO PITTSTON COMPANY
EATON CORP PROCTER & GAMBLE CO
EXXON MOBIL CORP RADIOSHACK CORP
F M C CORP RAYTECH CORP DE
FOOT LOCKER INC RYERSON TULL INC NEW
FORTUNE BRANDS INC SCHLUMBERGER LTD.
FOSTER WHEELER LTD SEARS ROEBUCK & CO
G A T X CORP SPARTON CORP
GENERAL DYNAMICS CORP STANDARD COMMERICAL
GENERAL ELECTRIC CO STARRETT L S CO
GENERAL MILLS INC SUNOCO INC (Sun Oil)
GENERAL MOTORS CORP TEXAS INSTRUMENTS INC
GILLETTE CO TIMKEN COMPANY
GOODRICH CORP TOOTSIE ROLL INDS INC
GOODYEAR TIRE & RUBR CO U S T INC
HERCULES INC UNISYS CORP
HERSHEY FOODS CORP UNITED TECHNOLOGIES CORP
HONEYWELL INTERNATIONAL INC UNIVERSAL CORPORATION
I T T INDUSTRIES INC IND UNOCAL CORP
INCO LTD. VULCAN MATERIALS CO
INGERSOLL RAND CO LTD W H X CORP
INTERNATIONAL BUSINESS MACHS COR WALGREEN CO
INTERNATIONAL PAPER CO WRIGLEY WILLIAM JR CO
KIMBERLY CLARK CORP WYETH
References
Adams, Renee, and Ferreira, Daniel (2007) “A Theory of Friendly Boards.” Journal of Finance, 62, 217-250 Agrawal, Anup, and Knoeber, Charles R. (1996) “Firm Performance and Mechanisms to Control Agency Problems between Managers and Shareholders.” Journal of Financial and Quantitative Analysis 31, 77-397.
Arthur, Neal. (2001) “Board Composition as the Outcome of an Internal Bargaining Process: Empirical Evidence.”
Journal of Corporate Finance 7, 307-340.
Baker, Malcolm, and Gompers, Paul A. (2003) “The Determinants of Board Structure at the Initial Public Offering.” Journal of Law and Economics 46, 569-598.
Barclay, Michael J., and Smith, Clifford W. (1995a)“The Maturity Structure of Corporate Debt.” Journal of Finance 50, 609-632.
Barclay, Michael J., and Smith, Clifford W. (1995b) “The Priority Structure of Corporate Liabilities.” Journal of Finance 50, 899-917.
Bathala, Chenchuramaiah T., and Rao, Ramesh P. (1995) “The Determinants of Board Composition: An Agency Theory Perspective.” Managerial and Decision Economics 16, 59-69.
Bhagat, Sanjai, and Black, Bernard S. (1999) “The Uncertain Relationship Between Board Composition and Firm Performance.” Business Lawyer 54, 921-963.
Boone, Audra, Field, Laura C., Karpoff, Jonathan M., and Raheja, Charu G., (2007) “The Determinants of Corporate Board Size and Composition: An Empirical Analysis.” Journal of Financial Economics, 85, 66-101 Buchanan, James M., and Tullock, Gordon (1974) “The Calculus of Consent.” The University of Michigan Press, Ann Arbor, Michigan.
Cheng, Shijun, 2008, “Board Size and the Variability of Corporate Performance.” Journal of Financial Economics
87, 157-176.
Coles, Jeffrey. L., Daniel, Naveen, and Naveen, Lalitha (2007) “Boards: Does One Size Fit All.” Journal of Financial Economics, forthcoming.
Coles, Jeffrey L., Lemmon, Michael L., and Meschke, J. Felix. (2003) “Structural Models and Endogeneity in Corporate Finance.” Working paper, Financial Management Association.
Cornett, Marcia M., Hovakimian, Gayane, Palia, Darius, and Tehranian, Hassan. (2003) “The Impact of the Manager-Shareholder Conflict on Acquiring Bank Returns.” Journal of Banking and Finance 27, 103-131.
Del Guercio, Diane, Dann, Larry Y., and Partch, Megan M. (2003) “Governance and Boards of Directors in Closed-end Investment Companies.” Journal of Financial Economics 69, 111-152.
Demsetz, Harold, and Lehn, Kenneth (1985) “The Structure of Corporate Ownership: Causes and Consequences.”
Journal of Political Economy 93, 1155-1177.
Demsetz, Harold, and Villalonga, Belen (2001) “Ownership Structure and Corporate Performance.” Journal of Corporate Finance 7, 209-233.
Denis, David, and Sarin, Atulya (1999) “Ownership and Board Structure in Publicly Traded Corporations.”