On TCP Throughput and Window Size in a Multihop
Wireless Network Testbed
Dimitrios Koutsonikolas, Jagadeesh Dyaberi, Prashant Garimella, Sonia Fahmy, and
Y. Charlie Hu
Center for Wireless Systems and Applications Purdue University
West Lafayette, IN, USA
{dkoutson, jdyaberi, pgarime, fahmy, ychu}@purdue.edu
ABSTRACT
Although it is well-known that TCP throughput is subopti-mal in multihop wireless networks, little performance data is available for TCP in realistic wireless environments. In this paper, we present the results of an extensive experi-mental study of TCP performance on a 32-node wireless mesh network testbed deployed on the Purdue University campus. Contrary to prior work which considered a single topology with equal-length links and only 1-hop neighbors within transmission range of each other, our study consid-ers more realistic heterogeneous topologies. We vary the maximum TCP window size, in correlation with two im-portant MAC layer parameters: the use of RTS/CTS and the MAC data rate. Based on our TCP throughput results, we give recommendations on configuring TCP and MAC pa-rameters, which in many cases contradict previous proposals (which had themselves contradicted each other).
Categories and Subject Descriptors
C.2.1 [Computer Communication Networks]: Network Architecture and Design—Wireless Communication
General Terms
Measurement, Performance
Keywords
TCP throughput; TCP congestion control; 802.11 MAC; wireless mesh network; testbed measurements
1.
INTRODUCTION
TCP is the most widely used transport layer protocol in the Internet [15]. While TCP has been extensively in-vestigated in traditional wired networks, TCP throughput over multihop wireless networks is still relatively unexplored.
Permission to make digital or hard copies of all or part of this work for personal or classroom use is granted without fee provided that copies are not made or distributed for profit or commercial advantage and that copies bear this notice and the full citation on the first page. To copy otherwise, to republish, to post on servers or to redistribute to lists, requires prior specific permission and/or a fee.
WiNTECH’07, September 10, 2007, Montréal, Québec, Canada.
Copyright 2007 ACM 978-1-59593-738-4/07/0009 ...$5.00.
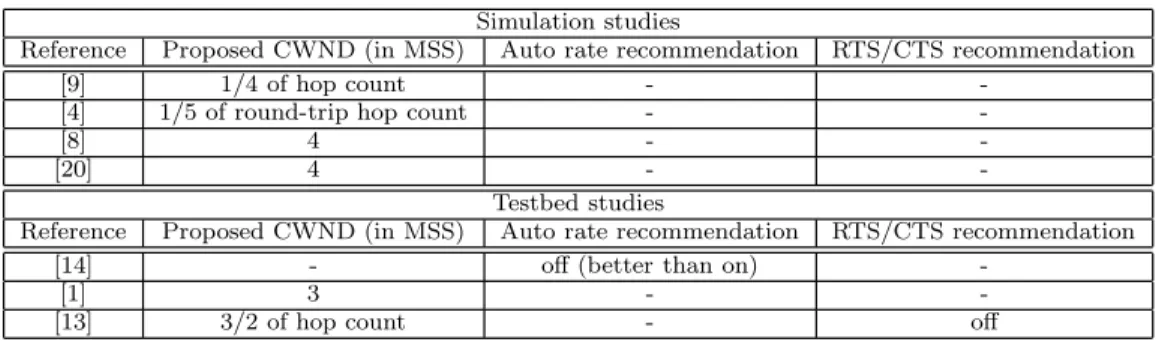
A few studies have investigated the performance of TCP over wireless networks and proposed several TCP variants (e.g., [2, 10, 8, 4, 9, 13, 11, 14, 1]). However, the majority of these studies relied on simulations [2, 10, 8, 4, 9], which cannot capture the complexity of the real wireless medium. To the best of our knowledge, very few experimental studies have been conducted to date [13, 11, 14, 1]. These studies, however, offer limited explanation of the experimental setup and results. Furthermore, they all utilized a simple topology – a chain with hops of equal distance and nodes placed in such a way that only adjacent nodes are within transmis-sion range of each other. Although such a topology helps to compare the observed performance to theoretical values, it is far from a typical operational environment. Finally, de-spite the same topology being used, the results of each study arrive at different conclusions with respect to the impact of parameters such as TCP window size, use of selective ac-knowledgments, and use of RTS/CTS. As an example, the majority of both simulation and experimental studies iden-tify the maximum TCP congestion window size as one of the most important factors that affect TCP performance in wireless networks. However, there is no agreement on the value of this parameter. Different studies have proposed set-ting it to 1/4 of the path length [9], 1/5 of the round trip path length [4], 3/2 of the path length [13], or even using a fixed value, independent of the path length (3 in [1] and 4 in [8]).
The inconsistencies in prior studies raise more questions than answers. In this paper, we seek to provide a more com-plete and consistent picture to the current state of the affair via an extensive experimental study of TCP performance on a large indoor wireless mesh testbed. Our main goal is to ex-amine the effect of the maximum congestion window size on TCP performance, and to verify if the optimal value of this parameter follows any of the patterns proposed in previous work. We also study how this parameter is affected by two MAC layer characteristics – the use of RTS/CTS and the MAC data rate. Similar to most experimental studies, we consider static multihop scenarios. However, we used a di-verse set of topologies (with respect to the distance between neighboring nodes, the transmission and interference ranges, and the environment), instead of the simple topology used in all previous work. Hence, our results are more realistic and show what we can expect in terms of TCP performance in real world deployments.
con-Table 1: Summary of previous studies on maximum TCP congestion window size (CWND).
Simulation studies
Reference Proposed CWND (in MSS) Auto rate recommendation RTS/CTS recommendation
[9] 1/4 of hop count -
-[4] 1/5 of round-trip hop count -
-[8] 4 -
-[20] 4 -
-Testbed studies
Reference Proposed CWND (in MSS) Auto rate recommendation RTS/CTS recommendation
[14] - off (better than on)
-[1] 3 -
-[13] 3/2 of hop count - off
gestion window size as recommended by [13] gives maximum throughput in most, though not all cases. Changing the win-dow size has no effect on throughput for 1-hop flows, while it does affect the throughput as the number of hops increases. Contrary to the observation made by [13], we find that dis-abling RTS/CTS for flows with larger hop counts does not always increase throughput. Further, the RTT values are in general small, although several outliers were observed. En-abling RTS/CTS for 1- and 2-hop topologies increases the RTT; for 3- and 4-hop topologies, it decreases the RTT.
2.
RELATED WORK
Several studies have investigated the behavior of TCP on static and mobile multihop wireless networks and given rec-ommendations on the optimal congestion window size [10, 8, 4, 9, 13, 11, 14, 1, 20]. A summary of these studies is given in Table 1.
Most of these studies relied on simulations [10, 8, 4, 9, 20]. Gerla et al. [10] were among the first to identify two problems with TCP over multihop wireless networks: the conflict between data packets and ACKs, which causes TCP performance degradation for window sizes larger than one, and the interaction between MAC and TCP layer backoff timers, which causes unfairness and capture conditions. Fu et al. [9] studied the impact of multihop wireless channels on TCP performance. Theirs appears to be the first work to demonstrate that for a given topology and traffic pattern, there exists an optimal value of the TCP congestion window size. For a chain topology, the authors computed this value to be equal to 1/4 of the chain length, taking into account the interference range and spatial reuse. They also found that TCP typically exceeds this optimal window, leading to decreased throughput and increased loss. In a related work, the authors in [16] studied the capacity of static multihop wireless networks (without focusing on TCP). They showed that achievable throughput in such an environment is limited by the interaction (at the MAC layer) between neighboring nodes and the achieved throughput is much lower than ex-pected. Chen et al. [4] also studied setting the TCP optimal congestion window limit in multihop wireless networks. The authors considered both the forward and the reverse path in calculating the optimal value. Simulations showed that the optimal value equals 1/5 of the round-trip hop count of the path. Oliveira and Braun [8] also investigated the perfor-mance of TCP on multihop wireless networks and concluded that the optimal maximum window size is equal to 4 MSS, independent of the hop count. Finally, Xu and Saadawi [20] simulated the performance of different TCP versions (Tahoe,
Reno, New Reno, Sack and Vegas) in an 802.11 LAN and found that TCP Vegas performs best. For the other versions of TCP, they found that performance can be improved by limiting the maximum window size to 4 MSS.
Recently, a few experimental studies of TCP performance on wireless testbeds have been conducted [13, 11, 14, 1]. In [11], experiments with both static and mobile clients ver-ified that performance drops with increasing number of hops and speed of the mobile client. The authors also evaluated the impact of Rate Based Pacing (RBP) on TCP perfor-mance. Surprisingly, results show that TCP Reno outper-forms TCP with RBP. Kuang et al. [14] studied the perfor-mance of TCP in a wireless LAN testbed equipped with USB wireless cards. The results show that the USB bus of the wireless cards, the TCP implementation, and the MAC pro-tocol can all affect the overall TCP performance. In terms of the MAC protocol, they find that auto rate adaptation harms TCP performance and gives lower throughput than a constant rate of 1 Mbps. More closely related to our work are [1] and [13]. Anastasi et al. [1] studied the impact of the maximum congestion window size on TCP performance on a static wireless testbed taking into account the effect of two routing protocols, AODV and OLSR. The authors find that in a chain topology with four or fewer hops, a maximum win-dow size equal to 3 achieves optimal performance. Finally, Kawadia and Kumar [13] presented an experimental study of TCP performance over multihop wireless networks, using an indoor 802.11b testbed. The three main conclusions are: (i) limiting the maximum window size improves end-to-end delay and delay jitter, and the optimal maximum window size is 3
2n where n is the number of hops, (ii) turning off
RTS/CTS improves throughput, delay and delay jitter, and (iii) the TCP-SACK option does not have any statistically significant effect on TCP performance. Our experimental study focuses on the impact of the first two parameters.
Several additional studies have been performed on TCP performance in a wireless LAN [2, 3], TCP behavior across multihop wireless networks and the wired Internet [19], and the effect of mobility on TCP throughput [12]. These studies differ from ours in the scenarios considered.
3.
EXPERIMENTAL METHODOLOGY
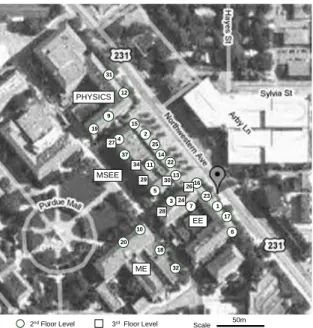
All our experiments were conducted on the Mesh@Purdue (MAP) [18] wireless network testbed, depicted in Figure 1. MAP currently consists of 32 mesh routers spread across four academic buildings on the Purdue University campus. Each router has two radios. For this study, we used one of them: the Atheros 5212 based 802.11a/b/g wireless radio operating
2nd Floor Level 3rd Floor Level ME MSEE PHYSICS EE 20 50m Scale 28 10 18 32 9 12 31 15 2 25 4 14 22 13 5 11 37 16 23 1 17 6 7 3 29 34 27 30 26 24 19
Figure 1: Top view of the MAP testbed topology.
in b mode. Each radio is attached to a 2dBi rubber duck omnidirectional antenna with a low loss pigtail to provide flexibility in antenna placement. Each mesh router runs Mandrake Linux 10.1 (kernel 2.6.8-12) and the open-source madwifidriver [17] is used to enable the wireless cards. IP addresses are statically assigned.
The testbed deployment environment is not wireless-friendly, having floor-to-ceiling office walls, as well as laboratories with structures that limit the propagation of wireless sig-nals and create multipath fading. The wireless routers are fixed and the wireless links have different lengths and quality characteristics. This distinguishes our work from all previ-ous work that used a few laptops as wireless routers, all in the same room or corridor (friendly propagation environ-ment). The use of laptops allows for flexibility and forma-tion of controlled topologies. In contrast, the large number of routers in MAP allows us to form many different topolo-gies and experiment with a more realistic environment. We performed our measurements only during the night to min-imize interference from other 802.11b networks and other sources such as microwaves.
We usedifconfig/iwconfigto control the wireless cards and theiperf tool [23] to generate TCP workload and measure the overall performance. Finally,tcpdump[21] was used to capture packets and collect traces andtcptrace[22] was used to parse those traces. The Optimized Link State Routing protocol (OLSR) [5] enhanced with the ETX routing met-ric [7] was used to set up routes. However, we did not want our measurements to interfere with the control packets of OLSR. Hence, we ran the OLSR daemon for sufficient time to ensure that the best paths based on ETX have stabilized among all pairs of nodes, after which we stopped the dae-mon from sending control messages. The experimentation process was completely automated so that multiple runs of an experiment could be performed overnight without inter-vention.
Table 2 summarizes the parameter values considered in our study. The following parameters were kept constant in all our experiments: (i) The MSS was equal to 1460 bytes, which is the value used in commodity Ethernet, (ii) Atheros
Table 2: Parameters considered in our study.
Fixed Parameters Name Value MSS 1460 bytes # of MAC retries 10 TCP version TCP-SACK transmission power 18 dBm Varying Parameters Name Value max CWND 1 - 6 MSS/unclamped MAC data rate 2 Mbps/5.5 Mbps/auto rate
RTS/CTS on/off
cards do not provide any interface for changing the number of MAC retries - this is only possible by modifying and re-compiling the madwifi driver. Hence, we used the default value of 10 retries (after the first attempt), (iii) TCP-SACK was enabled in all experiments, since this is the default op-tion in Linux OS. Kawadia and Kumar [13] had studied the effect of TCP-SACK and found that it does not significantly impact TCP performance, and (iv) The transmission power of the wireless cards was set to 18 dBm, which is the maxi-mum supported value.
We evaluate the optimal maximum window size (max CWND) for different numbers of hops (hop counts) between the sender and receiver. For each hop count (1, 2, 3, or 4 hops), we re-peat the experiments over different topologies for different window sizes in terms of number of MSSs. The window sizes used for each topology reflect the different recommendations proposed in previous work (1/4 of the hop count, 1/5 of the round trip hop count, and 3/2 of the hop count). We also used values between these three recommendations, as well as the option of an unclamped window. For each topology, we repeated the experiment with three different MAC data rates (2 Mbps, 5.5 Mbps, and auto rate selection), and with RTS/CTS on and off. We did not use a data rate of 11 Mbps, because our previous experience with MAP has shown using 11Mbps gave very low throughput for paths longer than 1 hop. Finally, each experiment was run three times in order to capture the time variability of the wireless channel and the average values over these three runs are presented. The reason we only ran each configuration three times is so that the total set for each topology can finish in under one hour, beyond which the environment is likely to change.1
Further-more, we used 4 topologies per configuration and present the average results for each topology, as well as the average over all 3 x 4 = 12 runs.
4.
EXPERIMENTAL RESULTS
In this section, we present the throughput and the RTT for several topologies, as well as the average over all the topologies for each hop count. Results are shown with and without RTS/CTS enabled, for 3 different link data rates, and for different values of the maximum window size.
1
The total set for each of the 4 topologies consists of 36 experiments (RTS on/off x 3 rates x 6 window sizes), each of which takes 20 seconds, for a total of 720 seconds. When each configuration is run 3 times, the total time is 2160 seconds (36 minutes). The actual duration is much longer due to the reconfiguration delay in between experiments, such as delay in changing TCP window and card parameters.
(a) Throughput comparison, RTS on 0 200 400 600 800 1000 1200 1400 1600 22->13 23->1 4->19 5->28 average topology T h ro u g h p u t (K b p s ) 1MSS 2MSS 3MSS 4MSS Unclamped (b) RTT comparison, RTS on 0 2 4 6 8 10 12 14 16 18 20 22->13 23->1 4->19 5->28 average topology R T T ( m s e c ) 1MSS 2MSS 3MSS 4MSS Unclamped
(c) Throughput comparison, RTS off
0 200 400 600 800 1000 1200 1400 1600 22->13 23->1 4->19 5->28 average topology T h ro u g h p u t (K b p s ) 1MSS 2MSS 3MSS 4MSS Unclamped (d) RTT comparison, RTS off 0 2 4 6 8 10 12 14 16 18 20 22->13 23->1 4->19 5->28 average topology R T T ( m s e c ) 1MSS 2MSS 3MSS 4MSS Unclamped
Figure 2: Throughput and RTT for 4 1-hop flows with and without RTS/CTS. Link data rate is 2 Mbps.
(a) Throughput comparison, RTS on
0 500 1000 1500 2000 2500 3000 3500 22->13 23->1 4->19 5->28 average topology T h ro u g h p u t (K b p s ) 1MSS 2MSS 3MSS 4MSS Unclamped (b) RTT comparison, RTS on 0 2 4 6 8 10 12 14 16 18 20 22->13 23->1 4->19 5->28 average topology R T T ( m s e c ) 1MSS 2MSS 3MSS 4MSS Unclamped
(c) Throughput comparison, RTS off
0 500 1000 1500 2000 2500 3000 3500 22->13 23->1 4->19 5->28 average topology T h ro u g h p u t (K b p s ) 1MSS 2MSS 3MSS 4MSS Unclamped (d) RTT comparison, RTS off 0 2 4 6 8 10 12 14 16 18 20 22->13 23->1 4->19 5->28 average topology R T T ( m s e c ) 1MSS 2MSS 3MSS 4MSS Unclamped
Figure 3: Throughput and RTT for 4 1-hop flows with and without RTS/CTS. Link data rate is 5.5 Mbps.
4.1
Single-hop Flows
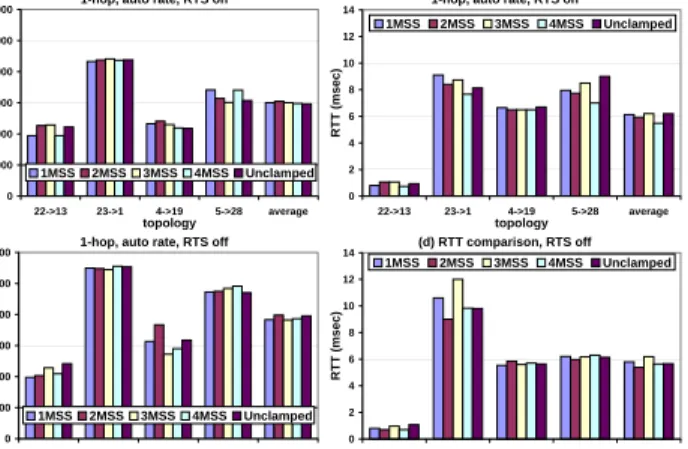
We investigate 4 different 1-hop flows: between nodes 22 → 13, 23 → 1, 4 → 19 and 5 → 28 (see Figure 1).
The results for 2 Mbps, 5.5 Mbps and auto rate selection are shown in Figures 2, 3, and 4, respectively.
We can make several observations from the three figures. First, disabling RTS/CTS increases throughput, especially with higher data rates. Specifically, throughput increases about 4% for 2 Mbps, 12% with 5.5 Mbps and 23% with auto rate. RTTs are higher with RTS/CTS in most cases. Since TCP throughput is inversely proportional to RTT, this causes throughput reduction. This observation agrees with the recommendations made in [13]. In the case of 1-hop flows, RTS/CTS is unnecessary for coordinating trans-missions between a sender and a receiver when there are no other flows in the neighborhood. Carrier sensing can resolve contention for the channel, since the receiver only sends small ACK packets. In a few cases, RTTs are longer without RTS/CTS for flows 4→ 19 and 5 →28, the two
flows in which the nodes have the longest distances between them. In one case with auto rate, RTT was also longer without RTS/CTS for flow 23→1, but this may be due to
temporary channel variation.
1-hop, auto rate, RTS on
0 1000 2000 3000 4000 5000 6000 22->13 23->1 4->19 5->28 average topology T h ro u g h p u t (K b p s ) 1MSS 2MSS 3MSS 4MSS Unclamped
1-hop, auto rate, RTS on
0 2 4 6 8 10 12 14 22->13 23->1 4->19 5->28 average topology R T T ( m s e c ) 1MSS 2MSS 3MSS 4MSS Unclamped
1-hop, auto rate, RTS off
0 1000 2000 3000 4000 5000 6000 22->13 23->1 4->19 5->28 average topology T h ro u g h p u t (K b p s ) 1MSS 2MSS 3MSS 4MSS Unclamped (d) RTT comparison, RTS off 0 2 4 6 8 10 12 14 22->13 23->1 4->19 5->28 average topology R T T ( m s e c ) 1MSS 2MSS 3MSS 4MSS Unclamped
Figure 4: Throughput and RTT for 4 1-hop flows with and without RTS/CTS. Automatic rate control is used.
Second, using higher data rates increases TCP throughput as expected. Interestingly, the use of auto rate adaptation gives the highest throughput. This conflicts with the result observed in [14], in which the authors report that auto rate adaptation gives lower throughput even compared to using a static 1 Mbps data rate. The authors concluded that the rate adaptation algorithm unnecessarily increased the rate to 11 Mbps, resulting in packet losses. On the other hand, the result in Figure 4 shows that 11 can be supported in some cases (for flows 23→1 and 5→28). However, our testbed
has different wireless cards and different drivers than their testbed. Since there is no standard on the rate adaptation algorithm, a decision can be made on using this feature or not only after experimentation in the specific environment. Finally, we observe that the difference in TCP throughput is very small for different window sizes (less than 5%), and there is no clear winner. Even keeping the window size un-clamped does not reduce throughput. Further, the RTTs are small (below 20 ms). The reason is that since the sender and the receiver are within transmission range of each other, the receiver can always control the sender rate and make sure it does not send more traffic than it can handle. Again, only in the case of the two flows with the longest sender-receiver distance, i.e., 4 → 19 and 5 → 28, we can observe some
difference in throughput for different window sizes. In these cases, limiting the window size to 2 or 3 MSS can yield a 10 to 15% increase in throughput. Flow 22→13 (the flow
with the shortest sender-receiver distance) appears to be the most unpredictable; in two cases (5.5 Mbps and auto rate with RTS/CTS on), a window size of 3 MSS gives 13% and 17% higher throughput, but interestingly in another case (auto rate, RTS/CTS off) an unclamped window gives 22% higher throughput.
As a general recommendation, limiting the window to 2 MSS appears to be the best option in most cases for 1-hop flows, along with disabling RTS/CTS. The value of 2 MSS is closest to the recommendation in [13] (3/2·1 = 1.5'2 ).
4.2
Two-hop Flows
We experimented with 4 different 2-hop flows: 1→23→
16, 28 → 29→ 34, 37 →25 →2 and 5 → 3→ 23. The
results for 2 Mbps, 5.5 Mbps and auto rate selection are shown in Figures 5, 6, and 7, respectively.
(a) Throughput comparison, RTS on 0 100 200 300 400 500 600 700 800 1->23->16 28->29->34 37->25->2 5->3->23 average topology T h ro u g h p u t (K b p s ) 1MSS 2MSS 3MSS 4MSS Unclamped (b) RTT comparison, RTS on 0 50 100 150 200 250 300 350 400 450 500 1->23->16 28->29->3437->25->2 5->3->23 average topology R T T ( m s e c ) 1MSS 2MSS 3MSS 4MSS Unclamped
(c) Throughput comparison, RTS off
0 100 200 300 400 500 600 700 800 1->23->16 28->29->34 37->25->2 5->3->23 average topology T h ro u g h p u t (K b p s ) 1MSS 2MSS 3MSS 4MSS Unclamped (d) RTT comparison, RTS off 0 50 100 150 200 250 300 350 400 450 500 1->23->16 28->29->3437->25->2 5->3->23 average topology R T T ( m s e c ) 1MSS 2MSS 3MSS 4MSS Unclamped
Figure 5: Throughput and RTT for 4 2-hop flows with and without RTS/CTS. Link data rate is 2 Mbps.
(a) Throughput comparison, RTS on
0 200 400 600 800 1000 1200 1400 1600 1800 2000 1->23->16 28->29->34 37->25->2 5->3->23 average topology T h ro u g h p u t (K b p s ) 1MSS 2MSS 3MSS 4MSS Unclamped (b) RTT comparison, RTS on 0 20 40 60 80 100 120 140 160 180 1->23->1628->29->3437->25->2 5->3->23 average topology R T T ( m s e c ) 1MSS 2MSS 3MSS 4MSS Unclamped
(c) Throughput comparison, RTS off
0 200 400 600 800 1000 1200 1400 1600 1800 2000 1->23->16 28->29->34 37->25->2 5->3->23 average topology T h ro u g h p u t (K b p s ) 1MSS 2MSS 3MSS 4MSS Unclamped (d) RTT comparison, RTS off 0 20 40 60 80 100 120 140 160 180 1->23->16 28->29->34 37->25->2 5->3->23 average topology R T T ( m s e c ) 1MSS 2MSS 3MSS 4MSS Unclamped
Figure 6: Throughput and RTT for 4 2-hop flows with and without RTS/CTS. Link data rate is 5.5 Mbps.
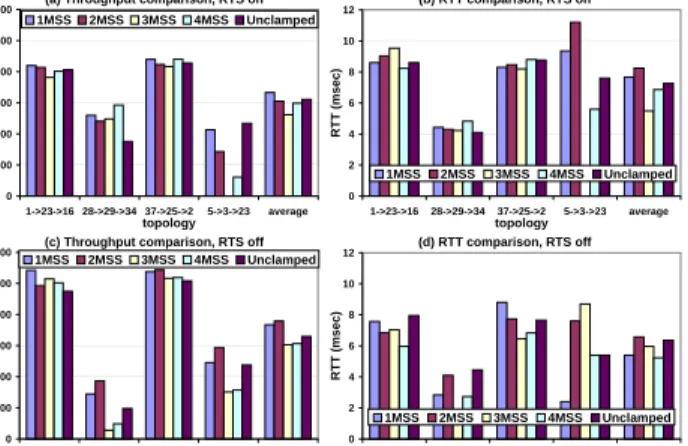
A first observation here is that throughput is much lower than in the case of 1-hop flows. Although a direct compari-son is impossible since the flows are different, in all 6 cases we observe that, on average, throughput is reduced by more than 50% compared to the 1-hop flows. Similar to the 1-hop case, throughput is higher with auto rate adaptation than with 5.5 Mbps.
A second observation is that disabling RTS/CTS in this case does not always result in higher throughput, as it did in the case of 1-hop flows. There are two flows with a data rate of 2 Mbps (flows 28→29→34 and 5→3→23) and
one flow with auto rate (flow 28→29→34) that achieve
higher rate with RTS/CTS on. However, in the majority of the cases disabling RTS/CTS results in higher throughput. RTTs remain below 20 ms. The only exception is flow 5→3→23. For that flow, RTT is extremely sensitive to the
maximum window size used; certain values of this parameter increase the RTTs up to 140 ms without RTS/CTS and up to 470 ms with RTS/CTS on. However, this RTT inflation seems not to affect throughput. For example, with a data rate of 2 Mbps and RTS/CTS on, RTT reaches 473 ms with a window size of 2 MSS, while it is only 55 ms with a window size of 3 MSS. However, the 3 MSS window size gives the
(a) Throughput comparison, RTS on
0 500 1000 1500 2000 2500 3000 1->23->16 28->29->34 37->25->2 5->3->23 average topology T h ro u g h p u t (K b p s ) 1MSS 2MSS 3MSS 4MSS Unclamped (b) RTT comparison, RTS on 0 2 4 6 8 10 12 1->23->16 28->29->34 37->25->2 5->3->23 average topology R T T ( m s e c ) 1MSS 2MSS 3MSS 4MSS Unclamped
(c) Throughput comparison, RTS off
0 500 1000 1500 2000 2500 3000 1->23->16 28->29->34 37->25->2 5->3->23 average topology T h ro u g h p u t (K b p s ) 1MSS 2MSS 3MSS 4MSS Unclamped (d) RTT comparison, RTS off 0 2 4 6 8 10 12 1->23->16 28->29->34 37->25->2 5->3->23 average topology R T T ( m s e c ) 1MSS 2MSS 3MSS 4MSS Unclamped
Figure 7: Throughput and RTT for 4 2-hop flows with and without RTS/CTS. Automatic rate control is used.
lowest throughput – 13% lower than with 2 MSS. With a data rate of 5.5 Mbps and RTS/CTS off, RTT is maximum with a window size of 3 MSS (140 ms), but throughput is also maximum for the same window size. This shows that in most cases throughput is mainly determined by the loss rate and not by the RTT. In contrast, with a data rate of 2 Mbps and RTS/CTS off, a window size of 3 MSS gives both the highest RTT and the lowest throughput.
Finally, we observe that the choice of the maximum win-dow size significantly impacts throughput, contrary to the 1-hop case. The difference between the maximum and min-imum average throughput for different maxmin-imum window sizes is 18%, 17% and 27% with 2 Mbps, 5.5 Mbps, and auto rate, respectively, with RTS/CTS on, and 8%, 12% and 25%, with RTS/CTS off. However, there is no single optimal value of the window size for all cases. Examining the averages, we observe that a window size limited to 1 MSS gives the highest throughput with RTS/CTS on for all data rates. With RTS/CTS off, the optimal window seems to be 2 MSS for 2 Mbps, 3 MSS for 5.5 Mbps and 2 MSS for auto rate. We observe large variations though; there are cases where the window size seems to have no effect (e.g., flows 1 →23 → 16, and 37 →25 → 2 with 2 Mbps and
RTS/CTS off), but also flows where an unclamped window size appears to give high throughput (e.g., 28 →29 →34
with 2 Mbps and RTS/CTS off, and 5→3→23 with auto
rate and RTS/CTS on).
In general, limiting the maximum window size to 1 or 2 MSS appears to give high (but not the highest) through-put in almost all cases. This value is lower than the one recommended in [13] (3
2·2 = 3M SS), but higher than the
theoretical value proposed in [4] (1
5 ·2·2 = 4
5 '1M SS).
4.3
Three-hop Flows
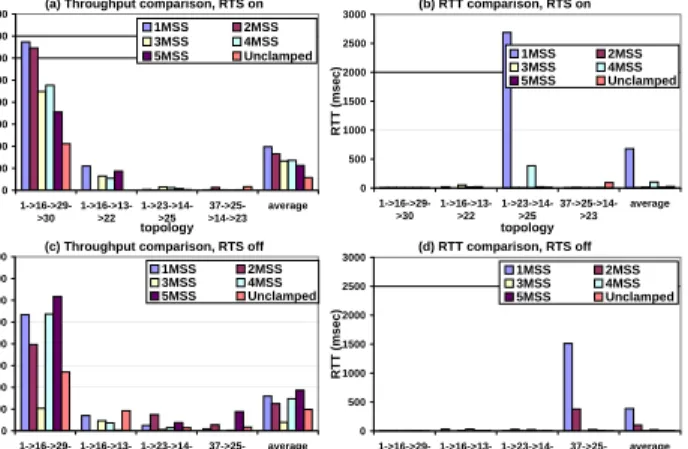
As we increase the hop count beyond 2, the throughput drops significantly and is close to zero for most topologies [6]. We show here the results for 4 different 3-hop flows which gave non-zero throughput: 1 →16→29→30, 1→16→
13 → 22, 1→ 23 →14 → 25 and 37→ 25 → 14→ 23.
The results for 2 Mbps, 5.5 Mbps and auto rate selection are given in Figures 8, 9, and 10, respectively.
We immediately observe that throughput decreases dras-tically compared to the 1-hop and 2-hop topologies. In all
(a) Throughput comparison, RTS on 0 50 100 150 200 250 300 350 400 450 1->16->29->30 1->16->13->22 1->23->14->25 37->25->14->23 average topology T h ro u g h p u t (K b p s ) 1MSS 2MSS 3MSS 4MSS 5MSS Unclamped (b) RTT comparison, RTS on 0 5 10 15 20 25 1->16->29->30 1->16->13->22 1->23->14->25 37->25->14->23 average topology R T T ( m s e c ) 1MSS 2MSS 3MSS 4MSS 5MSS Unclamped
(c) Throughput comparison, RTS off
0 50 100 150 200 250 300 350 400 450 1->16->29->30 1->16->13->22 1->23->14->25 37->25->14->23 average topology T h ro u g h p u t (K b p s ) 1MSS 2MSS 3MSS 4MSS 5MSS Unclamped (d) RTT comparison, RTS off 0 5 10 15 20 25 1->16->29->30 1->16->13->22 1->23->14->25 37->25->14->23 average topology R T T ( m s e c ) 1MSS 2MSS 3MSS 4MSS 5MSS Unclamped
Figure 8: Throughput and RTT for 4 3-hop flows with and without RTS/CTS. Link data rate is 2 Mbps.
(a) Throughput comparison, RTS on
0 100 200 300 400 500 600 700 800 1->16->29->30 1->16->13->22 1->23->14->25 37->25->14->23 average topology T h ro u g h p u t (K b p s ) 1MSS 2MSS 3MSS 4MSS 5MSS Unclamped (b) RTT comparison, RTS on 0 5 10 15 20 25 1->16->29->30 1->16->13->22 1->23->14->25 37->25->14->23 average topology R T T ( m s e c ) 1MSS 2MSS 3MSS 4MSS 5MSS Unclamped
(c) Throughput comparison, RTS off
0 100 200 300 400 500 600 700 800 1->16->29->30 1->16->13->22 1->23->14->25 37->25->14->23 average topology T h ro u g h p u t (K b p s ) 1MSS 2MSS 3MSS 4MSS 5MSS Unclamped (d) RTT comparison, RTS off 0 5 10 15 20 25 1->16->29->30 1->16->13->22 1->23->14->25 37->25->14->23 average topology R T T ( m s e c ) 1MSS 2MSS 3MSS 4MSS 5MSS Unclamped
Figure 9: Throughput and RTT for 4 3-hop flows with and without RTS/CTS. Link data rate is 5.5 Mbps.
cases, average throughput remains below 300 Kbps. This validates previous studies which showed that TCP perfor-mance suffers in multihop wireless networks. Contrary to our previous experiments, here auto rate adaptation typ-ically results in lower throughput compared to the static 5.5 Mbps. This confirms that the auto rate adaptation al-gorithm does not always perform well in multihop networks. As we mentioned in Section 4.1, the authors in [14] observed this, even for smaller hop counts.
Similar to the 2-hop case, we observe that disabling RTS/CTS does not always result in throughput increase. For each of the 3 data rates, disabling RTS/CTS helps some topologies but harms others. Enabling RTS/CTS seems to help with a data rate of 5.5 Mbps. In this case, the average throughput increases by 24% compared to the case without RTS/CTS. This result contradicts all previous work that supports turn-ing off RTS/CTS for increased throughput (even the default operation mode of our wireless cards is with RTS/CTS off). We find that with large hop counts and irregular topologies, RTS/CTS can help, since it mitigates the problem of hidden terminals, and thus the probability of packet collisions.
Examining the RTTs, we observe that they remain small and consistent, except for a few cases with auto-rate. For
(a) Throughput comparison, RTS on
0 100 200 300 400 500 600 700 800 1->16->29->30 1->16->13->22 1->23->14->25 37->25->14->23 average topology T h ro u g h p u t (K b p s ) 1MSS 2MSS 3MSS 4MSS 5MSS Unclamped (b) RTT comparison, RTS on 0 500 1000 1500 2000 2500 3000 1->16->29->30 1->16->13->22 1->23->14->25 37->25->14->23 average topology R T T ( m s e c ) 1MSS 2MSS 3MSS 4MSS 5MSS Unclamped
(c) Throughput comparison, RTS off
0 100 200 300 400 500 600 700 800 1->16->29->30 1->16->13->22 1->23->14->25 37->25->14->23 average topology T h ro u g h p u t (K b p s ) 1MSS 2MSS 3MSS 4MSS 5MSS Unclamped (d) RTT comparison, RTS off 0 500 1000 1500 2000 2500 3000 1->16->29->30 1->16->13->22 1->23->14->25 37->25->14->23 average topology R T T ( m s e c ) 1MSS 2MSS 3MSS 4MSS 5MSS Unclamped
Figure 10: Throughput and RTT for 4 3-hop flows with and without RTS/CTS. Automatic rate control is used.
the case of auto-rate and a window size equal to 1 MSS, RTT is 388 ms (RTS/CTS off) and 679 ms (RTS/CTS on). This large value of average RTT results from two flows whose RTTs exceed 1500 ms and 2600 ms, respectively. Similarly, for auto-rate with RTS/CTS off and a window size of 2 MSS, and auto-rate with RTS/CTS on and a window size of 4 MSS, we observe an average RTT of 102 ms. This increase in average RTT is caused by the two flows whose RTTs exceed 370 ms. The remaining flows have much lower RTTs. We attribute these anomalies to the quality of the link and treat them as outliers. Another observation is that RTTs are in general lower with RTS/CTS enabled. This shows again that RTS/CTS is necessary in some cases to reduce collisions. The time wasted due to the RTS/CTS exchange is lower compared to the time wasted due to backoff after collisions, when RTS/CTS is disabled. Finally, there is no direct relationship between RTTs and throughputs in the majority of the cases, i.e., highest RTT usually does not come with the lowest throughput.
We observe that the choice of maximum window size has a significant effect on the throughput. The difference be-tween the maximum and minimum average throughput for different maximum window sizes is 34%, 96% and 245% with 2 Mbps, 5.5 Mbps, and auto rate, respectively, with RTS/CTS on, and 163%, 82% and 389%, respectively, with RTS/CTS off. The throughput improvement varies among the different topologies and settings, and hence it is diffi-cult to select a single optimal value of the window size for all cases. With RTS/CTS on, a maximum window size of 1 MSS appears to be the best choice for all data rates. With RTS/CTS off, 4 MSS seems the best option for 2 Mbps, and 5 MSS for 5.5 Mbps and auto rate.
We conclude that limiting the maximum window size to 5 MSS appears to give high throughput when combined with RTS/CTS disabled. This value agrees with the value rec-ommended in [13] (3
2·3 = 9
2 '5M SS). However, unlike the
observation of [13], in many cases, we observe a decrease in throughput with RTS/CTS disabled. For those cases, max-imum throughput is obtained when the maxmax-imum window size is limited to only 1 MSS.
4.4
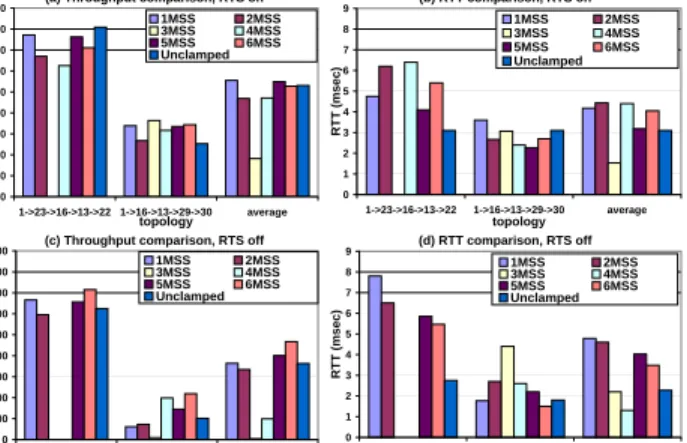
Four-hop Flows
(a) Throughput comparison, RTS on 0 50 100 150 200 250 300 350 400 1->23->16->13->221->16->13->29->30 average topology T h ro u g h p u t (K b p s ) 1MSS 2MSS 3MSS 4MSS 5MSS 6MSS Unclamped (b) RTT comparison, RTS on 0 50 100 150 200 250 300 1->23->16->13->22 1->16->13->29->30 average topology R T T ( m s e c ) 1MSS 2MSS 3MSS 4MSS 5MSS 6MSS Unclamped
(c) Throughput comparison, RTS off
0 50 100 150 200 250 300 350 400 1->23->16->13->221->16->13->29->30 average topology T h ro u g h p u t (K b p s ) 1MSS 2MSS 3MSS 4MSS 5MSS 6MSS Unclamped (d) RTT comparison, RTS off 0 50 100 150 200 250 300 1->23->16->13->22 1->16->13->29->30 average topology R T T ( m s e c ) 1MSS 2MSS 3MSS 4MSS 5MSS 6MSS Unclamped
Figure 11: Throughput and RTT for 2 4-hop flows with and without RTS/CTS. Link data rate is 2 Mbps.
(a) Throughput comparison, RTS on
0 100 200 300 400 500 600 1->23->16->13->221->16->13->29->30 average topology T h ro u g h p u t (K b p s ) 1MSS 2MSS 3MSS 4MSS 5MSS 6MSS Unclamped (b) RTT comparison, RTS on 0 2 4 6 8 10 12 14 16 18 20 1->23->16->13->22 1->16->13->29->30 average topology R T T ( m s e c ) 1MSS 2MSS 3MSS 4MSS 5MSS 6MSS Unclamped
(c) Throughput comparison, RTS off
0 100 200 300 400 500 600 1->23->16->13->221->16->13->29->30 average topology T h ro u g h p u t (K b p s ) 1MSS 2MSS 3MSS 4MSS 5MSS 6MSS Unclamped (d) RTT comparison, RTS off 0 2 4 6 8 10 12 14 16 18 20 1->23->16->13->22 1->16->13->29->30 average topology R T T ( m s e c ) 1MSS 2MSS 3MSS 4MSS 5MSS 6MSS Unclamped
Figure 12: Throughput and RTT for 2 4-hop flows with and without RTS/CTS. Link data rate is 5.5 Mbps.
16 → 13 → 22, and 1 → 16 → 13 → 29 → 30. This is
because for all other 4-hop topologies on our mesh testbed, throughput was close to zero. The results for 2 Mbps, 5.5 Mbps and auto rate selection are shown in Figures 11, 12, and 13, respectively.
We observe again that throughput is very low, similar to the 3-hop case. For example, with 5.5 Mbps data rate and RTS/CTS off, the average throughput is only 187 Kbps - 387 Kbps, and with RTS/CTS on, it goes up to only 390 Kbps. This is consistent with prior studies. Surpris-ingly, here auto rate gives higher throughput than the static 5.5 Mbps data rate.
Similar to the 3-hop case, disabling RTS/CTS does not always increase throughput. Specifically, with a data rate of 2 Mbps, throughput is the same in both topologies with or without RTS/CTS. With a data rate of 5.5 Mbps, as well as with auto rate adaptation, enabling RTS/CTS results in a significant throughput improvement. Comparing the maxi-mum average throughput values observed in each case, we can see that RTS/CTS gives a 27% increase with 5.5 Mbps and a 19% increase with auto rate. The same qualitative re-sult is true when comparing individual flows. Hence, again our observations conflict with all previous work that suggests
(a) Throughput comparison, RTS on
0 100 200 300 400 500 600 700 800 900 1->23->16->13->22 1->16->13->29->30 average topology T h ro u g h p u t (K b p s ) 1MSS 2MSS 3MSS 4MSS 5MSS 6MSS Unclamped (b) RTT comparison, RTS on 0 1 2 3 4 5 6 7 8 9 1->23->16->13->22 1->16->13->29->30 average topology R T T ( m s e c ) 1MSS 2MSS 3MSS 4MSS 5MSS 6MSS Unclamped
(c) Throughput comparison, RTS off
0 100 200 300 400 500 600 700 800 900 1->23->16->13->22 1->16->13->29->30 average topology T h ro u g h p u t (K b p s ) 1MSS 2MSS 3MSS 4MSS 5MSS 6MSS Unclamped (d) RTT comparison, RTS off 0 1 2 3 4 5 6 7 8 9 1->23->16->13->22 1->16->13->29->30 average topology R T T ( m s e c ) 1MSS 2MSS 3MSS 4MSS 5MSS 6MSS Unclamped
Figure 13: Throughput and RTT for 2 4-hop flows with and without RTS/CTS. Automatic rate control is used.
disabling RTS/CTS for increased throughput.
Examining the RTTs, we observe that they remain small, except for the case of 2 Mbps with RTS/CTS off and a win-dow size equal to 5 MSS. In that case, RTT is very large (268 ms); however, since it is the only large value, it is pos-sibly an outlier. Another observation is that RTTs are in general lower with RTS/CTS enabled. This again verifies that RTS/CTS is necessary in this case to reduce collisions. The observation made for the 3-hop topology holds here also, i.e., the time wasted due to the RTS/CTS exchange is short compared to the time wasted due to backoff after collisions when RTS/CTS is disabled. Again, similar to the 3-hop re-sults, we observe no clear relationship between RTTs and throughputs in the majority of cases.
Finally, we observe that, as with the 2 and 3 hop cases, the choice of the maximum window size impacts through-put. The gap between the maximum and minimum average throughput for different maximum window sizes is 16%, 35% and 206%, with 2 Mbps, 5.5 Mbps, and auto rate, respec-tively, with RTS/CTS on, and 56%, 64% and 9277% (the last extremely large value is due to zero throughput in the case of 3 MSS for both flows), with RTS/CTS off. However, again there is no single optimal value of the window size for all cases. With RTS/CTS on, the optimal value appears to be 1 MSS with 2 Mbps and auto rate, but 6 MSS with 5.5 Mbps. With RTS/CTS off, 6 MSS appears to be the best choice. Examining individual flows, however, we can find cases where an unclamped window gives the highest throughput.
A general recommendation based on the majority of re-sults for 4-hop flows with RTS/CTS off is to limit the max-imum window size to 6 MSS. This value is also proposed in [13] (3
2 ·4 = 6 M SS). However, contrary to [13], our
results again show that disabling RTS/CTS sometimes re-duces throughput. With RTS/CTS on, 1 MSS is typically the best choice, as in the 3-hop case.
5.
CONCLUSIONS
We have conducted an extensive experimental study of TCP over a 32-node wireless mesh network testbed, de-ployed on the Purdue campus. We examined how the value of the maximum congestion window size affects TCP perfor-mance, in correlation with two important MAC parameters,
Table 3: Recommendations for TCP maximum window size (CWND) and usage of RTS/CTS for flows of
different hop counts and data rates. On/offmeans that enabling RTS/CTS improved TCP performance for
some topologies but not others. The two numbers in the CWND column in these cases are the corresponding optimal CWND values.
Data rate
2 Mbps 5.5 Mbps Auto rate
Hops RTS/CTS CWND RTS/CTS CWND RTS/CTS CWND
1 off 2 MSS off 2 MSS off 2 MSS
2 on/off 1 MSS/2 MSS off 3 MSS off 2 MSS
3 on/off 1 MSS/4 MSS on 1 MSS on/off 1 MSS/5 MSS
4 on/off 1 MSS/6 MSS on 6 MSS on 1 MSS
the use of RTS/CTS and the MAC data rate. Table 3 sum-marizes our recommendations on these parameters, for 1-, 2-, 3- and 4-hop flows.
Our study reveals that setting the maximum window size as recommended by [13] gives maximum throughput in most, but not all, cases, only when combined with disabling RTS/CTS. The window size has minimal effect on throughput for 1-hop transmissions, while it does affect throughput as the number of hops increases. Contrary to the observation made by [13], our study shows that disabling RTS/CTS for topologies with higher hop counts does not always increase throughput. With RTS/CTS on, the optimal value for the congestion window size is only 1 MSS. Additionally, we found that RTTs are generally low, but outliers exist. Enabling RTS/CTS for 1-and 2-hop experiments increases the RTT, while for 3- 1-and 4-hop experiments, it decreases the RTT.
In our future work, we plan to extensively analyze the collected traces in order to identify the root causes of some of our results. We also plan to study the impact of the value of MSS on TCP performance.
Acknowledgment
This work was supported in part by NSF grants CNS-0338842 and CNS-0626703.
6.
REFERENCES
[1] G. Anastasi, E. Ancilloti, M. Conti, and A. Passarella. Experimental analysis of TCP performance in static multi-hop ad hoc networks.Nova Science Publisher, 2007. [2] B. S. Bakshi, P. Krishna, N. H. Vaidya, and D. K.
Pradhan. Improving performance of TCP over wireless networks. InProc. of IEEE ICDCS, 1997.
[3] H. Balakrishnan, V. Padmanabhan, S. Seshan, and R. Katz. A comparison of mechanisms for improving TCP performance over wireless links.IEEE/ACM Transactions on Networking, 5(6), 1997.
[4] K. Chen, Y. Xue, and K. Nahrstedt. On setting TCP’s congestion window limit in mobile ad hoc networks. In Proc. of IEEE ICC, 2003.
[5] T. Clausen, P. Jacquet, C. Adjih, A. Laouiti, P. Minet, P. Muhlethaler, A. Qayyum, and L.Viennot. Optimized link state routing protocol (OLSR). RFC 3626, Oct 2003.
[6] S. Das, D. Koutsonikolas, and Y. C. Hu.Handbook of Wireless Mesh and Sensor Networking, chapter
Measurement-based Characterization of a Wireless Mesh Network. McGraw-Hill, 2007.
[7] D. De Couto, D. Aguayo, J. C. Bicket, and R. Morris. A high-throughput path metric for multi-hop wireless routing. InProc. of ACM MobiCom, 2003.
[8] R. de Oliveira and T. Braun. A dynamic adaptive acknowledgement strategy for TCP over multihop wireless networks. InProc. of IEEE Infocom, 2005.
[9] Z. Fu, P. Zerfos, H. Luo, S. Lu, L. Zhang, and M. Gerla. The impact of multihop wireless channel on TCP throughput and loss. InProc. of IEEE Infocom, 2003. [10] M. Gerla, R. Bagrodia, L. Zhang, K. Tang, and L. Wang.
TCP over wireless multi-hop protocols: simulations and experiments. InProc. of IEEE ICC, 1999.
[11] A. Gupta, Wormsbecker, and C. Williamson. Experimental evaluation of TCP performance in multi-hop wireless ad hoc networks. InProc. of MASCOTS, 2004.
[12] G. Holland and N. H. Vaidya. Analysis of TCP
performance over mobile ad hoc networks. InProc. of ACM MobiCom, 1999.
[13] V. Kawadia and P. Kumar. Experimental investigations into TCP performance over wireless multihop networks. In SIGCOMM Workshop on experimental approaches to wireless network design and analysis (E-WIND), 2005. [14] T. Kuang, F. Xiao, and C. Williamson. Diagnosing wireless
TCP performance problems: A case study. InProc. of SPECTS, 2003.
[15] J. Kurose and K. Ross.Computer Networking: A top-down approach featuring the Internet. Addison Wesley, 2005. [16] J. Li, C. Blake, D. D. Couto, H. I. Lee, and R. Morris. Capacity of ad hoc wireless networks. InProceedings of ACM Mobicom, 2001.
[17] madwifi.http://madwifi.org.
[18] [email protected]://www.engineering.purdue.edu/MESH. [19] K. Su, S. Bae, S. Lee, and M. Gerla. TCP behavior across
multihop wireless networks and the wired networks. In Proc. of WoWMoM, 2002.
[20] S. Xu and T. Saadawi. Performance evaluation of TCP algorithms in multi-hop wireless packet networks.Wireless Communications and Mobile Computing, 2(1), 2001. [21] tcpdump. http://www.tcpdump.org.
[22] tcptrace. http://jarok.cs.ohiou.edu/software/tcptrace/. [23] iperf. http://dast.nlanr.net/Projects/Iperf.