Investment Risk and Returns: The Relationship Between A Stock
and An Index Using the Modern Portfolio Theory
Prof Tan ZongMing Koomson Prince* Dr. Ding Guoping
School of Finance and Applied Economics, Jiangsu University 301 Xuefu Road, China ABSTRACT
The aim of this report is to examine investment risk and returns by looking at the relationship between a stock and an index using the Markowitz Modern Portfolio theory. Monthly Data on IBM and Dow Jones were obtained from yahoo finance for the period 1995 to 2015. A linear regression was utilized to analyze the relationship between the Dow Jones index and the IBM stock returns. The results revealed that there is a positive relationship between IBM stock returns and the Dow Jones index. In their decision making, investors and policy makers are, recommended to additionally consider the micro and macro demand and supply forces that could possibly influence ROI. In other to avoid or reduce risk.
Keywords: Portfolio, investment, risk, index, relationship, stocks 1. INTRODUCTION
This article aims to demonstrate, in practice, the application of Markowitz's modern portfolio theory as an important tool for making investment decisions. Markowitz won the Nobel Prize in 1990 for his enormous contribution in the field of investment and finance. Its Role as Portfolio Selection: Rational Diversification (1952) His paper “portfolio Selection: efficient Diversification (1959) has Influenced Many Lives in Making Investment Decisions.
The Markowitz theory of today is what has come to be regarded as the "Theory of Modern Portfolio" (MPT). This theory allows potential investors to analyze portfolio risks and returns before making any attempt to select one.
In 1964, William Sharpe, built another theory, which has its justification from Markowitz MPT, William Sharpe's current theory is what is known by both investors and the academic world as the asset valuation model.
Investors are very keen to know the returns they will have on their investment, this can be said to be one of the main reasons why people invest in diverse portfolios. In other for this returns to be optimized hence reduce risk implies investors to diversify their investment. Holding multiple portfolios alone isn’t prudent enough to justify one’s ability to maximize return on investment.
Investors are very interested in learning about the benefits they will have on their investment, this can be said to be one of the main reasons why people invest in different portfolios. In other to reduce the risks involved on portfolio selection investors diversify their investments Holding multiple portfolios alone isn’t prudent enough to justify one’s ability to maximize return on investment
The world of financial investment is a very risky and volatile field to venture as such a careful and critical investment risk and returns analysis is required to avoid any shocks.
It is based on the above highlighted that this paper seeks to aid all investment and financial stake holders to acquire the knowledge and dealings of the financial market. This paper will focus on the Modern Portfolio theory as an efficient investment decision making analysis tool. Specifically this paper will discuss specific issues such as the review and framework of the MPT, risk and returns, expected returns, risk measurement and volatility and well as risk diversification.
It is based on the above highlights that this document aims to assist all investment owners and financial stakeholders to acquire knowledge and dealings of financial markets. This paper will focus on the portfolio theory as a tool for the analysis of efficient investment decision. In particularly, this paper will address specific topics such as the revision and framework of the MPT, risk and returns, risk measurement and volatility, as well as risk diversification.
This paper will focus on using the monthly returns of IBM stock from 1996 to 2015 to analyse Markowitz MPT using the Dow jones as the benchmark.
It is the aim of this paper to contribute to the pool of knowledge existing in investment decision making as well as academia on the above subject.
The paper’s emphasis is on risk and returns focusing on the relationship between the monthly stocks returns of Dow Jones index and IBM using a liner regression model. It analyses the modern portfolio theory as an investment tool. It avoids the complex mathematical calculations by using simple techniques to analyse the MPT.
Data gathered included the monthly adjusted stock prices for the Dow Jones Index and the IBM stocks drawn from S&P500 from 2015 to January 1996. The computations were done using Microsoft excel.
2. A REVIEW OF RELATED LITERATURE
The investment decision-making process is the ability to make appropriate decisions and be guided by the various theories of portfolio investments. The most important aspect of the Markowitz model was its description of the impact on portfolio diversification by the number of securities within a portfolio and covariance relationships (Megginson, 1996). In 1958, James Tobin in the evaluation of the conditions of economic studies proposed the "efficient frontier" and the ideas of the "Market Line Capital" built on MPT. His model proposed that investors, regardless of their level of risk tolerance, hold equity portfolios in the same portion, as long as the expectations remain the same with respect to the future (1996 Megginson quoting Tobin, 1958). Tobin concluded that the investment portfolios of these investors only vary in their relative proportions of stocks and bonds.
There are basically two approaches to managing investments: 2.1 The Passive investment approach:
This approach is based on the belief that markets are efficient, market returns cannot be outdone repeatedly overtime and low cost investments held for a long term will provide the best returns.
2.2 Active asset management:
• This approach is based on the belief that a specific style of management or analysis can produce returns that beat the market.
The active approach seeks to take advantage of inefficiencies in the market and is typically accompanied by higher-than-average costs (for analysts and managers who must spend time to seek out these inefficiencies).
• Market timing is an extreme example of active asset management. It is based on the belief that it's possible to anticipate the movement of markets based on factors such as economic conditions, interest rate trends or technical indicators. Many investors, particularly academics, believe it is impossible to correctly time the market on a consistent basis.
3. THE MODERN PORTFOLIO THEORY (MPT)
Harry Markowitz in 1952 published an article "Portfolio Selection" in the Journal of Finance, he developed a hypothesis which is an investment theory based on the concept that the risk-averse investors can develop their portfolios to maximize expected returns based on a particular market, Level of risk, emphasizing that risk is an inherent aspect of higher premiums. MPT is an investment framework for building and selection of a portfolio based on performance maximizing and minimizing investment risks (Fabozzi, Gupta and Markowitz, 2002).
Fig 1. Markowitz Modern Portfolio Theory.(Source:…….)
4. THE EFFICIENT FRONTIER
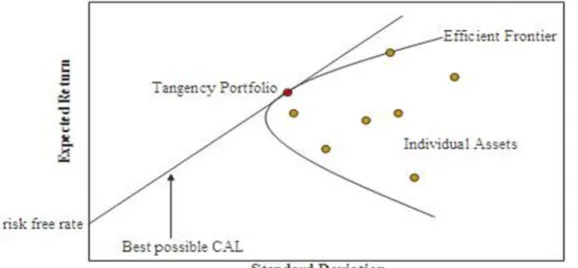
In order to weigh investment options, Markowitz propounded a system to describe each investment or each class of asset with mathematical formulas using unsystematic risk statistics. He then applied that to the portfolios that has the investment options. He considered the expected rate of return and the expected volatility for each investment. He named this risk and reward equation “The Efficient Frontier”. Fig 2 is a typical example of what the efficient frontier equation looks like when plotted which has an aim of maximizing returns while minimizing volatility. To evaluate investments, Markowitz proposed a system which describes any investment or any asset
class with mathematical formulas with the use of unsystematic risks. Then he applied this to portfolio investment opportunities, he carefully considered the expected return and expected volatility for each investment. He called this equation risk and reward "Efficient Frontier". Fig 2 below is typical of what appears to be a comparison of the efficient frontier when plotted with the aim of maximizing returns and reducing volatility.
Fig 2 The Efficient Frontier (retrieved from Wikipedia)
Portfolios along the efficient frontier should have higher returns on average, for the level of risk the portfolio assumes. From the graph it’s seen that a typical efficient frontier line starts with lower expected risk and returns as more and more the returns of an asset increase the greater the risk. Which implies that the greater the returns of a particular stock the greater the risk thereof. There is a limit to returns on investment as such it is seen from the graph that the efficient frontier curve flattens as it goes higher. Investing is a trade-off between risk and expected returns, this concept is true with what (Taleb, 2007) stated, generally, assets with higher expected risk are riskier. The MPT provides a means to properly select a portfolio with the highest possible expected return, thus the MPT proposes a trade-off between the selection of risk with higher expected return with lower risk and other risky portfolios.
A greater emphasis of the theory is the quantification of the relationship between risk and returns and the philosophy that investors must be compensated for holding risk. Portfolio theory departs from the traditional security analysis in shifting emphasis from the analyzing the characteristics of individual investments to determining the statistical relationships among the individual securities that comprise the overall portfolio (Edwin and Martins 1997)
The risk component of MPT can be measured using mathematical formulas via the concept of diversification in investment with the aim of selecting a collection of investment assets that has the lower risk than any individual asset or singular asset class. Diversification is the core concept of MPT and mainly lies on the adage of “never putting all your eggs in one basket” (fabozzi, Gupta, & Markowitz, 2002; McClure, 2010; Veneeya, 2006).
According to the work of (Bofah, n.d.; Wecker, n.d.; Markowitz, 1952) the framework for MPT includes numerous assumptions about markets and investors, some of these assumptions are explicit, while others are implicit
Modern Portfolio Theory lies on the following conventions and fundamentals:
• For buying and selling securities there are no transaction costs. There is no spread between bidding and asking prices. No tax is paid, its only risk that plays a part in determining which securities an investor will buy.
• An investor has a chance to take any position of any size and in any security. The market liquidity is infinite and no one can move the market. So that nothing can stop the investor from taking positions of any size in any security.
• While making investment decisions the investor does not consider taxes and is indifferent towards receiving dividends or capital gains.
• Investors are generally rational and risk adverse. They are completely aware of all the risk contained in investment and actually take positions based on the risk determination demanding a higher return for accepting greater volatility.
• The risk-return relationships are viewed over the same time horizon. Both long term speculator and short term speculator share the same motivations, profit target and time horizon.
their sale or purchase depends on an identical assessment of the investment and all have the same expectations from the investment. A seller will be motivated to make a sale only because another security has a level of volatility that corresponds to his desired return. A buyer will buy because this security has a level of risk that corresponds to the return he wants.
• Investors seek to control risk only by the diversification of their holdings. • In the market all assets can be bought and sold including human capital.
• Politics and investor psychology have no influence on market.
• The risk of portfolio depends directly on the instability of returns from the given portfolio. • An investor gives preference to the increase of utilization.
• An investor either maximizes his return for the minimum risk or maximizes his portfolio return for a given level of risk.
• Analysis is based on a single period model of investment.
According to (Iyio O, et al 2012), the theory does not really model the market. The risk, return and correlation used by MPT are based on expected values, which means that they are mathematical statements about the future.
5. DATA AND METHOD 5.1 DATA
The Data for the Dow Jones Index and the IBM stocks for the period January 1996 to 2015 was obtained from S&P500. This study further adjusted the stock prices into monthly returns.
The Dow Jones Industrial Average (DJIA) was employed because it is undoubtedly the most cited financial barometer in the world and has become synonymous with financial markets in general. When individuals say that the market has increased or decreased by some digits, they mostly denote the Dow. On the other hand the IBM stocks were selected randomly out of the number of stocks listed under the index
5.2 METHOD
This study tested the risk-return relationship using the model estimated in equations 1-3
∑ ……… (1) The equation 1 is further extended into
) + ) ……….(2)
) + (1- ) ……….(3)
Where Rp is the return on the portfolio, Ri is the return on the asset i and Wi is the weighing of the
component asset
RISK ( )
Risk is demonstrated whenever an investor is not sure of his return on investment. (Bofah,& ; McClure, 2010) defined risk as a deviation from expected historical returns in a particular period. Notwithstanding, Markowitz’ portfolio selection theory maintains that “the essential aspect pertaining to the risk of an asset is not the risk of each asset in isolation, but the contribution of each asset to the risk of the aggregate portfolio” (Royal Swedish Academy of Sciences, 1990). As discussed, the idea of risk generally is the possibility that actual return may vary from expected return. Investment of greater variance in terms of risk are considered very risky and vice versa.
Risk is different from uncertainty. Risk is the situation at which the tendency of expected return deviating from actual return can be quantified whereas uncertainty happens in a situation at which this condition can’t be quantified or the fact and figure regarding investment is not readily available.
Low levels of uncertainty are accompanied with low probable returns, whereas high levels of uncertainty are associated with high probable returns. With regards to the risk-return tradeoff, money invested can produce greater benefits only when the investor is willing to accept the possibility of losses. Hence investments with high risk has a high probability of ROI and vice versa
6. RISK MEASUREMENT AND VOLATITY: BETA COEFFICIENT
MPT, however, do not define risk as the probability of loss, but as the volatility, which is defined by statistical measures of variations, such as standard deviation and beta. The greater the standard deviation or beta, the greater the risk, according to the theory.
Beta measures risk of an asset relative to the market risk. The market risk is measured using the fluctuations of the market benchmark (market Index). Shares with β factor is more than 1 are considered less risky. One must note that β is a measure of systematic risk which cannot be diversified.
= ,
βɑ=Cov(rs,rb)
Var(rb) where rs is the return on the stock and rb is the return on a benchmark index .
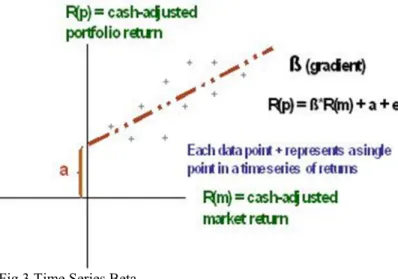
Beta helps us to understand the idea of passive and active risk. Fig 3 shows a time series of each returns labeled “+” for a particular portfolio R(p) against the market return R(m). The returns are cash adjusted, the point fit through the data point at which the x and y axes intersect is the cash – equivalent return. Drawing a line of best fit through the data points allows us to quantify the beta, which is referred to as alpha.
Beta helps us to understand the concept of passive and active risk. Fig 3 shows a time sequence returns labeled "+" for a specific portfolio R (p) against market returns yields R(m). The returns are cash adjusted, the point fit through the data point at which the x and y axes intersect is the cash – equivalent return. Drawing a line of best fit through the data points allows us to quantify the beta, which is referred to as alpha
Fig 3 Time Series Beta
The slope of the line is referred to as the beta.
A slope of 1.0 means that for each unit of market profitability increase, the performance of the portfolio increases by one. A manager using a passive management strategy may be tempted to increase portfolio performance by assuming more market risk (ie, a beta greater than 1), or alternatively, decreasing portfolio risk through Reducing the beta portfolio of less than 1. Essentially, beta expresses the fundamental balance between minimizing risk and maximizing profitability.
7. RESULTS AND DISCUSSION Table 1 Date PRICE IBM PRICE DOW J RETURN IBM RETURN. DOW J 01/12/2015 134.9264 17425.03 -1.70% -1.70% 02/11/2015 136.6911 17719.92 0.30% 0.30% 01/10/2015 136.062 17663.54 8.50% 8.50% 01/09/2015 140.8117 16284.7 -1.50% -1.50% 03/08/2015 143.6479 16528.03 -6.60% -6.60% 01/07/2015 156.0481 17689.86 0.40% 0.40% 01/06/2015 156.6935 17619.51 -2.20% -2.20% 01/05/2015 163.4271 18010.68 1.00% 1.00% 01/04/2015 163.7676 17840.52 0.40% 0.40% 02/03/2015 153.4514 17776.12 -2.00% -2.00% 02/02/2015 154.8282 18132.7 5.60% 5.60% 02/01/2015 145.5561 17164.95 -3.70% -3.70% 01/12/2014 152.3255 17823.07 0.00% 0.00% 03/11/2014 153.968 17828.24 2.50% 2.50% 01/10/2014 155.0242 17390.52 2.00% 2.00% 02/09/2014 179.004 17042.9 -0.30% -0.30%
Date PRICE IBM PRICE DOW J RETURN IBM RETURN. DOW J 01/08/2014 181.3331 17098.45 3.20% 3.20% 01/07/2014 179.6764 16563.3 -1.60% -1.60% 02/06/2014 169.9272 16826.6 0.70% 0.70% 01/05/2014 172.8238 16717.17 0.80% 0.80% 01/04/2014 183.1099 16580.84 0.70% 0.70% 03/03/2014 179.4006 16457.66 0.80% 0.80% 03/02/2014 172.5783 16321.71 4.00% 4.00% 02/01/2014 163.7679 15698.85 -5.30% -5.30% 02/12/2013 173.862 16576.66 3.00% 3.00% 01/11/2013 166.5486 16086.41 3.50% 3.50% 01/10/2013 165.2257 15545.75 2.80% 2.80% 03/09/2013 170.7298 15129.67 2.20% 2.20% 01/08/2013 168.0469 14810.31 -4.40% -4.40% 01/07/2013 178.9259 15499.54 4.00% 4.00% 03/06/2013 175.3206 14909.6 -1.40% -1.40% 01/05/2013 190.8336 15115.57 1.90% 1.90% 01/04/2013 184.9395 14839.8 1.80% 1.80% 01/03/2013 194.7644 14578.54 3.70% 3.70% 01/02/2013 183.3781 14054.49 1.40% 1.40% 02/01/2013 184.6462 13860.58 5.80% 5.80% 03/12/2012 174.1714 13104.14 0.60% 0.60% 01/11/2012 172.8256 13025.58 -0.50% -0.50% 01/10/2012 176.1103 13096.46 -2.50% -2.50% 04/09/2012 187.8069 13437.13 2.60% 2.60% 01/08/2012 176.4 13090.84 0.60% 0.60% 02/07/2012 176.6686 13008.68 1.00% 1.00% 01/06/2012 176.3081 12880.09 3.90% 3.90% 01/05/2012 173.8921 12393.45 -6.20% -6.20% 02/04/2012 185.8961 13213.63 0.00% 0.00% 01/03/2012 187.3055 13212.04 2.00% 2.00% 01/02/2012 176.6049 12952.07 2.50% 2.50% 03/01/2012 172.2267 12632.91 3.40% 3.40% 01/12/2011 164.4291 12217.56 1.40% 1.40% 01/11/2011 168.1133 12045.68 0.80% 0.80% 03/10/2011 164.4388 11955.01 9.50% 9.50% 01/09/2011 155.7461 10913.38 -6.00% -6.00% 01/08/2011 153.1098 11613.53 -4.40% -4.40% 01/07/2011 161.2606 12143.24 -2.20% -2.20% 01/06/2011 152.1268 12414.34 -1.20% -1.20% 02/05/2011 149.8034 12569.79 -1.90% -1.90% 01/04/2011 150.5931 12810.54 4.00% 4.00% 01/03/2011 143.9631 12319.73 0.80% 0.80% 01/02/2011 142.9125 12226.34 2.80% 2.80%
Date PRICE IBM PRICE DOW J RETURN IBM RETURN. DOW J 03/01/2011 142.4544 11891.93 2.70% 2.70% 01/12/2010 129.0531 11577.51 5.20% 5.20% 01/11/2010 124.3926 11006.02 -1.00% -1.00% 01/10/2010 125.7158 11118.49 3.10% 3.10% 01/09/2010 117.4339 10788.05 7.70% 7.70% 02/08/2010 107.7951 10014.72 -4.30% -4.30% 01/07/2010 111.8545 10465.94 7.10% 7.10% 01/06/2010 107.5685 9774.02 -3.60% -3.60% 03/05/2010 109.1192 10136.63 -7.90% -7.90% 01/04/2010 111.8041 11008.61 1.40% 1.40% 01/03/2010 111.1541 10856.63 5.10% 5.10% 01/02/2010 110.2094 10325.26 2.60% 2.60% 04/01/2010 105.6029 10067.33 -3.50% -3.50% 01/12/2009 112.9457 10428.05 0.80% 0.80% 02/11/2009 109.0198 10344.84 6.50% 6.50% 01/10/2009 103.6021 9712.73 0.00% 0.00% 01/09/2009 102.7431 9712.28 2.30% 2.30% 03/08/2009 101.4031 9496.28 3.50% 3.50% 01/07/2009 100.8298 9171.61 8.60% 8.60% 01/06/2009 89.27876 8447 -0.60% -0.60% 01/05/2009 90.86905 8500.33 4.10% 4.10% 01/04/2009 87.78569 8168.12 7.30% 7.30% 02/03/2009 82.41019 7608.92 7.70% 7.70% 02/02/2009 78.2765 7062.93 -11.70% -11.70% 02/01/2009 77.5315 8000.86 -8.80% -8.80% 01/12/2008 71.19533 8776.39 -0.60% -0.60% 03/11/2008 69.02969 8829.04 -5.30% -5.30% 01/10/2008 78.21094 9325.01 -14.10% -14.10% 02/09/2008 98.3925 10850.66 -6.00% -6.00% 01/08/2008 102.4053 11543.96 1.50% 1.50% 01/07/2008 107.2454 11378.02 0.20% 0.20% 02/06/2008 99.32639 11350.01 -10.20% -10.20% 01/05/2008 108.4604 12638.32 -1.40% -1.40% 01/04/2008 100.7331 12820.13 4.50% 4.50% 03/03/2008 96.09283 12262.89 0.00% 0.00% 01/02/2008 95.02457 12266.39 -3.00% -3.00% 02/01/2008 89.05072 12650.36 -4.60% -4.60% 03/12/2007 89.8738 13264.82 -0.80% -0.80% 01/11/2007 87.44613 13371.72 -4.00% -4.00% 01/10/2007 96.20036 13930.01 0.20% 0.20% 04/09/2007 97.59217 13895.63 4.00% 4.00% 01/08/2007 96.67259 13357.74 1.10% 1.10% 02/07/2007 91.34573 13211.99 -1.50% -1.50%
Date PRICE IBM PRICE DOW J RETURN IBM RETURN. DOW J 01/06/2007 86.88783 13408.62 -1.60% -1.60% 01/05/2007 88.0023 13627.64 4.30% 4.30% 02/04/2007 84.05103 13062.91 5.70% 5.70% 01/03/2007 77.51345 12354.35 0.70% 0.70% 01/02/2007 76.42796 12268.63 -2.80% -2.80% 03/01/2007 81.2897 12621.69 1.30% 1.30% 01/12/2006 79.64997 12463.15 2.00% 2.00% 01/11/2006 75.36207 12221.93 1.20% 1.20% 02/10/2006 75.45337 12080.73 3.40% 3.40% 01/09/2006 66.96252 11679.07 2.60% 2.60% 01/08/2006 66.16982 11381.15 1.70% 1.70% 03/07/2006 63.00924 11185.68 0.30% 0.30% 01/06/2006 62.529 11150.22 -0.20% -0.20% 01/05/2006 65.03602 11168.31 -1.70% -1.70% 03/04/2006 66.78066 11367.14 2.30% 2.30% 01/03/2006 66.8861 11109.32 1.10% 1.10% 01/02/2006 65.07748 10993.41 1.20% 1.20% 03/01/2006 65.77204 10864.86 1.40% 1.40% 01/12/2005 66.50014 10717.5 -0.80% -0.80% 01/11/2005 71.92047 10805.87 3.50% 3.50% 03/10/2005 66.0828 10440.07 -1.20% -1.20% 01/09/2005 64.74307 10568.7 0.80% 0.80% 01/08/2005 65.0659 10481.6 -1.50% -1.50% 01/07/2005 67.19637 10640.91 3.60% 3.60% 01/06/2005 59.74083 10274.97 -1.80% -1.80% 02/05/2005 60.82777 10467.48 2.70% 2.70% 01/04/2005 61.33312 10192.51 -3.00% -3.00% 01/03/2005 73.37812 10503.76 -2.40% -2.40% 01/02/2005 74.34172 10766.23 2.60% 2.60% 03/01/2005 74.8734 10489.94 -2.70% -2.70% 01/12/2004 79.00899 10783.01 3.40% 3.40% 01/11/2004 75.5306 10428.02 4.00% 4.00% 01/10/2004 71.79319 10027.47 -0.50% -0.50% 01/09/2004 68.5855 10080.27 -0.90% -0.90% 02/08/2004 67.74558 10173.92 0.30% 0.30% 01/07/2004 69.50224 10139.71 -2.80% -2.80% 01/06/2004 70.36433 10435.48 2.40% 2.40% 03/05/2004 70.71555 10188.45 -0.40% -0.40% 01/04/2004 70.23789 10225.57 -1.30% -1.30% 01/03/2004 73.16148 10357.7 -2.10% -2.10% 02/02/2004 76.87372 10583.92 0.90% 0.90% 02/01/2004 78.92056 10488.07 0.30% 0.30% 01/12/2003 73.71114 10453.92 6.90% 6.90%
Date PRICE IBM PRICE DOW J RETURN IBM RETURN. DOW J 03/11/2003 72.00914 9782.46 -0.20% -0.20% 01/10/2003 71.03742 9801.12 5.70% 5.70% 02/09/2003 70.12444 9275.06 -1.50% -1.50% 01/08/2003 65.10704 9415.82 2.00% 2.00% 01/07/2003 64.37444 9233.8 2.80% 2.80% 02/06/2003 65.36482 8985.44 1.50% 1.50% 01/05/2003 69.75416 8850.26 4.40% 4.40% 01/04/2003 67.14335 8480.09 6.10% 6.10% 03/03/2003 62.02653 7992.13 1.30% 1.30% 03/02/2003 61.64692 7891.08 -2.00% -2.00% 02/01/2003 61.72456 8053.81 -3.50% -3.50% 02/12/2002 61.17205 8341.63 -6.20% -6.20% 01/11/2002 68.60741 8896.09 5.90% 5.90% 01/10/2002 62.19424 8397.03 10.60% 10.60% 03/09/2002 45.94054 7591.93 -12.40% -12.40% 01/08/2002 59.38943 8663.5 -0.80% -0.80% 01/07/2002 55.34332 8736.59 -5.50% -5.50% 03/06/2002 56.60112 9243.26 -6.90% -6.90% 01/05/2002 63.24389 9925.25 -0.20% -0.20% 01/04/2002 65.71686 9946.22 -4.40% -4.40% 01/03/2002 81.59686 10403.94 2.90% 2.90% 01/02/2002 76.98351 10106.13 1.90% 1.90% 02/01/2002 84.53742 9920 -1.00% -1.00% 03/12/2001 94.77844 10021.57 1.70% 1.70% 01/11/2001 90.57076 9851.56 8.60% 8.60% 01/10/2001 84.5741 9075.14 2.60% 2.60% 04/09/2001 71.77882 8847.56 -11.10% -11.10% 01/08/2001 78.21951 9949.75 -5.40% -5.40% 02/07/2001 82.22742 10522.81 0.20% 0.20% 01/06/2001 88.70651 10502.4 -3.80% -3.80% 01/05/2001 87.37787 10911.94 1.60% 1.60% 02/04/2001 89.87956 10734.97 8.70% 8.70% 01/03/2001 75.07918 9878.78 -5.90% -5.90% 01/02/2001 77.98305 10495.28 -3.60% -3.60% 02/01/2001 87.32892 10887.36 0.90% 0.90% 01/12/2000 66.27641 10787.99 3.60% 3.60% 01/11/2000 72.90405 10414.49 -5.10% -5.10% 02/10/2000 76.70507 10971.14 3.00% 3.00% 01/09/2000 87.70466 10650.92 -5.00% -5.00% 01/08/2000 102.8048 11215.1 6.60% 6.60% 03/07/2000 87.31493 10521.98 0.70% 0.70% 01/06/2000 85.22443 10447.89 -0.70% -0.70% 01/05/2000 83.47424 10522.33 -2.00% -2.00%
Date PRICE IBM PRICE DOW J RETURN IBM RETURN. DOW J 03/04/2000 86.62702 10733.91 -1.70% -1.70% 01/03/2000 91.96838 10921.92 7.80% 7.80% 01/02/2000 79.82893 10128.31 -7.40% -7.40% 03/01/2000 87.11801 10940.53 -4.80% -4.80% 01/12/1999 83.72254 11497.12 5.70% 5.70% 01/11/1999 79.98753 10877.81 1.40% 1.40% 01/10/1999 76.15112 10729.86 3.80% 3.80% 01/09/1999 93.78409 10336.95 -4.50% -4.50% 02/08/1999 96.54529 10829.28 1.60% 1.60% 01/07/1999 97.32235 10655.15 -2.90% -2.90% 01/06/1999 100.0809 10970.8 3.90% 3.90% 03/05/1999 89.82113 10559.74 -2.10% -2.10% 01/04/1999 80.89741 10789.04 10.20% 10.20% 01/03/1999 68.54647 9786.16 5.20% 5.20% 01/02/1999 65.64606 9306.58 -0.60% -0.60% 04/01/1999 70.77288 9358.83 1.90% 1.90% 01/12/1998 71.20737 9181.43 0.70% 0.70% 02/11/1998 63.77284 9116.55 6.10% 6.10% 01/10/1998 57.26743 8592.1 9.60% 9.60% 01/09/1998 49.55464 7842.62 4.00% 4.00% 03/08/1998 43.43262 7539.07 -15.10% -15.10% 01/07/1998 51.00988 8883.29 -0.80% -0.80% 01/06/1998 44.20055 8952.02 0.60% 0.60% 01/05/1998 45.23518 8899.95 -1.80% -1.80% 01/04/1998 44.52629 9063.37 3.00% 3.00% 02/03/1998 39.91515 8799.81 3.00% 3.00% 02/02/1998 40.1313 8545.72 8.10% 8.10% 02/01/1998 37.86958 7906.5 0.00% 0.00% 01/12/1997 40.12259 7908.3 1.10% 1.10% 03/11/1997 41.9921 7823.1 5.10% 5.10% 01/10/1997 37.70018 7442.1 -6.30% -6.30% 02/09/1997 40.57076 7945.3 4.20% 4.20% 01/08/1997 38.80057 7622.4 -7.30% -7.30% 01/07/1997 40.40003 8222.6 7.20% 7.20% 02/06/1997 34.47852 7672.8 4.70% 4.70% 01/05/1997 33.04589 7331 4.60% 4.60% 01/04/1997 30.65818 7009 6.50% 6.50% 03/03/1997 26.21704 6583.48 -4.30% -4.30% 03/02/1997 27.45865 6877.74 0.90% 0.90% 02/01/1997 29.89524 6813.09 5.70% 5.70% 02/12/1996 28.87094 6448.27 -1.10% -1.10% 01/11/1996 30.37166 6521.7 8.20% 8.20% 01/10/1996 24.51712 6029.38 2.50% 2.50%
Date PRICE IBM PRICE DOW J RETURN IBM RETURN. DOW J 03/09/1996 23.66187 5882.17 4.70% 4.70% 01/08/1996 21.73756 5616.21 1.60% 1.60% 01/07/1996 20.3657 5528.91 -2.20% -2.20% 03/06/1996 18.75539 5654.63 0.20% 0.20% 01/05/1996 20.22362 5643.18 1.30% 1.30% 01/04/1996 20.34558 5569.08 -0.30% -0.30% 01/03/1996 21.00646 5587.14 1.90% 1.90% 01/02/1996 23.15431 5485.62 1.70% 1.70% 02/01/1996 20.44256 5395.3 #DIV/0!
(Authors computation: Monthly returns on stock prices of IBM stocks and the Dow Jones index)
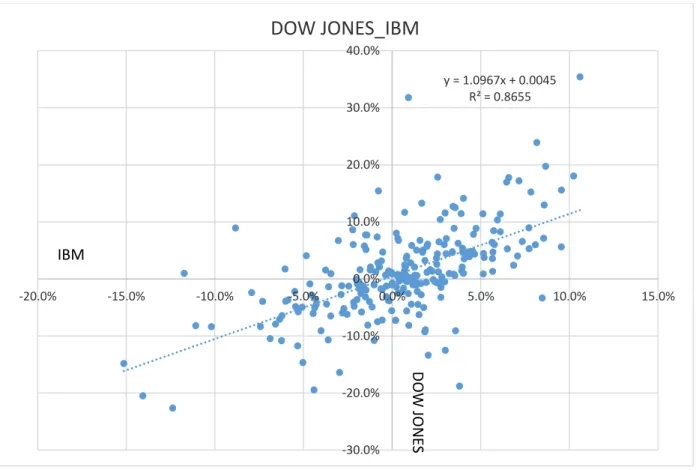
Figure 4: Liner Regression Chart
Figure 4 shows linear regression analysis for the monthly stock returns of Dow Jones and IBM from 1996-2015. The regression analysis revealed that y=1.0967x+0.0045. This implies that for every increase in 1 unit of Dow Jones returns; there is a 1.0967-unit increase in the returns for IBM this also refers to the slope of the line.
The R2=0.8655 implies that about 87% of the variation in IBM returns can be explained by the fluctuations in the Dow Jones returns.
In summary as the Dow Jones stock returns increases, IBM stock returns also increases but with a close or smaller variations. It can therefore be concluded that there is a positive relationship between IBM stock returns and the Dow jones index.
y = 1.0967x + 0.0045 R² = 0.8655 -30.0% -20.0% -10.0% 0.0% 10.0% 20.0% 30.0% 40.0% -20.0% -15.0% -10.0% -5.0% 0.0% 5.0% 10.0% 15.0%
DOW JONES_IBM
D
O
W
J
O
N
E
S
IBM
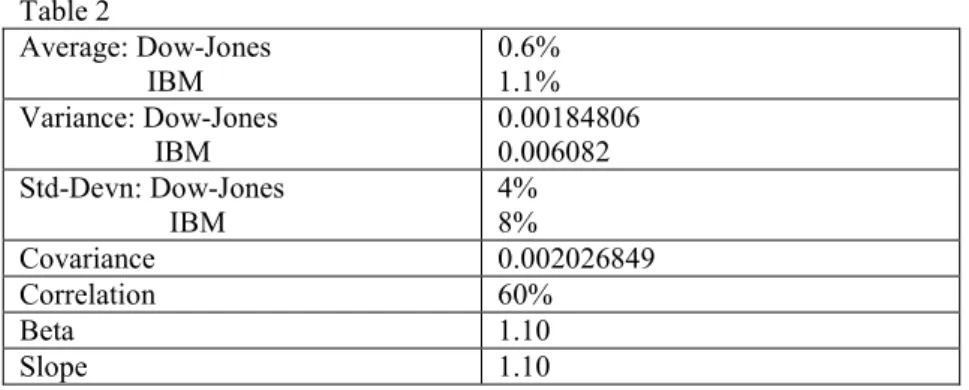
Table 2 Average: Dow-Jones IBM 0.6% 1.1% Variance: Dow-Jones IBM 0.00184806 0.006082 Std-Devn: Dow-Jones IBM 4% 8% Covariance 0.002026849 Correlation 60% Beta 1.10 Slope 1.10 Authours Computations 8. Conclusion
From the analysis it can be said that there is a positive relationship between a stock and an index thus IBM stocks and the Dow Jones index.
There are many factors which can have a significant effect on the returns of a particular stock which includes the micro and macro demand and supply forces e.g. Industrial capitalization, corporate governance, political shocks etc.
Investors and policy makers must consider some of these forces that affect stock returns before making any decision as far as returns on equities are concerned. There should investor are advised to hold a diversified portfolio in other to avoid shocks that will arise from ROI failures.
References
Bofah K. (1989). Portfolio theory explained. Retrieved on 12/06/17 from http://www.ehow.com/about 5436842_potfolio theory explain.html
Edwin JE, Martin JG (1997). Modern Portfolio Theory, 1950 to date. J Bank. Fin., 21:1743-1759
Fabozzi F, Gupta, F., & Markowitz, H. (2002). The legacy of modern portfolio theory, journal of investment, 49, 2, 63-77.
Iyiola O, Munirat Y, & Nwufo C (2012). The Modern Portfolio Throey as an investment decision tool. Journal of Accounting and Txation Vol. 4(2), pp 19-28.
McClure B. (2010). Modern Portfolio theory: why it’s still hip, Investopedia, retrieve on 02/01/17 from
http://www.investorpedia.com/articles/06/MPT. aspNaxzz1g3jqy7ny.
Magginson W. (1996). A historical overview of research in finance. Journal of finance, 39,2,323-346. Royal Swedish Academy of Science. (1990). This year’s laureates pioneers in the theory of financial
economic and cooperate finance. Retrieve on 07/06/16 from
http://www.nobelprize.org/nobel_prizes/economic
Tobin J. (1958). Liquidity preference as behaviour toward risk review of economic studies, 65-85 Taleb NN (2007). The Black Swan. The Impact of the Highly Improbable, Random House. Pp 80-120
Veneeya, V. (2006). Analysis of modern portfolio theory.coursework4you. Retrieve on 12/06/16 from http://www.articlebase.com/finance-article/analysis-ofmodern-portfolio-theory-40421.html. Taleb NN (2007). The Black Swan: The Impact of the Highly Improbable, Random House, pp. 80-120.
First Author: Tan ZhongMing is a Professor for the school of Applied Economics of Jiangsu University in China. He holds a doctoral degree in Management Science & Engineering from Jiangsu University. His areas of research includes Commercial Bank Management, Credit Management and Corporate Financing, Insurance Policy and Risk Management
The first paragraph may contain a place and/or date of birth (list place, then date). Next, the author’s educational background is listed. The degrees should be listed with type of degree in what field, which institution, city, state, and country, and year degree was earned. The author’s major field of study should be lower-cased
Second Author: Prince Koomson was born in Ghana in the year 1989 in the western region. He holds a Bachelor in Business Education (B.ed Business) degree from the University for Development Studies UDS in Ghana, Wa campus and was awarded this certificate in 2014. Currently he is a Masters student in Jiangsu University in China reading Applied Economics with stocks and investment banking as his research field. Third Author: Dr. Ding Guoping is currently a lecturer as the department of Finance and Applied Economics of Jiangsu University in China.