Munich Personal RePEc Archive
Monetary policy transmission and
income inequality in Sub-Saharan Africa
Ahiadorme, Johnson Worlanyo
University of Verona
20 August 2020
Online at
https://mpra.ub.uni-muenchen.de/104084/
Monetary policy transmission and income inequality in Sub-Saharan
Africa
Johnson Worlanyo Ahiadorme
Department of Economics, University of Verona, 37129 Verona, Italy
Email: johnsonworlanyo.ahiadorme@univr.it
Abstract
This paper evaluates the monetary policy transmission and income inequality in Sub-Saharan Africa (SSA) countries. We find procyclical response of income inequality to unanticipated monetary easing in the last two decades. Countercyclical monetary measures may have been efficient, but they have been dis-equalising as well. Taking cognisance of the explanations of the earnings heterogeneity channel, this evidence signals high concentration of assets and resources, limited employment of labour and limited distributive capacity of the state in SSA countries. Economic outturns may have favoured chiefly, the top of the distribution - entrepreneurs and their profit margin. Three main channels distinguish the transmission of standard and non-standard monetary measures: the reaction in the stock market, the response of the exchange rate and the fiscal response. Unconventional monetary policies appear to rely more on wealth effects than conventional policy measures. Unexpected non-standard monetary easing depreciates the exchange rate while unanticipated conventional accommodative monetary action appreciates the currency. Fiscal transfers increase in reaction to expansionary unconventional monetary policy shock. In contrast, a surprised standard monetary expansion decreases fiscal distributions, an effect that appears to underscore the limited fiscal space and tax revenues in most developing and emerging economies. The evidence demonstrates that the fiscal reaction to monetary policy action is important to the overall transmission of monetary policy to macroeconomic aggregates. Instructively, we find that the inflation cost of countercyclical monetary measures is comparatively less severe for standard monetary measures than non-standard monetary actions.
Key words: Monetary policy, Income inequality, Distributive channels
Introduction
The international development debate has witnessed significant shifts with the emergence of the Sustainable Development Goal (SDGs) and this has heightened the attention to inequality. Increasing evidence of the ramifications of the surging inequality - that high inequality limits the younger generations’ economic opportunities and mobility, decreases the “growth elasticity of poverty”, harms sustainable economic growth and macroeconomic and financial stability, and endangers political and socio-economic stability (Dabla-Norris et al., 2015; Berg et al., 2018) – further explains why stakeholders in world development, including policymakers are increasingly concerned about the role of distributive programmes and the distributional consequences of monetary and fiscal policies. There is a conventional view that monetary policy has a disproportionate effect and redistribution is a side effect of changes in monetary policy (Auclert, 2019). This paper is concerned with the propagation of monetary policy shocks to income inequality.
The worries over economic inequality have been expressed in the history of the global economy and date as far back as the days of Thomas Malthus, David Ricardo and Karl Marx. Kuznets (1955) identifies a country’s level of development as a key explanation of the observed distribution of income in a country. According to the Kuznets hypothesis, as countries move through the development stages, they attain greater equality after swinging from the initial phases of relative equality to inequality (Galli and von der Hoeven, 2001). However, extant literature has shown that the prediction by the Kuznets hypothesis is a limited explanation of the variations in the income distribution in a country. Galli and von der Hoeven (2001) document that empirical studies have alluded to human capital or state employment, social transfers, government spending and tax as other policy and structural variables explaining the cross-country differences in income distribution. The distributional consequence of monetary policy has gained increased recognition and has been documented in both theoretical empirical literature (Coibion et al., 2017; Cravino, Lan and Levchenko, 2018).
Literature takes cognisance of the potential role of monetary policies to create regressive distributional consequences (Ampudia et al., 2018)1 but empirical work on this issue in Africa is
rather limited (Bhorat et al., 2017). Macroeconomic policies moderate economic activities and the gains from these changes are distributed disproportionately due to diverse individual idiosyncrasies2. Monetary actions affect aggregate output, unemployment, inflation and asset
prices at least in the short run and the presence of heterogeneity naturally exposes the distributional implications of monetary policies, at least in theory. Previous papers (for example,
1 See Colciago, Samarina and de Haan (2019) for review of the literature
2 In the UK and the US, Cloyne, Ferreira, and Surico (2020) find that monetary expansion directly affects
household consumption and firm investment to boost aggregate demand. However, balance-sheet-driven heterogeneity implies that mortgagors and outright homeowners are affected differently.
Villarreal, 2014; Coibion et al., 2017)3 have shown significant links between monetary policy
and income inequality. However, findings on the redistributive effects of monetary policy is rather disparate and incongruent. Income inequality may be aggravated by expansionary monetary policy (Inui et al., 20174; Dolado et al., 20185). On the other hand, Guerello (2018)
finds that expansionary monetary policy in the form of long-run interest rate is associated with decreasing income inequality for the Euro area. In the UK, Mumtaz and Theophilopoulou (2017)6 find that quantitative easing decreases inequality while economic inequality is worsened
by contractionary monetary policy. In the US, Davtyan (2017)7 finds that restrictive monetary
policy exerts a downward pressure on income inequality while in Italy, Casiraghi et al. (2018)8
find that the total effect of the recent monetary policy measures on inequality is negligible. In another study, Furceri, Loungani and Zdzienicka (2018) report asymmetric impact of monetary policy on income inequality9. The debate remains unresolved and the stylised findings on the
distributional effects of monetary policy may not be portable across countries and across jurisdictions. This paper contributes to the growing literature on the distributional consequences of monetary policy.
In the midst of the financial crises, Draghi (2015) submits that central banks have become constrained in their ability to deploy conventional monetary policy tools and have resorted to applying new instruments to achieve the same results. Draghi (2015) reiterates the concern that these new instruments may have different distributional consequences than conventional
3 Coibion
et al. (2017) follow Romer and Romer (2004) to identify monetary policy innovations and find
that monetary policy exerts significant effects on consumption and income inequality in the US. In Mexico, Villarreal (2014) finds that an unanticipated increase in nominal interest rate significantly reduces income inequality.
4 Inui et al. (2017) infer that a structural dispersion of wages across workers arising from nominal wage
stickiness and labour market rigidities could account for the rising earnings inequality associated with monetary expansion.
5 In a Two Agents New Keynesian (TANK) model, they explore capital-skill complementarity and find
that wages for high-skilled workers increase more than wages for low-skilled ones in the presence of an unexpected monetary easing and thereby widening the earning inequality
6 For the identification of a monetary policy shock, they apply sign restrictions while constructing
inequality measures from survey data. Mumtaz and Theophilopoulou (2017) emphasise that irrespective of alternative specifications of the VAR, monetary policy shock makes significant contributions to historical fluctuations in the measures of inequality.
7 Davtyan (2017) applies the contemporaneous and the long run identification methods and utilises the
vector error correction methodology for the identification of monetary policy innovations and concludes that monetary policy may be considered as another policy direction to reduce inequality.
8 Casiraghi et al. (2018) indeed express doubt over the dis-equalizing view of non-standard monetary
policy measures in the Euro area. They allude to the negligible redistributive (or not) impact of monetary policy (standard or not) and point out to the U-shaped nature of the response of income along the wealth distribution. Aside, the improvement in the financial and asset markets, non-standard monetary policy measures may produce easing credit conditions and improve macroeconomic conditions which may enhance poorer households’ labour income.
9 The upward effect of restrictive monetary policy on inequality exceeds the downward pressure exerted
monetary policy. Against this background, this paper considers the impact of both conventional and unconventional monetary policy on inequality. Existing evidence suggests symmetric distributional effects of monetary actions - monetary expansion reduces income inequality (Samarina and Nguyen, 2019) while restrictive monetary policy heightens economic inequality (Areosa and Areosa, 2016). This research is concerned with the distributional impacts of monetary policy in Sub Saharan Africa and examines whether the impact is symmetric across expansionary and contractionary monetary actions.
Africa is a continent bedevilled by the developmental challenge of inequality – a challenge not entirely independent of policy choices. Africa is recorded as the second most unequal continent in the world, and home to seven of the most unequal countries (Seery, Okanda and Lawson, 2019). The United Nations World Population prospects show that the proportion of the world’s population accounted for by Africa (particularly Sub-Saharan Africa) will increase significantly by 2050 while the fraction contributed by the rest of the world will decrease10. This implies that
with the current trend of inequality in Africa, the evolution of global inequality will largely be driven by the level of economic inequality in Africa. The debate of the distributional consequences of economic policies is perhaps most critical in Africa. Africa grapples with widening inequality and unsurprisingly, Sub-Saharan Africa (SSA) remains one of the world’s region with relatively high levels of economic inequality with Sub-Saharan African countries constituting 10 of the 19 most unequal countries globally (Odusola et al., 2017). Between the period of 1993 and 2008, inequality among all Sub-Saharan Africans upped significantly (Jirasavetakul and Lakner, 2016). Yet from a political, policy and research perspective, there have been little attention to the issue of inequality in SSA historically (Odusola et al., 2017). During the post-independence decades, income inequality in SSA was mainly driven by the distribution of assets, the structure of the economy, policies affecting redistribution and returns on assets (Odusola et al., 2017). The high concentration of assets and resources, limited employment of labour and the limited distributive capacity of the state typify the structures of most SSA countries and sum up the drivers of inequality in these countries (Odusola et al., 2017). Incidentally, these factors underscore the potential channels for a distributive role of monetary policy in SSA. Monetary actions (expansive monetary policy) may improve growth, economic activities and asset prices to benefit those with controlling interests in assets and resources while also generating employment to benefit the masses. The potential fiscal response11
may also improve the fiscal distributive capacity of the state and consequently, reduce income inequality. In the last three decades, monetary policy has become increasingly important in SSA countries, as capital accounts have been liberalized. IMF sponsored economic reforms, financial liberalisation, the large movements in global capital, the rise in private investment funds and
10 See United Nations, Department of Economic and Social Affairs, Population Division (2019). World
Population Prospects 2019: Highlights (ST/ESA/SER.A/423).
11The fiscal response to monetary actions and the consequential effects on income inequality is a
conspicuous feature in Heterogenous Agent New Keynesian models (for example Kaplan, Moll and Violante, 2018).
access to the international capital markets have compelled many of these countries to adopt exchange rate regimes with more flexibility and greater scope for monetary policy. The notion of monetary policy in seemingly an “unconventional” environment has emboldened the question of monetary transmissions in SSA. The research agenda is huge, but the literature is sparse. This study connects also with the research on monetary transmission in emerging and developing economies and evaluates the redistributive effects of monetary policy in SSA. Auclert (2019) emphasises that the aggregate effects of monetary policy are better appreciated with an understanding of its redistributive effects. The distributional impact of both conventional and unconventional monetary actions is empirically examined for Sub-Saharan Africa countries. The analysis involves the identification of monetary policy shock for Sub Saharan Africa countries and the evaluation of the transmission channels of monetary actions.
We identify monetary policy shock in a sign restricted VAR à la Uling (2005) and investigate its propagation to income inequality via impulse response analysis. Consistent with conventional wisdom, we assume that monetary expansion should raise prices and real output on impact following a shock. Thus, our baseline specification proceeds with the aid of vector autoregressions in line with the workhorse framework on the effects of monetary policy. In an alternative econometric implementation, we regress a measure of income inequality on monetary policy. We proxy monetary policy by the shock series obtained via a Cholesky decomposition identification scheme in a structural vector autoregressions. Our main finding is that the heterogeneity in households’ financial assets and liabilities is important in the distributional consequences of monetary policy. Our empirical results decompose the inequality effect of a transitory change in monetary policy into the direct effects, alongside the contribution from macroeconomic and financial channels and the role of fiscal response. We find procyclical response of income inequality to unexpected monetary easing in the last two decades.
Countercyclical monetary actions may have been efficient, but their distributional consequences
have been dis-equalising. Consistent with the results in other jurisdictions, the overall effects of monetary policy on income inequality are quantitatively modest, compared to its evolution. The evidence for our sample demonstrates that the transmission of conventional monetary policy shocks and unconventional monetary policy shocks are diverse. Stark differences are noticed in the reaction of the stock market, the response of the exchange rate, and the fiscal response. The equity index increases strongly in response to unforeseen, unconventional accommodative monetary action, but reacts moderately after unanticipated conventional monetary easing. The exchange rate depreciates after unexpected non-standard monetary expansion but appreciates in response to accommodative standard monetary policy shock. The variation in the reaction of the exchange rate may be largely attributable to the relative strength of the liquidity demand feature of monetary transmission. Fiscal transfers fall in response to expansionary conventional monetary policy shock but increase after innovations in non-standard accommodative monetary measures. The fiscal reactions may signal the haunting fiscal dominance of central bank actions
and the generally low level of tax revenues that limits the distributive capacity of governments in SSA countries.
We find some evidence of persistence in the response of inequality to monetary policy shock, corroborating the observation in the empirical literature. Albeit, our findings show that the Gini coefficient display considerable degree of persistence. Unconventional monetary measures appear to be more inflationary than standard monetary actions. This may imply that countercyclical monetary actions incur less inflation cost when exercised via standard measures than non-standard measures. This evidence may also suggest that inflation expectations are more anchored, and signals of policy intentions are better projected through standard monetary measures.
The remainder of this paper is organized as follows. Section I provides an overview of the distributive channels of monetary policy. Section II describes the data, characterizes the study sample, and discusses the empirical methods. Section III investigates the inequality effects of conventional monetary policy. Section IV then examines the impact of non-standard monetary policy actions on income inequality. Section V considers the estimates with current data and Section VI concludes.
I. Distributive Channels of Monetary Policies
Nakajima (2015) takes cognisance of the fact that monetary policy affects economic activity as well as prices and identifies two general distribution channels of monetary policy: income and inflation channels. The inflation channel constitutes of the savings redistribution and the portfolio composition channels. The income channel includes the earnings heterogeneity and the income composition channels. Davtyan (2017) considers real output and prices as the general distributive channels of monetary policy. Monetary actions typically produce three main changes which identify the distributive channels of monetary policy: monetary easing produces increases in real income, rises in inflation and reductions in real interest rates.
First, monetary actions affect economic activities and have implications for employments, profits and real wages. Auclert (2019) identifies the earnings heterogeneity channel and clarifies that the heterogeneity in households’ earnings positions individuals to benefit disproportionately from monetary actions and the consequential changes in wages and profits. Samarina and Nguyen (2019) consider the macroeconomic transmission channel of monetary policy and indicate that monetary easing lowers income inequality by raising labour earnings since the lower end of the income distribution depends on labour earning as their main source of income. Galli and von der Hoeven (2001) emphasise that monetary policy affects income distribution through employment and aggregate income. Restrictive monetary measures worsen economic growth and unemployment in the short run. Generally, the hiring and firing costs are relatively higher for skilled workers; thus, restrictive monetary measures increase income inequality as the associated unemployment tends to hurt mostly low-skilled workers. The surge in unemployment is
strengthened by the growth in real wages12 (Tokarick and Leidy, 1998) to further exacerbate the
impacts of contractionary monetary measures on economic inequality. In their study of Korea, Kang et al. (2013) find that GDP growth from monetary expansions decreases economic inequality. In the Euro area, Lenza and Slacalek (2018) find that QE exerts a downward pressure on income inequality, mostly via the earnings heterogeneity channel and improved macroeconomic indicators which has seen considerable reduction in the unemployment rate (benefiting the poorer part of the population) and wage increases for the employed.
Secondly, inflation surprises impact on non-indexed nominal fixed incomes to affect income inequality. Inflation arising out of monetary restrictions erodes purchasing power to increase income inequality since the chunk of the income of the poor emanates from transfers and pensions. However, Auclert (2019) classifies the inflation effects as the Fisher channel and indicates that monetary actions necessitate the repayments of interest between savers and borrowers. Unexpected inflation hurts nominal creditors and benefits nominal debtors by revaluing nominal balance sheets. Thus, rises in inflation lessens income inequality since the top houses more net lenders than the bottom of income distribution. Doepke and Schneider (2006) explore this transmission channel for the United States and conclude that inflation hurts uninsured income sources. Albanesi (2007) observes high exposure of low-income households to inflation and demonstrates that a higher inflation rate is accompanied by greater income inequality. In an earlier study, Easterly and Fischer (2001) identify inflation as a top concern to the poor than the rich. However, Kang et al. (2013) show that in the short-run, inflation decreases economic inequality in Korea.Galli and von der Hoeven (2001)13 conclude that the relationship
between income inequality and inflation is nonmonotonic.
Lastly, monetary policies may impact on assets prices to affect economic inequality. Auclert (2019) terms this transmission channel as the interest rate exposure channel while Samarina and Nguyen (2019) refer to it as the financial distributive channel. The hike in asset prices associated with monetary easing leads to increases in the wealth of rich households who usually own the bulk of financial assets as their earnings from capital gains and dividends rise while the wealth of poorer households may even shrink due to declining wages, low interest on savings and possible unemployment. Increases in asset prices resulting from the effects of quantitative easing lead to increasing economic inequality in Japan (Saiki and Frost, 2014), the U.S. (Montecino and Epstein, 2015) and the U.K. (Mumtaz and Theophilopoulou, 2017). However, in the Euro area, Lenza and Slacalek (2018) report that the ECB's asset purchases have accounted for some reduction in the net wealth inequality although negligible. They explain that housing wealth is quite homogeneously distributed, and QE has equalising effects by positively impacting housing
12 Monetary restrictions slow down inflation. However, the slowdown in nominal wages lags the
reduction in inflation due to the presence of nominal rigidities in nominal wages.
13 Galli and von der Hoeven (2001) implement their empirical analysis for a sample of 15 OECD
wealth which is a component of the net wealth. In their investigation of Korea, Kang et al. (2013) find no significant impact of real interest rate on inequality.
The distributional consequences of monetary policies have been established and different transmission channels of monetary actions have been explored in various domains. Certainly, the total net distributional effects of central bank activities cannot be determined a priori. This paper assesses the entirety of the distributional impacts of monetary transmission channels.
II. Data and Methodology
Data
Measuring inequality remains a daunting task in the research of the distributional consequences of monetary policy. Household survey data has been utilised to construct inequality measures (for example (Coibion et al., 2017; Mumtaz and Theophilopoulou, 2017; Guerello, 2018). In some other studies, annual inequality measures from national or international sources have been used (for instance Furceri, Loungani and Zdzienicka, 2018; Samarina and Nguyen, 2019). Data on income inequality are proxied by the Gini coefficient and are sourced from the Standardized World Income Inequality Database (SWIID 8.2)14. The SWIID standardises data from several
sources (the Luxembourg Income Study, Eurostat, World Bank, the OECD Income Distribution Database and United Nations University’s World Income Inequality Database) and consists of measures of market (pre-tax, pre-transfers) and net (post-tax, post-transfers) income inequality (Furceri, Loungani and Zdzienicka, 2018). According to De Haan and Sturm 2017, (cited in Samarina and Nguyen, 2019) the SWIID standardises income and allows for cross country comparison and represents the most comprehensive database on inequality. Theoretically, Gini coefficients are bounded between 0 (perfect equality) and 100 (perfect inequality). Relative to inequality measures based on household surveys, the Gini has the advantage of representing the entire income distribution (Ruiz and Woloszko, cited in Samarina and Nguyen, 2019). As an alternative measure of inequality, we use the top income share (Top 10 percent) from the World Inequality Database15.
The inequality data is complemented by macroeconomic, financial and monetary policy data. Macroeconomic and financial data such as real GDP, the unemployment rate, inflation based on the Consumer Price Index (CPI), the real effective exchange rate and stock market prices measured by the stock market indices. We proxy wages using compensation of employees. Lastly, we include measures of monetary policy stance. We employ monetary policy rate and broad money to capture conventional and unconventional monetary measures respectively. Table
14 The SWIID has been criticised for its use of several distinct sources and its resort to
multiple-imputation methods to fill in missing values (Samarina and Nguyen, 2019). The reliability of the imputed data becomes a matter of concern especially for countries with fewer actual observations (Solt, 2016). Galbraith et al., (2016) emphasise that notwithstanding this drawback, the SWIID reflects largely the actual surveys on which it is based.
15 See
A.1 in Appendix presents the details on data construction and sources. Our sample for the combined inequality, financial and macroeconomic data spans the period from 1990Q1 to 2016Q4 and includes fifteen (15) Sub Saharan African countries. Data availability informed the choice of countries and time periods. The choice of the study period is partly informed by the considerations of monetary policy developments in SSA. Our original sample included all countries in SSA (about 46 countries), but countries with insufficient data are excluded.
Historical trends in income inequality
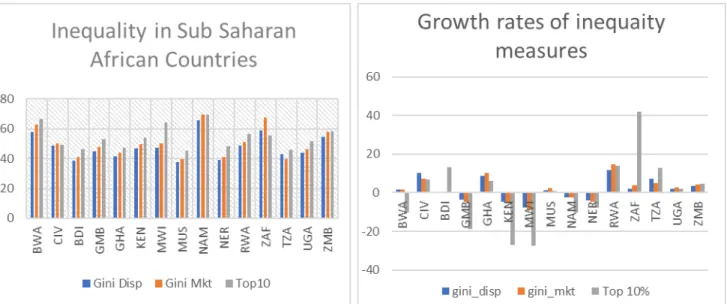
The time path of the inequality measures (illustrated in Figure 2.1) shows that redistribution (inferred as the difference between market Gini and net Gini) decreases income inequality but does not affect trends. As observed in many jurisdictions16, there is substantial heterogeneity in
the inequality levels across the countries in Sub Sharan Africa. Inequality levels in SSA countries are considerably high with all the countries sampled recording mean Gini coefficients above the mean of 0.3917 recorded in other developing countries. The least unequal countries are
Mauritius, Burundi, and Niger while the largest income disparities are posted in Botswana, South Africa and Namibia. In terms of growth, Figure 2.2 shows significant differences in the changes in income inequality in SSA countries over the sample period. Ten countries recorded positive growths in inequality over the sample period. Despite posting high levels of inequality, Namibia recorded declining gap between the rich and the poor. Inequality measures decreased over 1990-2016 also in Kenya, Niger, Malawi and Gambia. The stylised facts on inequality shows that in most countries (nine out of the fifteen sampled), over half of the total income rests in the hands of the top 10 percent of the income distribution. Over the period 1990-2016, inequality as measured by the top 10 percent of the income share witnessed considerably changes with South Africa recording significant hikes in the income share concentrated among the households at the top 10 percent of the distribution.
Historical trends in monetary policy stance and macroeconomic variables
Broad money generally grew at a positive rate over the sample period (Figure 2.3). Monetary policy rates however assumed a downward trend until about 2013 and thereafter surged upwards (Figure 2.4). The monetary tightening might have been occasioned by inflationary pressures and worries of currency depreciation from the anticipated normalization of monetary policy by the United States as the global economy regained its footing following the slowdown in economic activities after the 2007 financial crises. Generally, the period 1990-2016 witnessed expansive monetary policy in SSA. SSA countries recorded large broad money growth, averaging 18.90 percent within the period. Ghana, Malawi and Zambia posted the highest growth in broad money with an average of 30 percent and more. Unsurprisingly, these countries recorded the highest rates of inflation within the period 1990-2016.
16 see Guerello (2018), Furceri, Loungani and Zdzienicka (2018) and Samarina and Nguyen (2019) 17 See Bhorat (2015)
Figure 2.1: Evolution of inequality in SSA
Figure 2.2: Inequality in SSA. Notes: The graphs illustrate mean values and growth rates (in percentages) of inequality measures for the period 1990-2016.
Figure 2.3: Time path of monetary policy instrument
Figure 2.4: Monetary policy rates and average rates of real GDP growth, broad money growth, inflation and unemployment in SSA
Real GDP growth and inflation averaged 4.16 percent and 10.15 percent in SSA countries over the sample period. Ghana, Uganda, Rwanda and Tanzania recorded an average real GDP growth rates of more than 5 percent within 1990-2016 while the lowest growth rate was recorded in
Burundi. On the average, inflation is lowest in Côte d'Ivoire and Niger. Coincidentally, both countries are members of the CFA franc zone with their currency pegged to the euro. South Africa’s average unemployment rate of 27.98 percent was the highest within the sub region, followed by Namibia (20.72 percent) and Botswana (18.56 percent). Notwithstanding, the modest growth rates witnessed in SSA countries, unemployment experienced infinitesimal reductions and increased in some countries including Ghana, Uganda, Rwanda, Namibia, Kenya and Botswana (Figure 2.4).
We can infer from these stylised facts that growth in most SSA countries may be resource-driven and has not produced significant jobs and a commensurate reduction in inequality. In these countries, substantial social distress among the significant number of the populace persists and social welfare indicators remain miniscule compared to the recognizable economic growth. The increase in the nations’ income is most likely accounted for by the rise of private income and wealth. Economic and financial resources are controlled by the top of the distribution who are the chief beneficiaries from the returns and rents accruing from these resources. Thus, we can deduce that expansionary monetary policy in SSA countries may benefit the top of the income ladder by boosting economic activities, asset prices and returns while the bottom of the distribution may benefit from the possible reduction in unemployment. On the other hand, potential inflation may be hurtful to the bottom of the distribution as the purchasing power of their non-indexed nominal fixed incomes are eroded.
Methodology
Dealing with mixed frequency data
Time series analysis in the literature has often grappled with the matter of longer estimation period since relatively short estimation samples often elicit concerns about the estimation results. Variables have often been interpolated from low-frequency to high-frequency series to among others deal with the issues of mixed frequency data and in the context of monetary policy shocks, issues of contemporaneous identification. The data for this study is of a mixed frequency: while some macroeconomic, monetary and financial variables are quarterly series, the inequality measures and some other macroeconomic and monetary indicators are sampled annually. Econometric models in recent times have considered the information in unequal frequencies in the attempt to eschew loss of information stemming from aggregation to the lower frequency. The approach has largely been termed as mixed-frequency methods (Ankargren and Jonéus, 2019). Multiple approaches have been professed18: the mixed-frequency vector autoregressive
(MF-VAR) model (Eraker et al., 2015), factor models (Mariano and Murasawa, 2010; Marcellino, Porqueddu and Venditti, 2016), and the MIxed DAta Sampling (MIDAS) and MIDAS-VAR models proposed by Ghysels, Sinko and Valkanov (2007) and Ghysels (2016)
respectively. Ankargren and Jonéus (2019) employ the method to cast the mixed-frequency model in a state-space form to essentially interpolate the latent values and this is the approach adopted in this paper.
First, we follow the notations of Samarina and Nguyen (2019) and define the country-level VAR process as follows:
where is a matrix of endogenous variables, ; is a matrix of observed quarterly data while represents unobserved quarterly data. is a vector of annual observations treated as quarterly series with missing observations; its values are observed every fourth quarter of a year ( = 4, 8, 12, …, ), to which the annual value is assigned and values are missing in the remaining three quarters of a year ( = 1, 2, 3, 5, 6, 7, …, ). The model evolves as a VAR (1) process with all the variables included in log levels. This process is entirely targeted at estimating missing values and not to identify monetary policy shocks. The idea is to express a dynamic system in a state-space representation that essentially helps to interpolate missing observations.
A state-space representation of the VAR model specified in equation (1) is as follows:
The Kalman filter’s smoothing algorithm provides formulas for backward prediction and thereby updating all earlier predictions based on the information from the total observed series. We run the Kalman filter for each country and interpolate the latent quarterly series of the annual variables.
Distributional consequences of monetary policy
Baseline model: PVAR
It is a conventional practice in the existing literature to employ impulse response analysis to investigate the effects of monetary policy. The effects of monetary policy shock are investigated through an impulse response analysis once the structural model has been identified and estimated. Lütkepohl, Krätzig and Phillips (2004) emphasise that relative to the structural parameters, the impulse response analysis produces more informative results. Our econometric approach entails estimating a PVAR model for 15 SSA countries. The starting point of the analysis is a reduced form panel vector autoregressive (PVAR) model with a constant as deterministic term specified as follows:
Here, i (= 1, ..., N) refers to the country, t (= 1, ..., T) refers to the time period and is the lag length. is a vector of endogenous variables including real GDP, inflation, monetary policy stance, unemployment, equity index, real wages and income inequality: the vector of time series
variables is . is a
coefficient matrix and is the disturbance term with variance – covariance matrix .
Using the reduced form PVAR, we follow Uhlig (2005) and impose restrictions on the sign of structural impulse responses on impact in the impulse response analysis. The key step in applying VAR methodology to the question of the impacts of monetary policy is identifying the innovations to monetary policy. Rather than appealing to certain informational orderings about the arrival of shocks, Uhlig's (2005) sign restricted VAR identify structural shocks by relying on the guidance of economic theory on the sign of structural impulse responses on impact. In this paper, we are mainly interested in the impacts of monetary policy shocks on income inequality and find the sign restricted VAR appropriate. Our choice of the sign restricted VAR is also guided by the contention of Rotemberg 1994 and Cochrane 1994 (cited in Uhlig, 2005) that “a VAR analysis of these shocks only has a chance to be convincing, if the results look plausible to begin with” - intimating the aptness of the reliance of sign restricted VAR on economic theory. On competing identifying assumptions, Christiano, Eichenbaum and Evans (1999) argue that if an impulse response function is incongruent with some given set of (monetary / economic) theories, the corresponding policy shock measures and/or identifying assumptions should be discarded.
As a complement to the existing literature, it is desirable to make the a priori theorizing explicit while at the same time leaving the question of interest open (Uhlig, 2005). In furtherance of this, we directly impose sign restrictions on the impulse responses of inflation and output on impact to identify the effects of monetary policy shocks on income inequality. More specifically, we assume that for a certain period subsequent to a shock, an expansionary monetary policy shock does not lead to decreases in output and inflation. These assumptions are tacitly employed in the VAR literature and enjoy popular support in the monetary policy literature (see Rubio-Ramírez, Waggoner and Zha, 2010; Mumtaz and Theophilopoulou, 2017; Samarina and Nguyen, 2019). The sign restricted PVAR consistent with Uhlig (2005) is based on Bayesian methods of inference and we proceed with the penalty function approach as the VAR impulse response algorithm. The lag length criteria select a smaller lag length (p = 2) and all the endogenous
variables are included in levels19. Using 6 or 4 lags (
p = 6 / p = 4) makes no difference to the results.
Panel regression
In addition to the baseline impulse response analysis, we estimate the impact of monetary policy shocks on income inequality in a dynamic panel model. We specify the following equation to perform our tests:
where y is income inequality; represent exogenous monetary policy shocks20; are
unobserved country-specific characteristics and account for cross country heterogeneities and is the idiosyncratic term and represents the remaining disturbances. represents a set of controls including lagged income inequality and monetary policy shocks. Mindful of possible estimations biases, we estimate the model in equation (4) using the dynamic panel system GMM technique. Aside the orthogonal deviations technique which maximizes the sample size, the system GMM utilises additional moment conditions and is expected to produce significant reductions in finite sample bias (Blundell and Bond, 2000; Roodman, 2006).
The analysis focuses on the net Gini coefficient. By using the net Gini coefficient, we seek to evaluate the overall response of income inequality to monetary policy shocks including indirect effects emanating from fiscal distributions.
III. Distributional consequences of conventional monetary policy
Following the theoretical findings of Kaplan, Moll and Violante (2018), we analyse the distributional consequences of monetary policy along two broad strands: partial equilibrium effects (direct effects) and general equilibrium effects (indirect effects).
Our measure of standard monetary policy is the monetary policy rate. The data is available for three countries (Ghana, Gambia and South Africa) and the analysis of the distributional consequences of monetary policy with respect to conventional policy involves these three countries.
19Sims, Stock and Watson (1990) show that VAR models in levels produce consistent results and it is
unnecessary in many cases to attempt to transform models to stationary form by cointegration operators or difference. Regardless of non-stationarity, the Bayesian approach delivers the same Gaussian shape since it is entirely based on the likelihood function. Thus, no special considerations for non-stationarity is needed with Bayesian inferences (Sims, Stock and Watson, 1990).
20We apply structural autoregressive (SVAR) approach to identify monetary policy shocks. We follow
the recursive (or triangular) identification scheme suggested by Sims (1980) and impose restrictions on the instantaneous relations between the variables as per the following orderings: real GDP growth, inflation, monetary policy and exchange rate. A lag order of p = 2 is applied in the VAR systems to
Partial equilibrium (direct effects)
The heterogeneous effects of monetary actions on households’ income in the partial equilibrium are manifested through the impact of the nominal and real interest rates on households’ net financial positions and on households’ intertemporal consumption choices. The direct effect of changes in monetary policy is a conspicuous feature in Representative New Keynesian Agent models. In the representative - agent models, the sensitivity of consumption to interest rate is due to intertemporal substitution effect represented in the usual consumption Euler equation; thus, this elasticity is hypothesised to be negative.
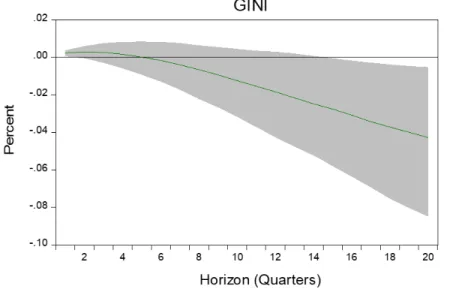
From the substitution effect, interest rate reduction decreases the relative expensiveness of immediate (today’s) consumption. Thus, a reduction in the interest rate would potentially increase general consumption. Auclert (2019) furthers this argument and indicates that through a Fisher channel, monetary policy can increase aggregate consumption via its general equilibrium effect on inflation. Prices increase in response to policy rate cut and in effect decreasing the real rate of interest. Aside the substitution effect, the consumer also experiences an income effect from changes in interest rates. If the agent has positive assets, reductions in interest rates imply lower interest rate income. Therefore, lower policy rates imply reduced interest income from interest bearing assets. Since such assets are usually owned by the high-income individuals, monetary policy induced income effect should reduce income inequality. The heterogeneity in households’ net financial positions partially account for the shifts in inequality after a monetary policy change. Figure 3.1 shows the impulse response of the net Gini coefficient to a one standard deviation negative monetary policy shock.
In the partial equilibrium, a change in the policy rate has a significant effect on income inequality. A one standard deviation negative (conventional) monetary policy shock reduces the net Gini coefficient by about 0.04 percent. The inequality effects of shifts in monetary stance in the partial equilibrium appears to be driven by income effects hypothesis reflecting lower interest rate income. Contrary to Inui, Sudo and Yamada, (2017), this result suggests that households’ net financial positions play a significant role in the distributional effects of monetary policy. The direct effects of monetary policy on income inequality in SSA countries are most likely via the income effects rather than the intertemporal substitution explanations. The contribution of the intertemporal substitution accounts of the direct effects of monetary policy appears to be dimmed as Kaplan, Moll and Violante, (2018) document that considerable proportion of households face high borrowing costs, hold close to zero liquid wealth and are irresponsive to small changes in interest rates. Meanwhile, standard consumption theory suggests that the consumption of rich households is dampened by negative income effects induced by an interest rate cut (Kaplan, Moll and Violante, 2018). The result may suggest that the strong intertemporal substitution effects associated with representative agent models might be debatable. Even if the effect occasioned by the intertemporal substitution is non-negligible, it appears its impact is diminished by an offsetting negative income effect.
Figure 3.1: Response to an expansionary monetary policy shock (partial equilibrium)
Also, the partial equilibrium results may be explained by interest rate changes resulting from monetary policy actions, directly affecting interest payments to savers and that paid by borrowers. Ampudia et al. (2018) indicate that households with net outstanding debt benefit from reduced interest payments while households with net nominal assets are hurt by low interest rates. Thus, policy rate cuts imply reduced inequality since the conventional belief is that the bottom of the distribution are usually net borrowers while the savers are at the top of the income ladder. It is however contentious whether the effect is on the gross incomes of borrowers rather than their wealth (considering assets and liabilities).
The finding of this paper supports the results of Doepke and Schneider (2006) and may suggest that a decline in the policy rate induces wealth transfer between borrowers and lenders. This finding is also consistent with the results of Auclert (2019) who interprets the consumption response in the partial equilibrium as a pure wealth effect.
General equilibrium (indirect effects)
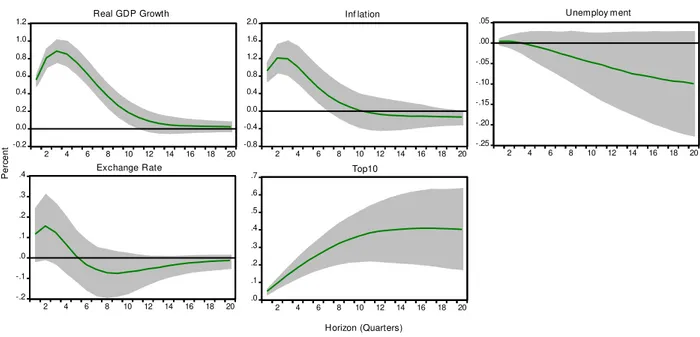
In the general equilibrium, indirect effects on inequality arise from shifts in aggregate demand (and potentially labour demand) and hence in prices, wages, employment and income that originate from the monetary policy action. Heterogeneous consequences from the indirect effects, antecedent by the disparities in earning sources underscore the potential changes in inequality after a monetary action in the general equilibrium. We evaluate the impact of an expansionary monetary policy shock on income inequality in the general equilibrium and the impulse responses are presented in Figure 3.2.
Figure 3.2: Responses to an expansionary monetary policy shock (general equilibrium) 0.0 0.2 0.4 0.6 0.8 1.0 2 4 6 8 10 12 14 16 18 20 Real GDP Growth -0.4 0.0 0.4 0.8 1.2 1.6 2 4 6 8 10 12 14 16 18 20 Inf lation -.20 -.16 -.12 -.08 -.04 .00 .04 2 4 6 8 10 12 14 16 18 20 Unemploy ment -.3 -.2 -.1 .0 .1 .2 .3 .4 2 4 6 8 10 12 14 16 18 20 Exchange Rate .00 .04 .08 .12 .16 .20 2 4 6 8 10 12 14 16 18 20 GINI P e rc e n t Horizon (Quarters)
A one standard deviation negative shock to monetary policy decreases the policy rate by about 80 basis points. This reinforces the observation in the literature regarding large movements in monetary policy in SSA. Comparatively, in reaction to a one standard deviation monetary policy shock, the federal funds rate moved by about 30 basis points (Uhlig, 2005)21 and the Euro area
shadow rate shifted by about 14 basis points (Samarina and Nguyen, 2019). Our sample shows that real GDP growth and inflation increase by 0.8 and 1.1 percent respectively at peak after surprises in conventional monetary policy. Real GDP growth displays a hump-shaped response, peaking after about one year and returning to steady state levels after about three years – in line with the results of Christiano, Eichenbaum, and Evans (2005). Inflation peaks after about three quarters and return to pre-shock levels after about two and half years. Unemployment declines in response to the innovation in monetary policy, consistent with theory and empirical evidence. The response of the real effective exchange rate is however counterintuitive, depicting the exchange rate puzzle - a monetary policy shock that lowers interest rates appreciates rather than depreciates a currency22.
21In recent times, movements in the Federal funds rate have been about 25 basis points
22 Hnatkovska, Lahiri, and Vegh (2016) report the exchange rate puzzle for developing countries when the
policy-controlled interest rate is moved and show that the supposed “fear of floating” syndrome among developing countries does not explain the ‘puzzle’. The features of monetary transmission mechanisms drive the exchange rate response. The exchange rate response may suggest the indirect effects of output and fiscal channels of monetary transmission outweighing the direct effects of liquidity demand channel. The output channel reflects the expansionary effect of interest rates cuts on domestic activity and the fiscal channel reveals a lower fiscal burden of interest rates cuts. The lower fiscal burden may translate into stable macroeconomic environment and together with expansionary effects of the output channel attract interest in domestic economic activity. The liquidity demand channel after changes in monetary policy would alter the demand for domestic currency denominated liquid assets.
Ampudia et al. (2018) document that studies applied to various countries tend to show that expansionary measures with respect to conventional monetary policy, compress the distribution of income. Our study, however, finds results that are contrary but consistent with the evidence for Japan (Inui, Sudo and Yamada, 2017) and for the US and UK (Cloyne, Ferreira and Surico, 2020) that income inequality may be aggravated by expansionary monetary policy. In the wake of innovations in monetary policy, income inequality increases persistently, reaching an increase of about 0.11 percent in five (5) years after the shock. Impliedly, a 100 basis points monetary easing is estimated to increase the net Gini coefficient by 0.14 percent. The persistent distributional effects of monetary policy may suggest generally declining interest rates over long horizon. Persistent falling of the interest rate for a long time implies the absence of interest rate cycle and may account for the persistence in income inequality. Significant persistent effects of monetary policy shock on inequality is also reported for the US (Coibion et al., 2017) and for the UK (Mumtaz and Theophilopoulou, 2017). The work of Christiano, Eichenbaum, and Evans (2005) on the persistence in aggregate quantities suggests that the response of output and consumption to identified monetary policy shocks builds up over time. This persistence may be explained by the redistribution channel of monetary policy.
Figure 3.2 shows that currency appreciation is associated with increasing inequality. This is in line with the results of Feldkircher and Kakamu, (2018) that the inequality gap worsens in the presence of real appreciation of the currency for Japan. The interpretation given is that appreciation of the currency implies loss of competitiveness and may translate into possible job losses and/or wages cuts. This evidence may also be an indication of imperfect substitutability between domestic and foreign assets. An appreciation of the currency may imply the reduction in the relative expensiveness of foreign assets which may allow the top of the distribution to acquire more foreign assets.
The results suggest that the impact of conventional, expansionary monetary policy shock on income inequalities is procyclical. Taking cognisance of the explanations of the earnings heterogeneity channel, this evidence supports the observation that SSA countries are characterised by high concentration of assets and resources, limited employment of labour and the limited distributive capacity of the state. Even though the dis-equalising effects of conventional monetary policy is qualitatively and quantitatively significant, its economic magnitude seems moderate. The variance decompositions show that monetary policy shocks account for less than 5 percent of the variance of income inequality: 3.05 percent of the variance over two (2) years and 3.74 percent over five (5) years. Relative to other jurisdictions, Coibion et al. (2017) report that shocks to monetary policy for the US explain less than 5% of the total variance of earnings inequality and about 10-15% of the variance of income inequality.
Different measures of inequality: We test the validity of our results by first using an alternative measure of inequality, the top 10 income share. The results are not qualitatively different from
the baseline results. The results of the impulse responses in the general equilibrium are presented in Figure 3.3. Expansionary standard monetary action increases inequality. A one standard deviation negative monetary policy shock increases the top 10 share of income by 0.4 percent at peak.
Figure 3.3: Responses expansionary monetary policy shock (Top10)
-0.2 0.0 0.2 0.4 0.6 0.8 1.0 1.2 2 4 6 8 10 12 14 16 18 20 Real GDP Growth -0.8 -0.4 0.0 0.4 0.8 1.2 1.6 2.0 2 4 6 8 10 12 14 16 18 20 Inf lation -.25 -.20 -.15 -.10 -.05 .00 .05 2 4 6 8 10 12 14 16 18 20 Unemploy ment -.2 -.1 .0 .1 .2 .3 .4 2 4 6 8 10 12 14 16 18 20 Exchange Rate .0 .1 .2 .3 .4 .5 .6 .7 2 4 6 8 10 12 14 16 18 20 Top10 P e rc e n t Horizon (Quarters)
We also consider if the results are sensitive to the interpolation of quarterly values from the annual frequencies. We estimate the impulse responses using the annual observations. The impact of monetary policy shock on income inequality is not qualitatively different from the effects obtained from a quarterly model. In response to a one standard deviation negative monetary policy shock, the Gini coefficient rises by about 0.4 percent at the peak (Figure A1).
The role of real wages
The data on wages is available for two countries (Ghana and South Africa). With this sample, we analyse the inequality effects of monetary policy through its impacts on real wages. Figure 3.4 shows the impulse responses to a one standard deviation expansionary monetary policy shock.
Figure 3.4: Responses to expansionary monetary policy shock (real wages) -0.2 0.0 0.2 0.4 0.6 0.8 1.0 2 4 6 8 10 12 14 16 18 20 Real GDP Growth -0.8 -0.4 0.0 0.4 0.8 1.2 2 4 6 8 10 12 14 16 18 20 Inflation -.10 -.08 -.06 -.04 -.02 .00 .02 .04 2 4 6 8 10 12 14 16 18 20 Real Wages -.02 -.01 .00 .01 .02 .03 2 4 6 8 10 12 14 16 18 20 GINI P e rc e n t Horizon (Quarters)
The response of real wages varies in sign relative to theoretical predictions. Real wages decline slightly in response to a negative monetary policy shock. This may suggest that while changes in monetary policy can entail significant nominal wage increases (partially due to the downward nominal wage rigidities), the real effect is likely to be modest due to the significant increase in the price level. Christiano, Eichenbaum and Evans (2005) also observe a weak response in the real wage after a monetary policy shock. Real wages respond weakly to innovations in the policy rate and the effects on inequality are negligible.
The role of financial / portfolio channel
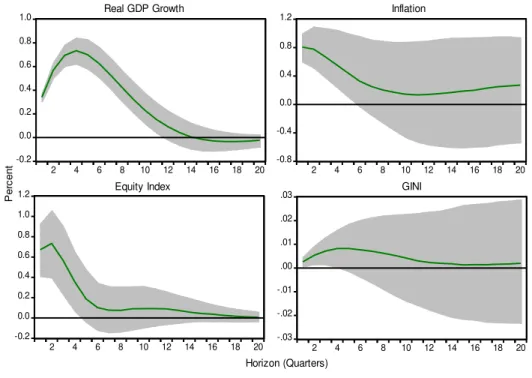
We utilise data for Ghana and South Africa and evaluate the contribution of the financial / portfolio channel in the effects of monetary policy on income inequality. Th results of the impulse responses are shown in Figure 3.5. The response of equity prices is consistent with literature – decreases in short term rates exert positive influences on stock prices. However, the distributional effects of policy rate cuts through their impacts on equity prices have been modest. Rising values of households’ equity portfolios occasioned by policy rate cuts have not been translated into significant changes in income inequality
Figure 3.5: Responses to expansionary monetary policy shock (equity index) -0.2 0.0 0.2 0.4 0.6 0.8 1.0 2 4 6 8 10 12 14 16 18 20 Real GDP Growth -0.8 -0.4 0.0 0.4 0.8 1.2 2 4 6 8 10 12 14 16 18 20 Inflation -0.2 0.0 0.2 0.4 0.6 0.8 1.0 1.2 2 4 6 8 10 12 14 16 18 20 Equity Index -.03 -.02 -.01 .00 .01 .02 .03 2 4 6 8 10 12 14 16 18 20 GINI P e rc e n t Horizon (Quarters)
This response is the sum of four terms, reflecting the direct effects, contributions from the stock market channel and the two macroeconomic aggregates. We exclude the macroeconomic aggregates and assess the propagating contributions of the financial channel to the monetary transmission to income inequality. Figure 3.6 shows the results of the impulse responses.
Figure 3.6: Responses to expansionary monetary policy shock (only financial channel)
-.4 -.2 .0 .2 .4 .6 2 4 6 8 10 12 14 16 18 20 Equity Index -.10 -.08 -.06 -.04 -.02 .00 .02 2 4 6 8 10 12 14 16 18 20 GINI P e rc e n t Horizon (Quarters)
The evidence shows that the most significant effects on the dynamics of income inequality from conventional monetary policies operating through the financial/portfolio channel, might have come through changes in interest income rather than equity returns. This may be an indication of
lower equity holdings comparative to the holdings of fixed income claims in these countries (Ghana and South Africa). This result may suggest that conventional monetary policy has a stronger effect on inequality via short-term assets than with long-term assets. This finding is consistent with the observations of Calza, Monacelli, and Stracca (2013) and Auclert (2019). Auclert (2019) shows that large redistributive effects are associated with changes in real interest rates when all assets are short term. Conventional monetary easing generates less capital gains with shorter asset maturities and given that capital gains accrue mostly to the top of the distribution, the aggregate distributional effect from equity prices is modest.
The role of the fiscal response to a monetary shock
Finally, pursuant to the heterogenous agent models, we estimate the contribution of fiscal reaction to the redistributive effects of monetary policy. Monetary and fiscal policies are intertwined. The contribution of fiscal transfers to redistribution, by contrast, has not received much attention in the context of monetary policy. Evaluating the indirect effects of monetary policy including the fiscal reaction is important for understanding the totality of monetary transmission. Indeed, Auclert (2019) evaluates the redistribution channel of monetary policy and concludes that redistribution amplifies the transmission mechanism of monetary policy.
In the general equilibrium, the distributional implications of monetary policy are also shaped by fiscal policy since government debt, public transfers and the amount of taxes are shaped by the changes in the future path of interest rates (Ampudia et al., 2018). The consequences of monetary induced redistributive effects between households and the government depend crucially on the fiscal rule. Auclert (2019) for example assumes that the government runs a tax-and-transfer system and has nominal short-term debt. Lower interest rates arising from monetary actions lessens the cost of amortising government debt and provide room for increased fiscal transfers or/and tax reductions. The reaction of fiscal policy to variations in monetary policy would contribute to the distributional effects of monetary policy since there are distributional implications associated with the applications of the increased transfers and the tax cut across the population.
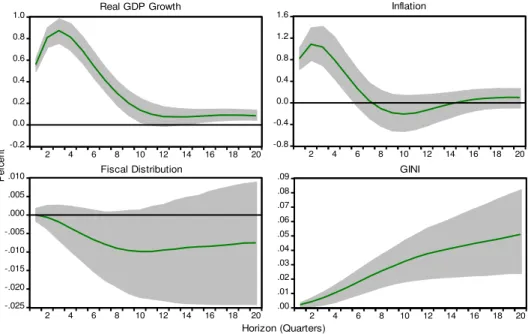
The distributional effects from the interaction between monetary and fiscal policy explored in this study involves further fiscal space that are translated into improved transfer and social distributions. Following the literature on fiscal policy, we proxy fiscal transfers by the difference between the market Gini and the net Gini coefficients. If the distributional policies are progressive in nature, the bottom of the income distribution tends out to be the biggest beneficiaries of social interventions, pro-poor policies and subsidies. Thus, improved fiscal distributions occasioned by monetary actions should decrease inequality. We present the results of the impulses responses to a one standard deviation expansionary monetary policy in Figure 3.7. The evidence supports the findings of Furceri, Loungani and Zdzienicka (2018) and shows the importance of fiscal response and redistribution policies to the propagation of monetary policy shocks to income dispersion.
Fiscal transfers decline after a conventional, accommodative monetary policy shock. This implies that cuts in monetary policy-controlled interest rate reduces government’s distributive capacity. Lower interest rates compel investors in search of yield to reshuffle their portfolio away from government’s debt; thus, limiting government’s fiscal ability particularly in the presence of inadequate tax revenue. The response of fiscal transfers may be in line with the findings of Coibion et al. 2012 (cited in Inui, Sudo and Yamada, 2017) that a contractionary monetary policy shock leads to a larger government transfer. The fall in fiscal transfers coincides with increases in income inequality as the bottom of the distribution are usually the greatest beneficiaries of government transfers.
Figure 4.9: Responses to expansionary monetary policy shock (fiscal response)
-0.2 0.0 0.2 0.4 0.6 0.8 1.0 2 4 6 8 10 12 14 16 18 20 Real GDP Growth -0.8 -0.4 0.0 0.4 0.8 1.2 1.6 2 4 6 8 10 12 14 16 18 20 Inflation -.025 -.020 -.015 -.010 -.005 .000 .005 .010 2 4 6 8 10 12 14 16 18 20 Fiscal Distribution .00 .01 .02 .03 .04 .05 .06 .07 .08 .09 2 4 6 8 10 12 14 16 18 20 GINI P e rc e n t Horizon (Quarters) Panel regression
We test the robustness of our baseline results further by estimating equation (4). A well-established difficulty in the monetary transmission literature is to disentangle the monetary policy effects from the impacts emanating from exogenous cyclical fluctuations to which monetary policy reacts. The established solution is to evaluate the impact of monetary policy shocks - unanticipated changes in monetary policy stance that are independent of the reaction to ongoing economic developments. Thus, the dynamic panel regression analysis utilises the identified monetary policy shocks in estimating the impact of monetary policy on income inequality. We utilise the shocks identified from the SVAR in the estimation to verify if our baseline results are sensitive to different identification of monetary policy shocks23. We 23 We also estimate the model using the shocks identified with sign restrictions and the results are not
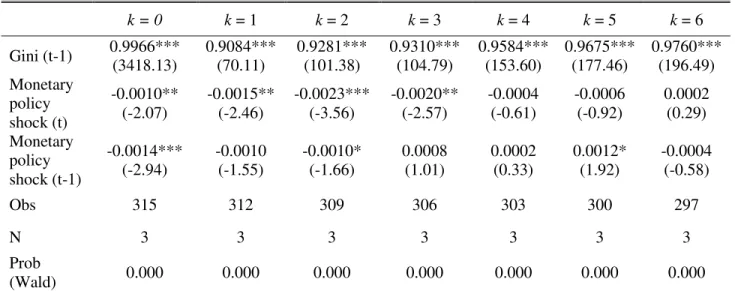
standardise the monetary policy shocks to have zero mean and variance equal to one to enable us to interpret the response of the Gini coefficient as the response to a one standard deviation change in monetary policy shock. The results presented in Table 3.1 (column two) do not alter our conclusions from the PVAR analysis. Monetary policy shock decreases with income inequality - conventional, accommodative monetary policy shock increases income inequality. The results from our baseline analysis show that orthogonal innovations in monetary policy leads to persistent rise in income inequality. We consider further the extent to which surprises in monetary policy explain the change in the Gini coefficient given its usually limited variation. In furtherance of this, we evaluate the impact of monetary policy innovations on the changes in income inequality by estimating the following version of equation (4) for each k period.
Equation (5) is estimated for six (6) quarters (k = 1, …, 6), that is one and half years after the shock. The results obtained from estimating equation (5) are presented in Table 3.1 [columns three (3) to eight (8)].
Table 3.1: Effect of conventional monetary policy shocks on income inequality24
k = 0 k = 1 k = 2 k = 3 k = 4 k = 5 k = 6 Gini (t-1) 0.9966*** (3418.13) 0.9084*** (70.11) 0.9281*** (101.38) 0.9310*** (104.79) 0.9584*** (153.60) 0.9675*** (177.46) 0.9760*** (196.49) Monetary policy shock (t) -0.0010** (-2.07) -0.0015** (-2.46) -0.0023*** (-3.56) -0.0020** (-2.57) -0.0004 (-0.61) -0.0006 (-0.92) 0.0002 (0.29) Monetary policy shock (t-1) -0.0014*** (-2.94) -0.0010 (-1.55) -0.0010* (-1.66) 0.0008 (1.01) 0.0002 (0.33) 0.0012* (1.92) -0.0004 (-0.58) Obs 315 312 309 306 303 300 297 N 3 3 3 3 3 3 3 Prob (Wald) 0.000 0.000 0.000 0.000 0.000 0.000 0.000 Note: z-statistics in parenthesis, ***, ** and * denote significance at 1%, 5% and 10% respectively
Table 3.1 shows that the estimated effects are significant and explain the change in the Gini coefficient up to three (3) quarters. The results largely buttress the persistent increase in income inequality after expansionary conventional monetary policy shock. Surprises in monetary action in the previous period increase income inequality in the current period and significantly explain the change in inequality over the first two quarters after the shock. Income inequality show
considerable degree of persistence as indicated by the statistically significant positive AR(1) terms in all regressions.
Type of monetary policy shocks
Are the distributional effects of monetary policy symmetric? Does the direction of monetary policy shock matter in its impact on inequality? Furceri, Loungani and Zdzienicka (2018) report asymmetry in the monetary policy transmission to inequality. A strand of the literature on monetary policy transmission (for example Matthes and Barnichon, 2015) contends that contractionary monetary policy impacts on the economy more than an expansionary monetary policy action. The empirical evidence on the inequality effects of monetary policy suggests asymmetry effects. We follow Furceri, Loungani and Zdzienicka (2018) and examine this hypothesis by estimating the following equation:
where D is a dummy corresponding to one for positive monetary policy shocks and zero otherwise. The evidence (Table 3.2) indicates asymmetry in the inequality effects of monetary policy. The distributional consequence of monetary action is dependent on the direction of monetary policy shock. Unanticipated conventional monetary restriction decreases income inequality while unexpected conventional accommodative monetary policy heightens the income gap. In terms of magnitude, it appears increases in monetary policy-controlled interest rates impact the income gap more than decreases in the policy rate.
Table 3.2: Effect of monetary policy shocks on income inequality Positive versus negative monetary policy shock
Gini (t-1) 0.9962*** (3270.25)
Positive monetary policy shock (t) -0.0038*** (-4.56) Negative monetary policy shock (t) 0.0022** (2.52)
Test of difference 18.93***
Positive monetary policy shock (t-1) -0.0038*** (-4.42) Negative monetary policy shock (t-1) 0.0009 (1.05)
Test of difference 11.09***
Obs 315
N 3
Prob (Wald) 0.000
Note: z-statistics in parenthesis, *** and ** denote significance at 1% and 5% respectively Controls included but not reported.
Country heterogeneity
The panel estimates are average responses across the countries. We engage single country analysis of the impulse responses to surprises in conventional monetary policy to explore country heterogeneities. Aside the sign restricted VAR, we utilise linear local projections à la Jordà (2005) to produce impulse response to monetary policy shock. The local projections are “restrictions free”, robust to lag length specifications and are free from the challenge of specifying an unknown multivariate dynamic system.
Income dispersion reacts to monetary shocks for all the countries with a degree of heterogeneity, qualitatively and quantitatively. Inequality increases in South Africa and Ghana after a negative monetary policy shock. Gambia on the other experiences a decline in the income gap after expansionary monetary policy shock. Coincidentally, Gambia has recorded a downward trend in the Gini coefficient while the Gini coefficient assumes an increasing trend in both South Africa and Ghana. This may suggest the importance of monetary policy in explaining income dispersion in these countries.
The local projections indicate the incidence of the output puzzle in Gambia – the real GDP growth declines after a policy rate cut. Impulse response from the local projections show that in all the three countries, inflation declines first before rising after the monetary policy shock. This however should be considered cautiously particularly as transient monetary shock may not be correctly identified. The first reaction of inflation may reflect a hitherto disinflationary process. The initial reaction of inflation may also indicate the tardy response of prices to changes in the monetary policy-controlled interest rate. One possible explanation is the cost channel, which is reflected in the initial lower prices after policy rate cut. Also, Castelnuovo and Surico (2010) argue that the seeming price puzzle may be associated with a weak interest rate response to inflation.
There is also an obvious heterogeneity across the countries in the reactions in the labour markets after a shock to the policy rate. The unemployment rates drop in Ghana and Gambia but rise in South Africa.
IV The inequality effects of unconventional monetary policy
Ampudia et al. (2018) emphasise that the aggregate and distributional effects of unconventional monetary actions are less well understood in comparison to standard monetary policy. While the channels of transmission should remain unchanged, their relative strength may vary. Therefore, we examine also, the distributional consequences of non-standard monetary policy actions in SSA countries. Following Saiki and Frost (2014) we proxy unconventional policy using growth in the monetary aggregates25. The empirical analysis is implemented for 15 countries.
25Saiki and Frost (2014) find that using monetary base and central bank assets as measures of monetary