THE BUSINESS SCHOOL FOR FINANCIAL MARKETS
The University of Reading
An Excursion into the
Statistical Properties of Hedge Funds
ISMA Discussion Papers in Finance 2002-12This version: 1 May 2002
Harry M. Kat Associate Professor in Finance, ISMA Centre, University of Reading, UK
and Sa Lu PhD Student,
ISMA Centre, University of Reading, UK,
Copyright 2002 Kat and Lu. All rights reserved.
The University of Reading • ISMA Centre •Whiteknights •PO Box 242 • Reading RG6 6BA • UK
Tel: +44 (0)118 931 8239 • Fax: +44 (0)118 931 4741
Email: [email protected] • Web: www.ismacentre.rdg.ac.uk
Director: Professor Brian Scott-Quinn, ISMA Chair in Investment Banking The ISMA Centre is supported by the International Securities Market Association
This discussion paper is a preliminary version designed to generate ideas and constructive comment. The contents of the paper are presented to the reader in good faith, and neither the author, the ISMA Centre, nor the University, will be held responsible for any losses, financial or otherwise, resulting from actions taken on the basis of its content. Any persons reading the paper are deemed to have accepted this.
Abstract
This paper provides an overview of the most important statistical properties of individual
hedge fund returns. We find that the net-of-fees monthly returns of the average
individual hedge fund exhibit significant degrees of negative skewness, excess kurtosis,
as well as positive first-order serial correlation. The correlations between hedge funds in
the same strategy group are of the same order of magnitude as the correlations between
funds in different strategy groups and relatively low. Only 10-20% of the variation in the
average individual hedge fund’s returns can be explained by what happens in the US
equity and bond markets. Compared to individual funds, portfolios of hedge funds tend
to exhibit lower skewness, higher serial correlation and higher correlation with stocks
and bonds. Movements in the US equity and bond markets still only explain 20-40% of
the variation in hedge fund portfolios returns though. Finally, an equally-weighted
portfolio of all funds in our sample offers a 2.76% higher mean return than the average
fund of funds. This strongly suggests that the timing and fund picking activities of the
average fund of funds are not rewarded by a higher return.
Contacting Author:
Harry M. Kat
ISMA Centre
The University of Reading
Whiteknights Park
Reading RG6 6BA
United Kingdom
Tel. +44-118-9316428
E-mail: [email protected]
The authors like to thank Hans de Ruiter and ABP Investments for generous support and
Tremont TASS (Europe) Limited for supplying the hedge fund data.
1. I
NTRODUCTION
The first hedge fund is typically attributed to Albert W. Jones, who in 1949 started a fund that simultaneously took long and short positions in equity. Jones’ fund did not inspire many imitators until in 1966 an article in Fortune described Jones’ fund to have returns substantially higher than the best performing mutual funds. This led to increased interest in hedge funds and many were formed in the two years that followed. After rapid expansion in 1967–1968, the hedge fund industry experienced a substantial setback during the bear markets of 1969–1970 and 1973–74, when many funds suffered losses and capital withdrawals. Hedge funds faded back into obscurity until 1986, when an article in Institutional Investor reported that during the first six years of its existence Julian Robertson’s Tiger Fund had offered an annual return of 43%. This lead to renewed interest and the formation of many new hedge funds. It is estimated that currently there are around 6000 hedge funds managing around $500 billion in capital, with approximately $1 trillion in total assets. Traditionally, high net worth individuals and university endowments have been the largest investors in hedge funds. It is well known for example that Harvard, Princeton and Yale have substantial allocations to hedge funds. Lately, interest from other institutional investors has picked up as well though. Two of the largest pension funds in the world, CalPERS and ABP, recently announced plans to invest as much as $1 billion each in hedge funds. It is believed that this vote of confidence, together with low interest rates, declining equity markets and relentless marketing pressure will give the industry a further strong growth impetus.
With the industry still in its infancy and hedge funds, most of them being structured as private partnerships, under no legal obligation to disclose their results, gaining insight in the performance characteristics of hedge funds is not straightforward. Fortunately, many funds release performance as well as other administrative information to attract new and to accommodate existing investors. These data are collected by a number of data vendors and fund advisors, some of which make their data available to qualifying investors.1 Subscribing to these databases can be quite expensive. Many investors therefore choose to work with the monthly performance
indices that are calculated from these databases and which are freely available on the internet. As shown in Amin and Kat (2002), if one intends to hold a well-diversified portfolio of hedge funds, these index returns make a reasonable proxy for the actual portfolio return one can expect to make.
Although from an investor’s perspective it may make more sense to study hedge fund indices than individual hedge funds, this does not mean that individual hedge fund returns are not worth looking at. In this paper we therefore study the monthly net of fee returns on 376 individual hedge funds and 103 funds of hedge funds over the period June 1994 – May 2001. For every fund’s return we calculate the mean, standard deviation, skewness, kurtosis, correlation with stocks and bonds and several other statistics. Subsequently, we classify all funds into a number of strategy groups to see what investors can realistically expect from hedge funds executing these particular strategies. We also calculate the returns on equally-weighted portfolios of all funds in each group. This allows us to investigate whether there are significant differences in return behaviour between the average individual fund and the population average, i.e. the index.
2. S
TRATEGY
C
LASSIFICATION AND
D
ATA
Hedge fund investment strategies tend to be quite different from the strategies followed by traditional money managers. In principle every fund follows its own proprietary strategy, which means that hedge funds are a very heterogeneous group. It is, however, customary to ask hedge funds to classify themselves into one of a number of different strategy groups depending on the main type of strategy followed. In this paper we concentrate on the following 7 main classes of funds. The numbers in between brackets indicate the estimated market share of each strategy group in terms of assets under management as of September 2001 (see TASS (2001)):
Long/Short Equity (45%): Funds that invest on both the long and the short side of the equity market. Unlike equity market neutral funds (see below), the portfolio may not always have zero market risk. Most funds have a long bias.
Equity Market Neutral (7%): Funds that simultaneously take long and short positions of the same size within the same market, i.e. portfolios are designed to have zero market risk. Leverage is often applied to enhance returns.
Convertible Arbitrage (8%): Funds that buy undervalued convertible securities, while hedging (most of) the intrinsic risks.
Distressed Securities (12%): Funds that trade the securities of companies in reorganization and/or bankruptcy, ranging from senior secured debt to common stock.
Merger Arbitrage (10%): Funds that trade the securities of companies involved in a merger or acquisition, buying the stocks of the company being acquired while shorting the stocks of its acquirer.
Global Macro (8%): Funds that aim to profit from major economic trends and events in the global economy, typically large currency and interest rate shifts. These funds make extensive use of leverage and derivatives. These are the funds that are responsible for most media attention.
Emerging Markets (4%): Funds that focus on emerging and less mature markets. These funds tend to be long only because in many emerging markets short selling is not permitted and futures and options are not available.
A separate class of funds is formed by so-called funds of funds. These are funds that invest in other hedge funds. Some limit themselves to one specific type of hedge fund but most invest across the board. The idea behind funds of funds is to offer investors a hassle-free alternative to constructing a basket of hedge funds themselves. In addition, many claim to be able to add value by employing experienced managers to select funds, carry out due diligence and continuously monitor the portfolio. As we will see later, however, the average funds of funds is unable to add enough value to make up for the fees charged.
The data used in this study were obtained from Tremont TASS, which is one of the best known and largest hedge fund databases currently available. As of May 2001,
the database at our disposal contained monthly net of fee returns on a total of 2183 hedge funds and funds of funds. Reflecting the tremendous growth of the industry as well as the high attrition rate, only 264 of these funds had 7 or more years of data available. As shown in Amin and Kat (2001), concentrating on surviving funds only will on average overestimate the mean return on individual funds by around 2% as well as introduce significant biases in estimates of the standard deviation, skewness and kurtosis. To avoid this problem we decided not to work with the raw return series of the 264 survivor funds but instead to create 376 7-year monthly return series by, starting off with the 376 funds that were alive in June 1994, replacing every fund that closed down during the sample period by a fund randomly selected from the set of funds alive at the time of closure following the same type of strategy and of similar size and age. Funds of funds (103 funds as of June 1994) are treated in exactly the same way. For simplicity, we will still refer to the data series thus obtained as ‘hedge fund returns’.
Note that with the above procedure we implicitly assume that in case of fund closure investors are able to roll from one fund into the other at the reported end-of-month net asset values and at zero additional costs. This will underestimate the true costs of fund closure to the investor for two reasons. First, when a fund closes shop its investors will have to look for a replacement. This search takes time and is not without costs. Second, investors may get out of the old and into the new fund at values that are less favourable than the end-of-month net asset values contained in the database. Unfortunately, it is impossible to incorporate this into the analysis without detailed further information.
3. U
NIVARIATE
S
TATISTICS
Table 1 shows the average mean, standard deviation, skewness, kurtosis, and 1-4 month autocorrelation coefficients for individual hedge funds in each of the 7 different strategy groups as well as funds of funds. For comparison, the table also provides the same information for the S&P 500 and the Salomon Brothers 7-Year Government Bond index. From table 1 we first of all see that different strategy
groups exhibit distinctly different return characteristics, which confirms that the (self-) classification used has significant discriminatory power. It is also clear that the risk profile of the average hedge fund cannot be accurately described by standard deviation alone. All strategy groups exhibit a significant degree of skewness and/or excess kurtosis, with all except global macro funds exhibiting negative skewness. It is also interesting to see that there is a tendency for low standard deviations to go together with relatively low skewness and high kurtosis. Assuming that investors like the former but dislike the latter, this means that the average hedge fund does not provide investors with a free lunch. Merger arbitrage, distressed securities, convertible arbitrage and emerging market funds exhibit relatively high positive first-order serial correlation. As discussed in Brooks and Kat (2001) for example, this is most likely caused by marking-to-market problems and, as we will see in section 6, will cause investors to underestimate the true standard deviations of these types of funds.
<< Insert Table 1 and 2 >>
To learn more about the diversification effects that arise when combining individual hedge funds into baskets, we calculated the same statistics for 8 different equally-weighted portfolios. The first 7 portfolios contain all funds within a certain strategy class, while the 8th portfolio contains all 376 funds in the sample.2 The results can be
found in table 2. From the third column of table 2 we see that forming baskets leads to a very substantial reduction in standard deviation. With the exception of emerging market funds, the portfolio standard deviations are approximately half the standard deviations of the average individual fund. This signals that, as we will see later, the degree of correlation between funds in the same strategy group must be quite low. Compared to the other portfolios, the all-funds portfolio has a surprisingly low standard deviation, which suggests that the correlation between funds in different strategy groups is quite low as well. We will return to this in section 5.
From the skewness column we see that, contrary to standard deviation, skewness is not diversified away and actually increases as portfolios are formed. With the
exception of equity market neutral funds, the portfolio skewness figures are lower than for the average individual fund, with especially merger arbitrage and distressed securities funds standing out. It appears that when things go bad for one fund, they tend to go bad for other funds in the same sector as well. With the exception of merger arbitrage and distressed securities funds, the portfolios do exhibit less kurtosis than the average individual fund. Portfolio serial correlation is (much) higher than for individual hedge funds, suggesting that just the act of forming portfolios adds serial correlation. The equity market neutral portfolio for example exhibits substantial autocorrelation while the average equity market neutral fund shows none. The reason behind this phenomenon is not clear.
Comparing the fund of funds results in table 1 with the all-funds results in table 2 we see that the all-funds portfolio has a mean that is 0.23% (2.76% per annum) higher than that of the average fund of funds. Since this is more or less equal to the total fee charged by funds of funds, this implies that in terms of return on investment the average fund of funds adds significant negative value. The all-funds portfolio also has a standard deviation that is 1.12% lower than that of the average fund of funds. There are several possible explanations for this. First, some funds or funds may simply be too small to diversify properly. As shown by Amin and Kat (2002), it takes 20 funds or more to fully realize the diversification potential in hedge funds. Second, some funds of funds may be following some sort of tactical allocation strategy where they attempt to predict what types of strategies will be most successful over the next 6-12 months and allocate accordingly. This will leave them under-diversified and can be expected to raise volatility. Third, funds of funds may deliberately be keeping the number of funds down based on the idea that there are only a small number of good funds in the world and that expanding outside of that group will damage the overall quality of the portfolio. Again, this will leave them under-diversified and add to volatility. The average fund of funds exhibits less negative skewness than the all-funds portfolio. This could be attributed to careful fund selection, but it could also be due to the number of funds held in portfolio. As shown by Amin and Kat (2002), one has to hold a relatively high number of funds before the portfolio skewness approaches that of a portfolio containing all funds in the population.
<< Insert Table 3 and 4 >>
The results in table 1 are concerned with the average hedge fund and therefore do not provide information about the degree of dispersion between the different funds within a given strategy class. To solve this we calculated the standard deviation and skewness of the individual fund statistics over all funds within each strategy group. The results can be found in table 3 and 4. From table 3 we see that there is very substantial variation within each strategy group. The dispersion in the means and standard deviations of the various strategy groups tends to rise with the standard deviation of the average individual fund (see table 1). The dispersion in skewness and kurtosis on the other hand does not exhibit such a pattern. Especially distressed securities and global macro funds show a relatively high degree of variation in skewness and kurtosis. Dispersion in the autocorrelation coefficients is very similar over all categories. Looking at the skewness of the statistics in table 4, we see that most of the individual fund statistics are not symmetrically distributed around the averages reported in table 1. For all strategy groups the standard deviations exhibit positive skewness, implying that within each group there are funds that exhibit an exceptionally high standard deviation. The same is true for kurtosis. Skewness shows the reverse picture. With the exception of global macro funds, every strategy group appears to contain funds that exhibit exceptionally low skewness. The fact that we see the same pattern reflected in the fund of funds results suggests that many funds of funds are unable to sort out these outlier funds in advance.
4
. C
ORRELATION WITH
S
TOCKS AND
B
ONDS
Table 5 shows the average correlation coefficients between individual hedge fund returns and the returns on the S&P 500, the Russell 2000 and the Salomon Brothers bond index. The table also shows the average results from regressing individual fund returns on the returns of the S&P 500 and the Salomon Brothers bond index. From table 5 we clearly see that different strategy groups exhibit distinctly different
correlation patterns. Correlation with the S&P 500 ranges from non-existent for equity market neutral funds to moderately positive for long/short equity, merger arbitrage and emerging markets funds. Correlation with the Russell 2000 tends to be higher than with the S&P, indicating that the average hedge fund has a preference for small cap stocks. The correlations with bonds tend to be close to zero and vary inversely with the correlation with stocks. Overall, equity market neutral funds appear to be the least correlated with stocks as well as bonds.
<< Insert Table 5 and 6 >>
The regression results reflect the above correlations. The determination coefficients are low, especially for equity market neutral, global macro, convertible arbitrage and distressed securities funds. This highlights that only 10-20% of the variation in the average hedge fund’s returns can be explained by what happens in the US equity and bond markets, which is a striking difference with mutual funds where typically 80% or more is explained. Note that for all strategy groups the intercept of the average regression is positive and quite substantial. One could take this as evidence of superior performance but given the low determination coefficients as well as the non-normality of the average fund return, doing so is a very big step.
Table 6 shows the same correlations and regression results for the equally-weighted portfolios that we studied earlier. From the table we see that combining hedge funds into portfolios does not affect the ranking order. Also, the Russell 2000 correlations are still higher than those with the S&P 500. However, although the average individual hedge fund produces correlation coefficients that are quite low and might, with a little commercial flair, be referred to as ‘market neutral’, this is no longer the case for the portfolio correlations. The long/short equity, merger arbitrage and emerging market portfolios exhibit highly positive correlation with the S&P 500 and especially the Russell 2000. Looking at the regression results, we see that since most specific risk is diversified away now, the determination coefficients are almost twice as high as for the average individual fund. This still leaves 60-70% or more of the portfolio return unexplained though.
<< Insert Table 7 and 8 >>
Similar to what we did before, we calculated the standard deviation and skewness of the individual fund correlations with the three indices over all funds within each strategy group. The results can be found in table 7 and 8. Table 7 shows again that there is very substantial variation within each strategy group, with especially equity market neutral and long/short equity funds standing out. The skewness results are mixed, with global macro and convertible arbitrage funds showing positive skewness where the other strategy groups show negative skewness.
5. C
ORRELATION BETWEEN
H
EDGE
F
UNDS
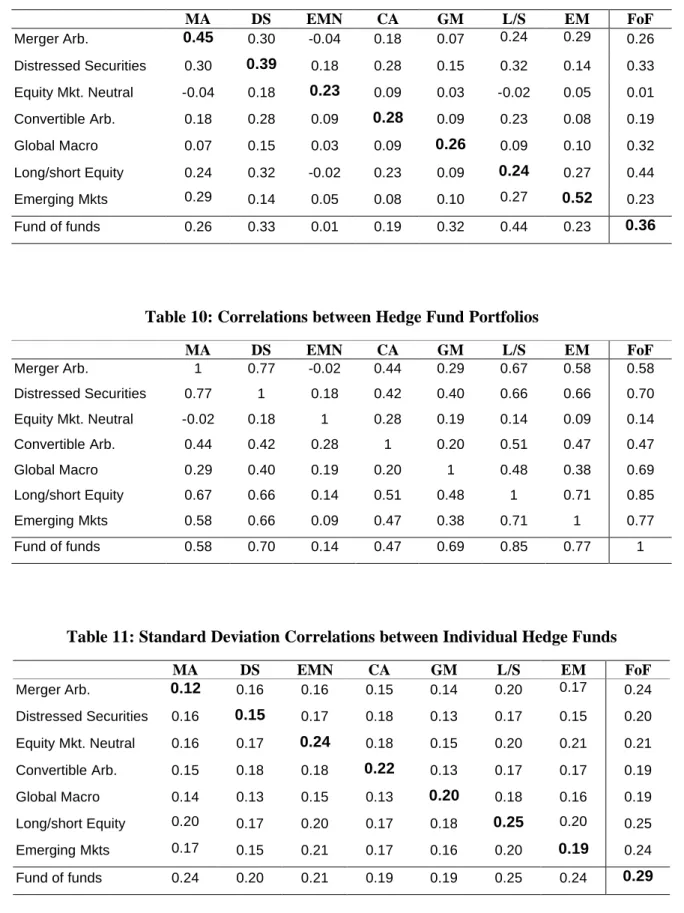
The next step is to study the correlation between individual funds of the same as well as different types. Table 9 shows the average correlations between individual hedge funds belonging to the various strategy groups as well as funds of funds. From the diagonal we see that, with the exception of emerging market funds, the average correlations between funds from the same strategy groups are quite low. This emphasizes that although funds may be classified in the same strategy group, this does in no way mean that they will produce similar returns. The correlation coefficients between funds from different strategy groups are low as well. Equity market neutral and global macro funds exhibit the lowest overall correlation. The fact that the average correlation between funds of the same type and between different types of funds is roughly of the same order of magnitude is an interesting finding. It means that as far as portfolio standard deviation is concerned (and ignoring differences in individual fund standard deviations), it makes little difference whether an investor diversifies within a given strategy group or between strategy groups.3
We calculated the same correlation matrix for the equally-weighted portfolios studied earlier. The results can be found in table 10. Although the signs are unchanged, the correlations between the various portfolios are much higher than those between individual funds, which reflects the absence of fund specific risk. As before, equity market neutral funds show the lowest correlation, with global macro funds in second place.
<< Insert Table 11 and 12 >>
The standard deviation and skewness of the individual fund correlations can be found in table 11 and 12. From table 11 it is clear that the degree of dispersion in the correlations between individual funds in the various strategy groups is more or less of the same order of magnitude. Note, however, that the standard deviations for funds of funds are all at the high end of the spectrum. Finally, table 12 shows that most correlations exhibit positive skewness, i.e. in most cases the more exceptional correlations are relatively high.
6. U
NSMOOTHING THE
D
ATA
As we saw before in section 3, the monthly returns of several types of funds exhibit a significant degree of autocorrelation due to marking-to-market problems. Brooks and Kat (2001) present an ‘unsmoothing’ technique that allows us to get a better picture of the true characteristics of the return data studied. Following Brooks and Kat (2001), the observed (or smoothed) value Vt* of a hedge fund at time t could be expressed as a
weighted average of the true value at time t, Vt, and the smoothed value at time t-1, Vt -1*: * ) 1 ( *= t+ − t−1 t V V V α α (1)
Given (1), it is possible to derive an expression that will yield an unsmoothed series with zero first order autocorrelation:
α α − − = − 1 * * t 1 t t r r r (2)
where rt and rt* are the true underlying (unobservable) return and the observed return
at time t respectively. It seems plausible in the context of the results presented above to set α equal to the autocorrelation coefficient at lag 1. The newly constructed series, rt, will have the same mean as rt*, but zero first order autocorrelation.
<< Insert Table 13 and 14 >>
We re-did all of the previous work using the unsmoothed return series obtained from (2). The average individual fund statistics as well as the statistics for equally-weighted portfolios can be found in table 13 and 14. Comparing table 1 and 13 we see that after unsmoothing the average standard deviations show a very significant rise. The higher the autocorrelation found in the raw data, the higher the rise. The average standard deviation of distressed securities funds rises from 2.37% to 3.05%. Likewise, the average standard deviation of convertible arbitrage funds rises from 3.01% to 4.0%. Comparing table 2 and 14 we see a similar effect. The standard deviation of the distressed securities portfolio rises from 1.54% to 1.90%., while the standard deviation of the convertible arbitrage portfolio rises from 1.64% to 2.15%. We also observe some changes in skewness and kurtosis. It is, however, not clear whether this is real of just due to the limited number of observations available. It is interesting to note that although the unsmoothed individual fund returns do not exhibit any first-order serial correlation anymore, some of the portfolios still do. The distressed securities portfolio for example exhibits a 1-month serial correlation of 0.24, while the convertible arbitrage portfolio shows a 1-month serial correlation of 0.29. In line with what we saw before, this confirms that forming portfolios itself tends to create serial correlation. When dealing with a portfolio of hedge funds one should therefore leave the unsmoothing until after the construction of the portfolio. The remainder of the results for unsmoothed returns are more or less identical to those for the raw return data and therefore not reported.
6. C
ONCLUSIONS
In this paper we have studied the statistical properties of individual hedge fund returns. Our main conclusions are as follows:
• The Tremont TASS hedge fund (self-)classification has significant discriminatory power. Different strategy groups exhibit distinctly different return characteristics.
• The returns of the average individual hedge fund exhibit a significant degree of skewness and excess kurtosis. With the exception of global macro funds, the average individual hedge fund’s return distribution is negatively skewed.
• Especially merger arbitrage, distressed securities, convertible arbitrage and emerging market fund returns exhibit relatively high positive first-order serial correlation. When not corrected for this will lead investors to grossly underestimate the true volatility of these types of funds.
• The average individual hedge fund’s correlation with the stock market is moderately positive. The correlation with bonds tends to be close to zero. Only 10-20% of the variation in the average individual hedge fund’s returns can be explained by what happens in the US equity and bond markets.
• Apart from equity market neutral and global macro funds, the average correlations between hedge funds in the same strategy group and funds in different strategy groups are of the same order of magnitude and relatively low.
• There is very substantial variation within each of the strategy groups. Put another way, funds classified in the same strategy group may still show large differences in performance. This underlines the heterogeneity of today’s hedge fund industry.
In the process we also looked at the effects of forming portfolios of hedge funds. This yielded the following additional conclusions:
• Portfolios of hedge funds tend to have lower standard deviation and lower skewness than the average individual fund, with especially merger arbitrage and distressed securities funds standing out.
• Portfolios of hedge funds exhibit higher serial correlation than the average individual fund. In other words, forming portfolios tends to create serial correlation.
• The correlation between portfolios of hedge funds and stocks and bonds is significantly higher than for the average individual hedge fund. However, movements in the US equity and bond markets still only explain 20-40% of the variation in hedge fund portfolios returns.
Finally, we compared fund of fund returns with those of an equally-weighted portfolio of all funds in our sample. Over the period 1994-2001 the all-funds portfolio offered a striking 0.23% (2.76% per annum) higher mean return than the average fund of funds. Since this more or less equals the fees charged by funds of funds, this strongly suggests that the timing and fund picking activities of the average fund of funds are not rewarded by a higher return. On average, funds of funds do
appear to be able to somewhat reduce skewness. Despite this, the average fund of funds seems an expensive way to invest in hedge funds.
F
OOTNOTES
1. Since most hedge funds only report to one or two data vendors, different databases tend to cover different parts of the hedge fund universe. The same is true for the hedge fund indices calculated from these databases.
2. Note that although the funds in the all-funds portfolio are equally-weighted this does not mean that the various strategy groups are given equal weights as well. Since our sample of funds is a fair representation of the (perceived) hedge fund universe, the strategy weights are similar to the market shares mentioned in section 2.
3. The same need not be the case for skewness and kurtosis though. Research is currently underway to investigate this in more detail.
R
EFERENCES
Amin, G. and H. Kat (2001), Welcome to the Dark Side: Hedge Fund Attrition and Survivorship Bias 1994-2001, Working Paper, ISMA Centre, University of Reading.
Amin, G. and H. Kat (2002), Portfolios of Hedge Funds: What Investors Really Invest In, Working Paper ISMA Centre, University of Reading.
Brooks, C. and H. Kat (2001), The Statistical Properties of Hedge Fund Index Returns and Their Implications for Investors, Working Paper ISMA Centre, University of Reading.
Table 1: Averages Statistics Individual Hedge Fund Returns
Mean Standard Deviation
Skewness Kurtosis AC (1) AC(2) AC(3) AC (4)
Merger Arbitrage. 1.17 1.75 -0.50 7.60 0.13 -0.06 -0.09 -0.06 Distressed Securities 0.89 2.37 -0.77 8.92 0.25 0.08 -0.04 0.02 Equity Mkt. Neutral 0.54 2.70 -0.40 5.58 0.08 -0.01 0.15 0.10 Convertible Arbitrage 0.96 3.01 -1.12 8.51 0.30 0.16 0.10 0.03 Global Macro 0.77 5.23 1.04 10.12 0.03 -0.03 0.00 -0.03 Long/short Equity 1.34 5.83 0.00 6.08 0.09 0.01 0.01 -0.03 Emerging Markets 0.38 8.33 -0.36 7.83 0.15 -0.01 -0.02 -0.02 Fund of funds 0.75 3.34 -0.16 6.54 0.17 0.04 0.00 -0.04 S&P 500 1.46 4.38 -0.79 3.92 -0.11 -0.04 0.04 -0.07
Salomon Bond index 0.58 0.85 0.24 4.13 0.24 0.16 0.09 0.05
Table 2: Statistics Equally-Weighted Portfolios (I)
Mean Standard Deviation
Skewness Kurtosis AC (1) AC(2) AC(3) AC (4)
Merger Arbitrage 1.17 1.04 -2.19 14.32 0.23 -0.04 -0.10 -0.17 Distressed Securities 0.89 1.54 -2.60 15.19 0.43 0.13 -0.05 0.00 Equity Mkt. Neutral 0.54 1.14 -0.41 3.16 0.31 0.29 0.27 0.28 Convertible Arbitrage 0.96 1.64 -1.35 6.73 0.51 0.23 0.12 0.03 Global Macro 0.77 2.43 0.87 3.85 0.15 0.04 -0.11 -0.19 Long/short Equity 1.34 2.95 -0.29 4.57 0.13 -0.02 -0.01 -0.08 Emerging Markets 0.38 6.15 -0.65 7.16 0.18 -0.13 -0.01 -0.10 All Funds 0.98 2.22 -0.53 5.92 0.23 0.00 -0.05 -0.07
Table 3: Standard Deviation Individual Hedge Fund Return Statistics
Mean Standard Deviation
Skewness Kurtosis AC (1) AC(2) AC(3) AC (4)
Merger Arbitrage 0.25 1.29 1.07 3.82 0.14 0.10 0.12 0.08 Distressed Securities 0.39 1.44 1.43 6.07 0.13 0.10 0.13 0.11 Equity Mkt. Neutral 0.47 0.90 0.72 2.90 0.17 0.17 0.08 0.13 Convertible Arbitrage 0.42 2.40 1.10 5.00 0.15 0.14 0.14 0.16 Global Macro 0.50 2.15 1.50 9.41 0.13 0.14 0.09 0.11 Long/short Equity 0.73 2.74 0.98 3.99 0.14 0.14 0.12 0.11 Emerging Markets 1.04 2.87 1.12 5.71 0.13 0.13 0.09 0.11 Fund of funds 0.45 1.77 0.99 3.83 0.12 0.12 0.09 0.11
Table 4: Skewness Individual Hedge Fund Return Statistics
Mean Standard Deviation
Skewness Kurtosis AC (1) AC(2) AC(3) AC (4)
Merger Arbitrage -1.49 2.85 -0.13 3.94 0.30 -1.01 0.03 -0.88 Distressed Securities 1.00 1.10 -0.11 2.16 -0.06 -0.20 -0.40 -0.35 Equity Mkt. Neutral 0.71 1.32 -1.48 2.16 1.03 0.57 -1.17 -0.88 Convertible Arbitrage 0.84 0.79 -0.63 1.40 -0.30 -0.91 -0.36 0.71 Global Macro 0.19 0.26 0.99 1.96 -0.97 0.06 0.15 -0.26 Long/short Equity -0.33 1.53 -0.55 4.95 0.08 0.29 0.68 0.54 Emerging Markets 0.12 1.24 -0.46 2.59 0.01 0.12 0.46 -0.41 Fund of funds -0.55 1.16 -0.36 2.66 -0.26 -0.02 0.22 0.22
Table 5: Average Correlation Individual Hedge Funds with Stocks and Bonds
S&P Russell 2000
Salomon Brothers
Alpha Beta1 Beta2 R2
Equity Mkt. Neutral 0.07 0.00 0.07 0.40 0.05 0.13 0.08 Global Macro 0.14 0.13 0.09 0.26 0.21 0.43 0.06 Convertible Arbitrage 0.19 0.26 -0.04 0.97 0.15 -0.37 0.09 Distressed Securities 0.29 0.37 -0.08 0.89 0.17 -0.39 0.12 Long/short Equity 0.35 0.45 -0.01 0.94 0.47 -0.36 0.22 Merger Arbitrage 0.37 0.47 -0.10 1.20 0.12 -0.32 0.20 Emerging Markets 0.44 0.48 -0.14 0.33 0.90 -1.94 0.25 Fund of funds 0.34 0.46 -0.01 0.51 0.24 -0.10 0.21
Table 6: Correlation Equally-Weighted Portfolios with Stocks and Bonds
S&P Russell 2000
Salomon Brothers
Alpha Beta1 Beta2 R2
Equity Mkt. Neutral 0.19 0.08 0.12 0.40 0.05 0.13 0.05 Global Macro 0.37 0.53 0.18 0.26 0.21 0.43 0.16 Convertible Arb. 0.38 0.53 -0.14 0.97 0.15 -0.37 0.18 Distressed Securities 0.47 0.61 -0.16 0.89 0.17 -0.39 0.27 Long/short Equity 0.63 0.81 0.01 0.94 0.47 -0.36 0.40 Merger Arb. 0.56 0.72 -0.03 1.20 0.12 -0.32 0.32 Emerging Mkts 0.67 0.90 0.01 0.33 0.90 -1.94 0.45 All Funds 0.68 0.85 -0.05 0.72 0.35 -0.35 0.48
Table 7: Standard Deviation Correlation Hedge Funds with Stocks and Bonds
S&P Russell 2000
Salomon Brothers
Alpha Beta1 Beta2 R2
Equity Mkt. Neutral 0.23 0.27 0.13 0.52 0.20 0.54 0.06 Global Macro 0.17 0.22 0.09 0.61 0.31 0.71 0.08 Convertible Arb. 0.17 0.17 0.12 0.40 0.20 0.63 0.11 Distressed Securities 0.11 0.14 0.10 0.41 0.14 0.41 0.07 Long/short Equity 0.29 0.29 0.11 0.81 0.53 0.86 0.17 Merger Arb. 0.17 0.19 0.10 0.51 0.12 0.33 0.10 Emerging Mkts 0.14 0.15 0.07 1.24 0.40 1.28 0.11 Fund of funds 0.25 0.29 0.15 0.59 0.28 0.93 0.13
Table 8: Skewness Correlation Hedge Funds with Stocks and Bonds
S&P Russell 2000
Salomon Brothers
Alpha Beta1 Beta2 R2
Equity Mkt. Neutral -0.56 0.22 -0.36 -0.11 1.02 -1.30 1.73 Global Macro 1.12 0.71 -0.13 -1.17 2.10 -0.08 2.66 Convertible Arb. 0.24 0.02 -0.31 1.07 1.14 -1.03 1.47 Distressed Securities -0.33 -0.76 0.32 0.83 1.03 -0.55 0.43 Long/short Equity -0.84 -1.21 -0.04 0.29 0.43 -0.02 1.03 Merger Arb. -2.18 -1.43 -0.93 -0.99 -0.31 -1.77 0.70 Emerging Mkts -1.71 -1.61 -0.18 1.07 -0.13 -1.99 -0.17 Fund of funds -1.44 -1.57 1.11 -1.61 -0.91 1.76 0.83
Table 9: Average Correlations between Individual Hedge Funds MA DS EMN CA GM L/S EM FoF Merger Arb. 0.45 0.30 -0.04 0.18 0.07 0.24 0.29 0.26 Distressed Securities 0.30 0.39 0.18 0.28 0.15 0.32 0.14 0.33 Equity Mkt. Neutral -0.04 0.18 0.23 0.09 0.03 -0.02 0.05 0.01 Convertible Arb. 0.18 0.28 0.09 0.28 0.09 0.23 0.08 0.19 Global Macro 0.07 0.15 0.03 0.09 0.26 0.09 0.10 0.32 Long/short Equity 0.24 0.32 -0.02 0.23 0.09 0.24 0.27 0.44 Emerging Mkts 0.29 0.14 0.05 0.08 0.10 0.27 0.52 0.23 Fund of funds 0.26 0.33 0.01 0.19 0.32 0.44 0.23 0.36
Table 10: Correlations between Hedge Fund Portfolios
MA DS EMN CA GM L/S EM FoF Merger Arb. 1 0.77 -0.02 0.44 0.29 0.67 0.58 0.58 Distressed Securities 0.77 1 0.18 0.42 0.40 0.66 0.66 0.70 Equity Mkt. Neutral -0.02 0.18 1 0.28 0.19 0.14 0.09 0.14 Convertible Arb. 0.44 0.42 0.28 1 0.20 0.51 0.47 0.47 Global Macro 0.29 0.40 0.19 0.20 1 0.48 0.38 0.69 Long/short Equity 0.67 0.66 0.14 0.51 0.48 1 0.71 0.85 Emerging Mkts 0.58 0.66 0.09 0.47 0.38 0.71 1 0.77 Fund of funds 0.58 0.70 0.14 0.47 0.69 0.85 0.77 1
Table 11: Standard Deviation Correlations between Individual Hedge Funds
MA DS EMN CA GM L/S EM FoF Merger Arb. 0.12 0.16 0.16 0.15 0.14 0.20 0.17 0.24 Distressed Securities 0.16 0.15 0.17 0.18 0.13 0.17 0.15 0.20 Equity Mkt. Neutral 0.16 0.17 0.24 0.18 0.15 0.20 0.21 0.21 Convertible Arb. 0.15 0.18 0.18 0.22 0.13 0.17 0.17 0.19 Global Macro 0.14 0.13 0.15 0.13 0.20 0.18 0.16 0.19 Long/short Equity 0.20 0.17 0.20 0.17 0.18 0.25 0.20 0.25 Emerging Mkts 0.17 0.15 0.21 0.17 0.16 0.20 0.19 0.24 Fund of funds 0.24 0.20 0.21 0.19 0.19 0.25 0.24 0.29
Table 12: Skewness Correlations between Individual Hedge Funds MA DS EMN CA GM L/S EM FoF Merger Arb. -0.26 -0.08 0.29 0.42 0.66 -0.48 -0.24 -0.60 Distressed Securities -0.08 0.50 0.16 -0.12 0.40 -0.56 0.00 -0.80 Equity Mkt. Neutral 0.29 0.16 1.76 0.80 0.12 0.33 0.50 0.54 Convertible Arb. 0.42 -0.12 0.80 1.29 0.63 0.32 0.01 0.11 Global Macro 0.66 0.40 0.12 0.63 1.22 0.72 0.81 0.50 Long/short Equity -0.48 -0.56 0.33 0.32 0.72 -0.31 -0.68 -0.56 Emerging Mkts -0.24 0.00 0.50 0.01 0.81 -0.68 -0.52 -0.77 Fund of funds -0.60 -0.80 0.54 0.11 0.50 -0.56 -0.77 -0.65
Table 13: Averages Statistics Unsmoothed Individual Hedge Fund Returns
Mean Standard Deviation
Skewness Kurtosis AC (1) AC(2) AC(3) AC (4)
Merger Arbitrage. 1.17 2.02 -0.46 7.30 0.02 -0.07 -0.07 -0.05 Distressed Securities 0.91 3.05 -0.66 9.15 0.01 0.01 -0.08 0.03 Equity Mkt. Neutral 0.55 3.04 -0.39 5.66 0.00 -0.04 0.12 0.07 Convertible Arbitrage 0.96 4.00 -0.89 8.04 0.00 0.04 0.04 0.01 Global Macro 0.76 5.37 1.01 9.68 0.01 -0.05 0.00 -0.04 Long/short Equity 1.37 6.37 0.01 5.92 0.00 -0.02 0.00 -0.03 Emerging Markets 0.39 9.75 -0.39 7.83 0.02 -0.05 -0.01 -0.02 Fund of funds 0.76 3.98 -0.21 6.40 0.00 0.00 -0.02 -0.03 S&P 500 1.36 4.39 -0.82 3.98 -0.11 -0.05 0.03 -0.06
Table 14: Statistics Equally-Weighted Portfolios (II)
Mean Standard Deviation
Skewness Kurtosis AC (1) AC(2) AC(3) AC (4)
Merger Arbitrage 1.17 1.21 -2.20 14.22 0.18 -0.13 -0.10 -0.09 Distressed Securities 0.91 1.90 -2.93 19.36 0.24 0.02 -0.10 0.02 Equity Mkt. Neutral 0.55 1.26 -0.63 4.11 0.18 0.27 0.17 0.21 Convertible Arbitrage 0.96 2.15 -0.96 6.66 0.29 0.02 0.03 0.06 Global Macro 0.76 2.55 0.85 4.00 0.04 -0.10 -0.05 0.00 Long/short Equity 1.37 3.20 -0.30 4.47 0.05 -0.11 -0.01 -0.08 Emerging Markets 0.39 7.15 -0.82 7.28 0.12 -0.06 -0.03 -0.02 All Funds 0.96 2.50 -0.57 5.61 0.11 -0.03 -0.07 -0.07