A Comparative Analysis of Community Wind Power
Development Options in Oregon
Prepared for the Energy Trust of Oregon
by
Mark Bolinger, Ryan Wiser, Tom Wind, Dan Juhl, and Robert Grace
About the Authors
Mark BolingerMark Bolinger is a research associate at Lawrence Berkeley National Laboratory (LBNL), as well as an independent consultant. Mark’s research focuses on renewable energy economics, markets, policies, and programs. Through his work at LBNL, Mark has written extensively on community wind power development in Europe and North America. Mark received a B.A. from Dartmouth College and holds an M.A. in Energy and Resources from the University of California, Berkeley. Ryan Wiser
Ryan Wiser is a scientist at Lawrence Berkeley National Laboratory (LBNL) and is principal of Wiser Consulting. Mr. Wiser founded Wiser Consulting in 1995, a firm that emphasizes economic, policy, and business analysis of renewable electricity markets. At LBNL, Mr. Wiser manages, leads, and conducts research in the planning, design, and evaluation of renewable energy programs, green marketing opportunities, and renewable energy economics. Mr. Wiser has advised numerous state and federal organizations in the development of their renewable energy programs. Mr. Wiser
received a B.S. from Stanford University and holds an M.S. and Ph.D. in Energy and Resources from the University of California, Berkeley.
Tom Wind
Mr. Wind is the owner of Wind Utility Consulting. As a professional consulting electrical engineer, Mr. Wind specializes in wind generation projects and in the integration of wind generation into the utility grid system. He has been the project engineer for several small distributed wind generation projects in the Midwest. He graduated from Iowa State University in 1974 with a BS in electrical engineering. He was employed at Iowa Southern Utilities for 15 years before becoming a self-employed consulting engineer in 1989. He is a member of AWEA, UWIG, IEEE, the Technical Advisory Group for wind generation for the U.S. National Committee of the IEC, and the MidContinent Area Power Pool Design Review Subcommittee.
Dan Juhl
Mr. Juhl has pioneered conservation and renewable energy technologies, particularly wind power, in the Midwest for over 25 years. During his tenure in the wind industry, Mr. Juhl's activities have covered every aspect of the technology including R&D, design, manufacturing, development, installation, and O&M. He has also been instrumental in helping to form public policy by working with legislators and regulators on the workings and benefits of utilizing renewables in the energy mix, and is considered to be one of the nation’s leading experts on locally owned renewable
distributive generation. Mr. Juhl currently owns and manages two companies active in the renewable energy business, including a 10.2 MW wind farm on the Buffalo Ridge in Southwest Minnesota. Robert Grace
Robert Grace (Sustainable Energy Advantage) helps public, private, and non-profit clients develop opportunities for renewable resources in competitive electric markets. By delivering strategic, policy, and market analysis, Bob has supported the development and implementation of renewable energy policy and funding programs, wholesale and retail electricity businesses, and electric market infrastructure. Bob previously headed up green power marketing at AllEnergy Marketing Company, and has also worked for the New England Power Company and LaCapra Associates. Bob holds degrees in Energy and Resources (M.S., University of California) and Energy Studies (B.S., Brown University).
Acknowledgements
This report was prepared under the direction of Peter West of the Energy Trust of Oregon. We appreciate his direction, counsel, and comments throughout the research and writing process. We also appreciate the assistance of Jeff Keto (Oregon Department of Energy), Paul Woodin (Western Wind Power), and Ed Ing (Law Office of Edwin T.C. Ing) in answering Oregon-specific and tax-related questions. We also thank John Harper for his comments on an earlier version of this report. Of course, any errors or omissions that remain are the sole responsibility of the authors.
Table of Contents
Executive Summary ... i
1. Introduction... 1
2. Community Wind in Europe ... 4
2.1 History and Current Status... 4
2.2 European Ownership Structures ... 5
2.3 European Drivers of Community Wind ... 6
2.4 Lessons Learned... 7
3. Community Wind in the United States ... 9
3.1 History and Current Status... 9
3.1.1 Minnesota... 9 3.1.2 Iowa... 13 3.1.3 Wisconsin... 14 3.1.4 Illinois ... 15 3.1.5 Massachusetts ... 15 3.2 Lessons Learned... 16
4. Potential Barriers to Community Wind in the US (and Oregon)... 18
4.1 Financial Barriers... 19
4.1.1 General Inability to Utilize Tax Incentives... 19
4.1.2 Determining a Feasible Financial Structure... 21
4.1.3 Financing the Project ... 24
4.1.4 Potentially Poor Economies of Scale... 25
4.2 Regulatory Barriers... 28
4.2.1 Securities Regulation ... 28
4.2.2 Utility Rate Structures... 31
4.3 Technical Barriers... 33
4.3.1 The Interconnection Process ... 33
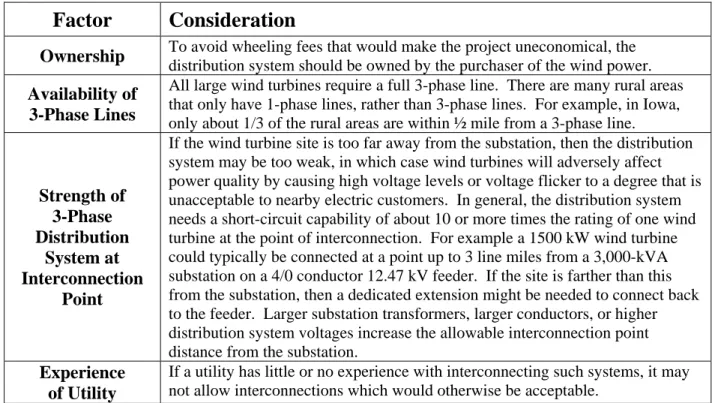
4.3.2 Limitations on Interconnecting Wind Turbines to the Distribution System... 34
4.4 Market Barriers ... 37
4.4.1 Wind Easements Already Sold ... 37
4.4.2 All-Requirements Contracts... 38
4.4.3 Lack of On-Site Opportunities... 39
4.4.4 Identifying and Securing Potential Revenue Sources ... 40
4.5 Summary of Barriers... 41
5. Development of a Standard Set of Assumptions for Comparative Financial Analysis ... 44
5.1 Description of Financial Model ... 44
5.2 Project Cost Assumptions ... 44
5.2.1 Turbine and Works ... 47
5.2.2 Balance of Plant ... 47
5.2.3 Interconnection ... 47
5.2.4 Soft Costs ... 48
5.2.5 Operating Costs... 49
5.3 Project Performance Assumptions... 51
5.4 Incentive Assumptions... 51
5.4.2 Oregon Incentives ... 53
5.5 Financing Assumptions... 56
6. Description and Modeling of Potential Ownership Structures ... 58
6.1 Cooperative Ownership ... 59
6.1.1 Description... 59
6.1.2 Barriers... 60
6.1.3 Financial Analysis... 61
6.2 Aggregate Net Metering ... 62
6.2.1 Description... 62 6.2.2 Barriers... 63 6.2.3 Financial Analysis... 63 6.3 On-Site, Behind-the-Meter ... 65 6.3.1 Description... 65 6.3.2 Barriers... 65 6.3.3 Financial Analysis... 66
6.4 Multiple Local Owner... 69
6.4.1 Description... 69
6.4.2 Barriers... 69
6.4.3 Financial Analysis... 70
6.5 Minnesota-Style “Flip” Structure ... 75
6.5.1 Description... 76
6.5.2 Barriers... 76
6.5.3 Financial Analysis... 77
6.6 Wisconsin-Style “Flip” Structure ... 80
6.6.1 Description... 80 6.6.2 Barriers... 81 6.6.3 Financial Analysis... 81 6.7 Town-Owned ... 83 6.7.1 Description... 83 6.7.2 Barriers... 83 6.7.3 Financial Analysis... 84 6.8 Summary ... 86 7. Conclusions... 90
List of Tables and Figures
Table 1. Community Wind Power Development in Select European Countries (2000)... 4
Table 2. Historical Drivers of Community Wind Power Development... 6
Table 3. Estimated Impact of Project Size on Project Cost ... 26
Table 4. Estimated Capital Cost Ranges for Small and Large Wind Projects ... 27
Table 5. Factors Affecting the Ability to Interconnect to the Distribution System ... 35
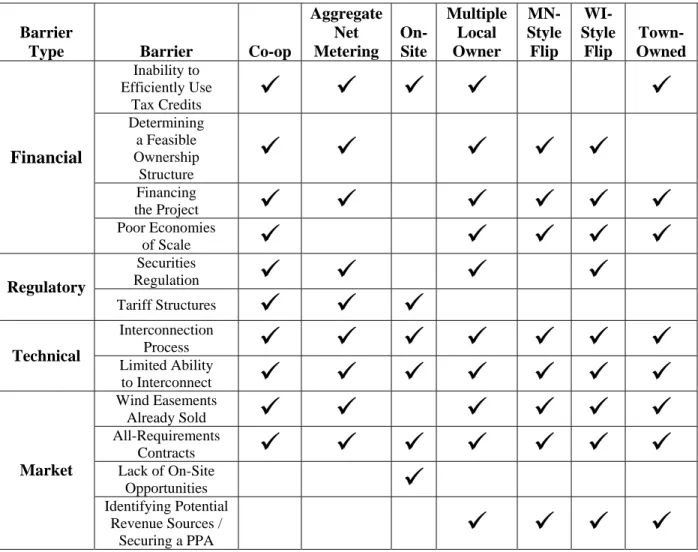
Table 6. Barriers Matrix... 42
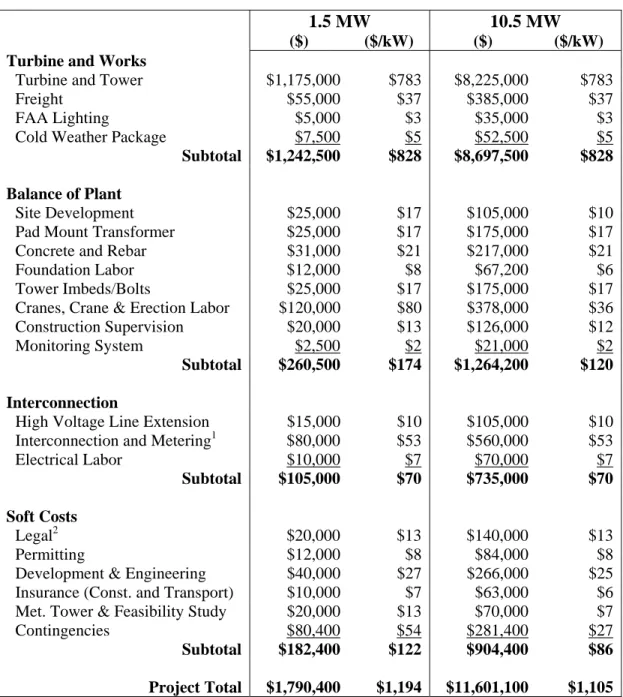
Table 7. Capital Costs for a Minnesota-Style “Flip” Structure... 46
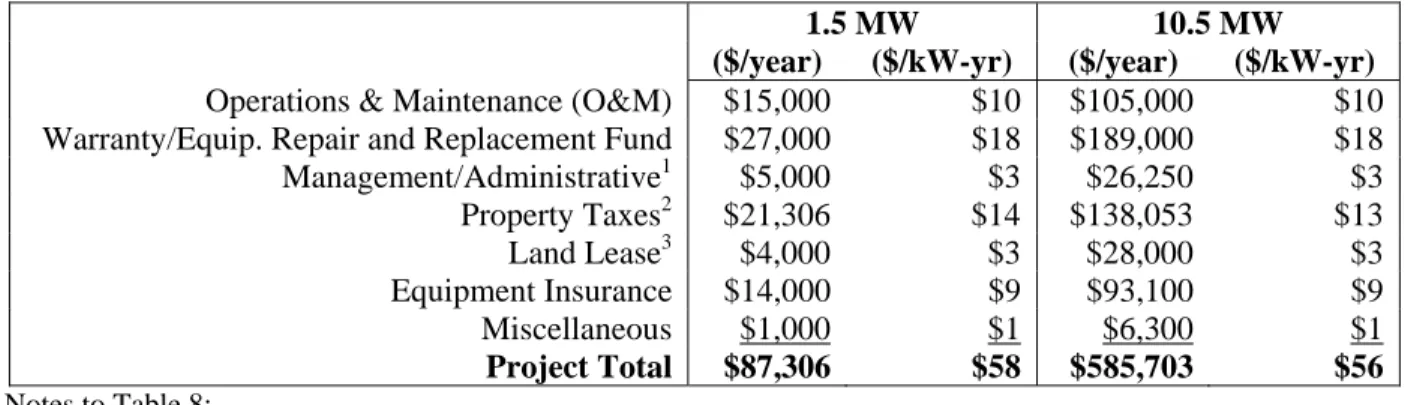
Table 8. First Year Operating Costs for a Minnesota-Style “Flip” Structure ... 50
Table 9. Modeling Results – Aggregate Net Metering ... 64
Table 10. Modeling Results – On-Site... 67
Table 11. Modeling Results – Multiple Local Owner ... 71
Table 12. Sensitivity Results – Multiple Local Owner ... 73
Table 13. Modeling Results – Minnesota-Style Flip ... 78
Table 14. Modeling Results – Wisconsin-Style Flip ... 82
Table 15. Modeling Results – Town-Owned ... 85
Table 16. Base-Case Modeling Results Under Different Ownership Structures (1.5 MW Project)... 88
Table 17. Base-Case Modeling Results Under Different Ownership Structures (10.5 MW Project)... 89
Figure 1. Tax Liability Required to Reap Full Tax Benefits of a 1.5 MW Wind Project... 20
Figure 2. Revenue Requirement as a Function of PTC Efficiency ... 74
Figure 3. Revenue Requirement as a Function of Local Required After-Tax IRR... 75
Executive Summary
Background
The Northwestern United States is currently home to several large, commercially developed wind projects. With many more in the development pipeline, large commercial wind projects will likely dominate wind power development in the Northwest for years to come. Recently, however, there has also been growing interest throughout the Northwest in wind projects of a smaller scale, yet still using modern utility-grade wind turbines – i.e., so called “community wind.” For the purposes of this report, we define “community wind” power development to mean locally owned projects, consisting of one or more utility-scale wind turbines that are interconnected on either the customer or utility side of the meter.1
Community wind power development, which began in Denmark in the late 1970’s, has
historically been the dominant form of wind power development in northern Europe. At the end of the year 2000, roughly 80% of all wind power capacity in Germany, Denmark, Sweden, and the United Kingdom combined could be considered community-owned. Even today, as the wind industry matures and attracts the attention of big business, community wind continues to thrive in Germany, which is by far the world’s leader in installed wind power capacity. Thus, despite its quaint-sounding name, community wind has historically been responsible for large amounts of installed wind power capacity.
Yet applying the European community wind power development model in the United States has proven to be challenging. Most of the drivers of community wind in Europe – including feed-in tariffs, which require utilities to purchase wind power at premium prices for extended terms – are generally not present in the United States. In addition, community wind power development in the United States faces a number of barriers, which can be loosely categorized as follows:
• Financial: inability of most individual investors to efficiently utilize tax credits for wind power, determining a feasible ownership structure for the project, financing the project, potentially poor economies of scale
• Regulatory: securities regulation and the potential need to register equity shares in a wind power project with the Securities and Exchange Commission, unfavorable utility rate structures
• Technical: an interconnection process geared towards much larger power plants, limitations on where wind turbines can be interconnected to the distribution grid
• Market: wind easements already sold to commercial wind developers, “all-requirements” contracts that limit the ability of a rural electric cooperative to purchase wind power, lack of on-site project opportunities, identifying potential revenue sources, negotiating a power purchase agreement.
1
We define “locally-owned” to mean that one or more members of the local community have a significant direct financial stake in the project, other than through land lease payments, tax revenue, or other payments in lieu of taxes. For new projects, as will be the case in Oregon, we define “utility-scale” to mean projects consisting of one or more turbines of 600 kW (currently the smallest turbine size offered by the major wind turbine manufacturers) or greater in nameplate capacity.
As a result of these barriers (the most important of which will be discussed later in conjunction with specific ownership structures), success in developing community wind projects in the US has been slow in coming.
Despite the challenges encountered, emerging experience in several states shows that community wind is possible in the US if the right combination of policies and conditions exist. For example, community wind development in Minnesota has been driven by requirements that the local utility purchase – under standardized wind tariffs – a certain amount of power from smaller wind projects, and by state production incentives for those projects. Similarly, favorable net metering rules and utility rate structures in Iowa have spurred large, on-site installations. In general, specific state policies that differentially support community wind have been necessary to drive this form of wind development.
Drawing on experience with community wind in Europe and the US, this report – which was funded by the Energy Trust of Oregon (Energy Trust) – begins to evaluate the advantages, barriers, costs, and financing structures associated with community wind generally, and in Oregon specifically. The Energy Trust’s goal in commissioning this report is to gain a better understanding of the likely ownership structures that will be used for community wind projects in the Northwest, as well as the types and levels of financial and non-financial support that may be required to make such projects viable. Armed with such an understanding, the Energy Trust will be in a better position to evaluate community wind proposals that it receives through its Open Solicitation program, as well as to support community wind projects through a targeted community wind program.
Analysis
The analysis in this report is based on a pro forma yearly cash flow model developed to analyze and compare the financial attractiveness (using each project’s revenue requirement as the primary metric) of various community wind ownership structures that have been either
contemplated or implemented in the US. Specific development models or ownership structures examined include:
• Cooperative Ownership: Cooperative members invest in a community wind project, and benefit by patronizing the project through purchasing its energy and/or tradable renewable certificates (TRCs) at cost. Patronage of the project’s power will likely require either cooperation from the utility (to deliver the power on behalf of the cooperative), or the
cooperative to act as a competitive energy service provider, delivering power to its members. The latter is not a possibility in Oregon, where retail choice exists only for the largest end-users, while the former is perhaps unlikely in Oregon or anywhere else in the US (and is one reason why no wind cooperatives have been developed in the US). As a result, we describe and discuss cooperative ownership in the full report, but do not model it.
• Aggregate Net Metering: A group of local investors develop and own a centrally located (not on-site) utility-scale wind turbine, and apply their portion of the turbine’s output against their on-site electricity consumption. This model – which is similar to cooperative
ownership, but in the US is more likely to be structured as a limited liability company (LLC) – requires utility cooperation, or more likely legislative or regulatory action to force utility
cooperation. As a result, aggregate net metering has to date been implemented in only a very limited fashion in the US, for farm-based biogas systems in both Vermont and California. • On-Site, Behind-the-Meter: A large electricity customer (either a taxable business or a
tax-exempt entity such as a school) installs a utility-scale wind turbine on the customer side of the meter to supply on-site power and thereby displace power purchased from the utility. This model has been popular among public schools in Iowa, at least eight of which have taken advantage of the state’s generous net billing program (which historically imposed no size limit on net-metered generators), single-part tariffs, and a zero interest revolving loan fund.
• Multiple Local Owner: Local landowners and investors, ideally with tax credit appetite, pool their resources into an LLC to own and operate the project, selling output to the local utility. This structure most closely resembles the Minwind projects in Minnesota.
• Minnesota-Style “Flip” Structure: A local investor (typically the owner of a windy site) without tax credit appetite brings in a tax-motivated corporate equity partner to own most of the project for the first ten years (i.e., the period of tax credits), and then “flip” project ownership to the local investor thereafter. This structure has been popularized in Minnesota (along with the multiple local owner structure described in the previous bullet).
• Wisconsin-Style “Flip” Structure: Similar to a Minnesota-style flip, though involving a group of local investors who provide debt, rather than equity, financing to the project, and then purchase the entire project from the corporate partner at the end of ten years. This structure, which has yet to be implemented, is developed and described in a generic business plan funded by Wisconsin’s clean energy fund.
• Town-Owned: A municipality develops and owns a utility-scale wind project, potentially financed with tax-exempt municipal bonds, and sells the power to an unrelated party. This model is currently being pursued by a school district in Minnesota, as well as by the Massachusetts Community Wind Collaborative.
To analyze these various ownership structures, we have developed an Excel-based, 20-year cash flow model. Using Excel’s “Solver” tool,2 the model optimizes the project’s capital structure (i.e., debt/equity ratio) to arrive at the minimum amount of revenue (on a $/MWh basis,
originating from the sale of power or tradable renewable certificates (TRCs), as well as financial support from the USDA, Energy Trust, or some other source) required to meet both the lender’s debt service coverage requirements and the equity investors’ after-tax internal rate of return requirements. Unless otherwise specified by the user, the model presumes that the project owner has sufficient tax liability to utilize all tax benefits. The model also accounts for interactions between state and federal tax (and other) incentives where warranted (e.g., anti-double-dipping provisions).
For each structure (with the exception of on-site projects, for which a 10.5 MW project is irrelevant), we model both a 1.5 MW and 10.5 MW project.3 We assume that, in aggregate, the
2
Solver is a linear programming tool that uses an iterative process to hone in on the optimal solution, subject to user-defined constraints.
3
At the low end of the range, the 1.5 MW project is intended to represent a project that is within financial reach of most potential community wind investors. It is interconnected to, and its power is consumed within, the local distribution system. The 10.5 MW project, meanwhile, is not intended as an upper bound on the size of community
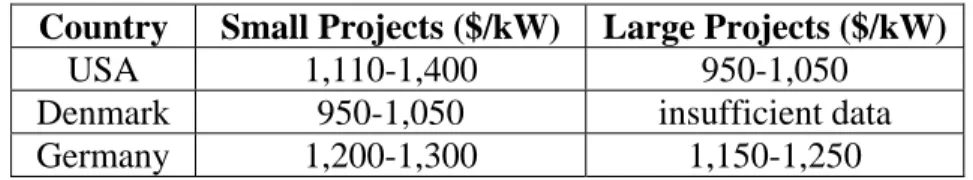
1.5 MW project has an installed cost of around $1.88 million, or $1,250/kW, while the 10.5 MW project comes in about 7% cheaper at approximately $1,160/kW, or $12.2 million.4 On a $/kW basis, these aggregate costs are higher than those experienced by many of the community wind projects being installed in Minnesota, but perhaps slightly lower than those assumed in some of the community wind projects currently planned in Oregon.
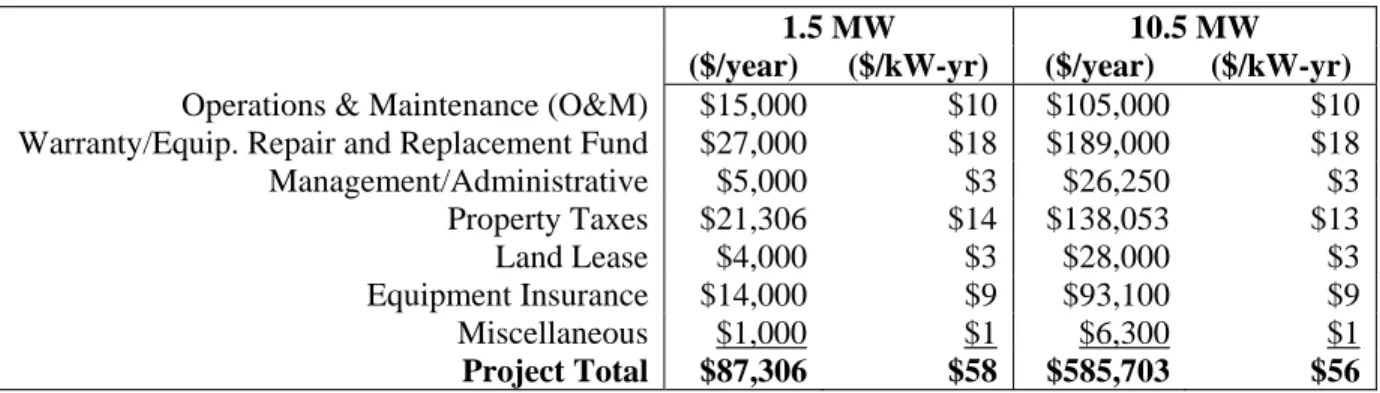
In addition to these one-time capital costs and fees, the project will also incur ongoing operating costs. Table ES-1 lists our assumptions for such costs in the first year of a Minnesota-style flip project (like capital costs, operating costs will vary somewhat with ownership structure – see the full report for more details). With the exception of property tax,5 we assume that each of the line items listed in Table ES-1 will escalate at the annual rate of inflation over the 20-year project life.
Table ES-1. First Year Operating Costs for a Minnesota-Style “Flip” Structure
1.5 MW 10.5 MW
($/year) ($/kW-yr) ($/year) ($/kW-yr) Operations & Maintenance (O&M) $15,000 $10 $105,000 $10 Warranty/Equip. Repair and Replacement Fund $27,000 $18 $189,000 $18
Management/Administrative $5,000 $3 $26,250 $3 Property Taxes $21,306 $14 $138,053 $13 Land Lease $4,000 $3 $28,000 $3 Equipment Insurance $14,000 $9 $93,100 $9 Miscellaneous $1,000 $1 $6,300 $1 Project Total $87,306 $58 $585,703 $56
In addition to capital and operating costs, other base-case modeling assumptions include: • All projects operate at a 33% net capacity factor.
• The federal production tax credit (PTC) and renewable energy production incentive (REPI), both of which expired in 2003, are re-instated (we conduct sensitivity analysis on this assumption).
• The project is unsuccessful at securing a Section 9006 USDA grant, due to intense
nationwide competition among wind and other renewable energy projects for what is likely to be an uncertain (and perhaps under-funded) pool of grant money. We conduct sensitivity analysis on this assumption.
• Projects always take the Oregon Business Energy Tax Credit (BETC), despite the fact that it will trigger the PTC’s anti-double-dipping provisions and thereby reduce the value of the PTC. The BETC is a 35% investment tax credit taken either over a 5-year period, or alternatively paid out as a discounted (to 25.5%) lump sum cash payment from a wind projects (which can theoretically be much larger), but rather is merely intended to be of sufficient size to trigger the construction of a substation to interconnect to the higher voltage transmission system.
4
These aggregate installed costs were derived through a bottom-up approach, the results of which are presented in Table 7 of the full report. Total installed costs vary somewhat with ownership structure (those cited are for a Minnesota-style flip structure), as well as with the project’s debt/equity ratio (as the amount of debt will impact the size of the loan fee and debt service reserve fund).
5
We assume that property tax is assessed at a rate of 1.19% of total project costs in year one, and that the taxable basis of the project depreciates at 8% per year until reaching 20% of its original value in year 11, at which level it remains through year 20.
through” partner (who, in turn, takes the 35% 5-year credit). The pass-through option allows all projects – even those without Oregon tax liability – to take advantage of the BETC. • The project obtains 10-year debt financing from Oregon’s Energy Loan Program. This
program is unique in its ability to offer loans financed by either tax-exempt or taxable debt, regardless of the borrower’s tax status. Interest rates are either 4.5% or 5.5% for tax-exempt or taxable debt, respectively. Because we assume that tax-exempt financing will trigger the PTC’s anti-double-dipping provisions, only those projects that cannot otherwise utilize the PTC will take advantage of tax-exempt debt. The Energy Loan Program is also somewhat unique in its willingness to allow monetization of the PTC and BETC towards meeting the minimum required average annual debt service coverage ratio of 1.25. We run sensitivity analysis on the interest rate, as well as PTC/BETC monetization.
• Local investors require a 10% after-tax internal rate of return from the project, while corporate investors (if any) require a 15% after-tax internal rate of return.
• Marginal federal and state income tax rates are 35% and 6.6%, respectively, for corporate investors and 25% and 9%, respectively, for individual investors.
• The rate of inflation equals 2% per year.
• The rate of interest earned on the debt service reserve fund equals 2% per year.
• The output of the model – the project’s revenue requirement – does not escalate over time, and so can be thought of as a 20-year nominal levelized requirement.
• Community wind projects in Oregon incur no sales tax expense (Oregon does not have a sales tax).
To identify those structures that are likely to be most promising in Oregon, we look at (among other factors) the degree to which each project’s revenue requirement (to satisfy all equity return hurdles and lender constraints) is above or below the “market” or benchmark power price
accessible to that project. For projects that effectively displace purchased power (cooperatives, aggregate net metering, and on-site projects), we set as the benchmark power price the relevant Pacificorp tariff being displaced (including all applicable demand and standby charges). For projects that instead sell power to Pacificorp or PGE (multiple local owner, Minnesota-style flips, Wisconsin-style flips, and town-owned projects), we use as the benchmark a 20-year nominal levelized power price provided by the Energy Trust of Oregon that is intended to represent what such projects are likely to earn through a long-term power purchase agreement.6 This levelized price is $39.40/MWh for “distributed generation” projects that are interconnected to, and whose power is consumed within, the local distribution system (in our analysis, only the 1.5 MW projects), and $34.60/MWh for projects interconnected to, or whose power is delivered over, the high-voltage transmission system (in our analysis, only the 10.5 MW projects).
It is important to note that none of these benchmark power prices include a value for a project’s tradable renewable certificates (TRCs). Since the Energy Trust’s policy is to take title to a project’s TRCs in proportion to the percentage of that project’s above-market costs that it funds, most projects supported by the Energy Trust will retain few, if any, of their TRCs. As a result, the Energy Trust has requested that our analysis not consider the potential value of TRCs to a
6
To levelize the price streams provided by the Energy Trust, we discounted and amortized the first 20 years of each price stream (to correspond to the 20-year term of our model) using an 8% nominal discount rate. A discount rate of 10% would have resulted in levelized prices that are roughly 0.5¢/kWh lower than those used, while a discount rate of 6% would have resulted in levelized prices that are roughly 0.5¢/kWh higher than those used.
project, and instead treat TRCs as an incentive design issue, the details of which will be determined by the Energy Trust on a case-by-case basis.
Thus, in Tables ES-2 and ES-3, each project’s Revenue Requirement can be thought of as the 20-year levelized amount of revenue (on a $/MWh basis from some combination of power sales, TRC sales, and financial support from the USDA, Energy Trust, or some other source) required to satisfy all equity return hurdles and lender constraints. Each Benchmark Power Price should be thought of as the 20-year levelized amount of revenue available to the project from just power sales. For a project to be economically viable under our assumptions, any Revenue Shortfall (i.e., the positive difference, if any, between the Revenue Requirement and the Benchmark Power Price) must be made up through sales of TRCs and/or additional financial support (from the USDA, Energy Trust, etc.). While Revenue Shortfall is also denoted in 20-year levelized terms, it is important to note that the structure and timing of any incentive designed to close that shortfall could vary from year to year (or even within a year); we make no attempt in this report to identify the optimal incentive type or timing (e.g., up-front grant versus ongoing production incentive, etc.).
Tables ES-2 and ES-3 present our 1.5 MW and 10.5 MW base-case modeling results for each ownership structure (again, site projects are not included in Table ES-3, since a 10.5 MW on-site project is unlikely). As noted earlier, the competitiveness of each structure is a function not only of revenue requirements (where lower is better), but also the market price available to each structure (where higher is better). Thus, even though aggregate net metering has a relatively high revenue requirement, it is – at least in theory – the most competitive structure, because we assume that it is able to earn the full average residential retail rate of $71/MWh, which is $18.77/MWh higher than the revenue requirement of $52.23/MWh (for a 1.5 MW project). Of all the ownership structures presented, however, aggregate net metering faces perhaps the most – and most severe – obstacles to implementation. Chief among them is the fact that utilities are currently not required to offer aggregate net metering, and – barring regulatory intervention, which itself is unlikely – are not likely to move in that direction. Hence, this is a potentially interesting model, but perhaps too far removed from reality in the United States to warrant much attention from the Energy Trust at this time.
Both on-site models, whether owned by taxable businesses or tax-exempt entities such as
schools, have revenue requirements that are well above their respective benchmark power prices. This is due to a combination of unfavorable utility rate structures (e.g., the presence of demand and standby charges), generally low retail rates in the Pacific Northwest, and the taxability of power bill savings (if the owner is a taxable business). Even with an expansion of net metering to include projects as large as 1.5 MW, such projects are still not all that attractive. This, along with our sense that there are likely to be relatively few opportunities for on-site utility-scale wind development in Oregon (especially those connected to Pacific Power or PGE’s distribution system), suggests that the Energy Trust should focus its attention elsewhere.
Table ES-2. Base-Case Modeling Results Under Different Ownership Structures (1.5 MW Project) Aggregate Net Metering On-Site Taxable On-Site Tax-Exempt Multiple Local Owner MN-Style Flip WI-Style Flip Town- Owned ASSUMPTIONS1
Form of BETC 5-Year 5-Year Lump 5-Year Lump Lump Lump
PTC No No No Yes Yes Yes No
Energy Loan Program 10-Yr Debt Interest Rate 4.5% 4.5% 4.5% 5.5% 5.5% 5.5% 4.5%
Local 10-Yr Debt Interest Rate NA NA NA NA NA 7.0% NA
Corporate Contribution to Equity 0% 0% 0% 0% 99% 100% 0%
Local Contribution to Equity 100% 100% 100% 100% 1% 0%2 100%
Landowner-Owned? No Yes Yes No Yes No Yes
% of REPI/Tradable PTC Captured NA NA NA NA NA NA 50%
Taxable Power Bill Savings (nominal $/MWh) NA $33.59 NA NA NA NA NA
RESULTS
Financing (2004 $)
Corporate Equity $0 $0 $0 $0 $421,900 $402,509 $0
Local Equity $1,012,941 $562,870 $529,688 $1,062,308 $4,262 $02 $452,026 Energy Loan Program 10-Yr Debt $865,687 $1,308,294 $859,261 $815,133 $998,860 $885,186 $967,530
Local 10-Yr Debt $0 $0 $0 $0 $0 $136,061 $0
BETC Pass-Through $0 $0 $448,902 $0 $456,552 $459,102 $456,552 Total Project Cost $1,878,628 $1,871,165 $1,837,851 $1,877,440 $1,881,574 $1,882,858 $1,876,108 Minimum Local Investment $675 $562,870 $529,688 $5,000 $4,262 $5,000 $452,026
Number of Shares 1,500 NA NA 212 NA 27 NA
Project Economics (nominal $/MWh)
Revenue Requirement $52.23 $64.81 $46.94 $38.58 $44.28 $41.18 $40.03
Benchmark Power Price $71.00 $33.59 $33.59 $39.40 $39.40 $39.40 $39.40
Revenue Shortfall (Surplus) ($18.77) $31.22 $13.35 ($0.82) $4.88 $1.78 $0.63
After-Tax Internal Rate of Return
Corporate IRR NA NA NA NA 15% 15% NA
Local IRR 10% 10% 10% 10% 87% 10% 10%
1
Additional assumptions that do not vary by ownership structure are not included in the table, but include: all projects count the BETC and/or PTC towards the Energy Loan Program’s required annual average debt service coverage ratio of 1.25, the BETC (both as a 5-year credit and a pass-through payment) triggers a PTC haircut, the BETC pass-through payment is considered taxable income, all tax-motivated corporate equity investors require an after-tax internal rate of return of 15%, all local investors require an after-tax internal rate of return of 10%, and the revenue requirements and benchmark power prices shown are fixed for 20 years and do not escalate.
2
Table ES-3. Base-Case Modeling Results Under Different Ownership Structures (10.5 MW Project) Aggregate Net Metering Multiple Local Owner MN-Style Flip WI-Style Flip Town- Owned ASSUMPTIONS1
Form of BETC 5-Year 5-Year Lump Lump Lump
PTC No Yes Yes Yes No
Energy Loan Program 10-Yr Debt Interest Rate 4.5% 5.5% 5.5% 5.5% 4.5%
Local 10-Yr Debt Interest Rate NA NA NA 7.0% NA
Corporate Contribution to Equity 0% 0% 99% 100% 0%
Local Contribution to Equity 100% 100% 1% 0%2 100%
Landowner-Owned? No No Yes No Yes
% of REPI/Tradable PTC Captured NA NA NA NA 50%
Taxable Power Bill Savings (nominal $/MWh) NA NA NA NA NA
RESULTS
Financing (2004 $)
Corporate Equity $0 $0 $2,966,676 $2,850,013 $0 Local Equity $6,280,946 $6,599,579 $29,966 $02 $3,042,093 Energy Loan Program 10-Yr Debt $5,899,969 $5,575,089 $6,639,257 $5,899,358 $6,567,692
Local 10-Yr Debt $0 $0 $0 $900,050 $0
BETC Pass-Through $0 $0 $2,550,000 $2,550,000 $2,550,000 Total Project Cost $12,180,915 $12,174,668 $12,185,900 $12,199,421 $12,159,786 Minimum Local Investment $598 $5,000 $29,966 $5,000 $3,042,093
Number of Shares 10,500 1,320 NA 180 NA
Project Economics (nominal $/MWh)
Revenue Requirement $50.35 $35.85 $40.94 $37.82 $38.69
Benchmark Power Price $71.00 $34.60 $34.60 $34.60 $34.60 Revenue Shortfall (Surplus) ($20.65) $1.25 $6.34 $3.22 $4.09
After-Tax Internal Rate of Return
Corporate IRR NA NA 15% 15% NA
Local IRR 10% 10% 87% 10% 10%
1
Additional assumptions that do not vary by ownership structure are not included in the table, but include: all projects count the BETC and/or PTC towards the Energy Loan Program’s required annual average debt service coverage ratio of 1.25, the BETC (both as a 5-year credit and a pass-through payment) triggers a PTC haircut, the BETC pass-through payment is considered taxable income, all tax-motivated corporate equity investors require an after-tax internal rate of return of 15%, all local investors require an after-tax internal rate of return of 10%, and the revenue requirements and benchmark power prices shown are fixed for 20 years and do not escalate.
2
Among those community wind ownership structures that have actually been implemented in the United States (which is important, if only to demonstrate practicality), the multiple local owner model is most competitive, with revenue requirements that are slightly below the 1.5 MW benchmark power price, and slightly above the 10.5 MW benchmark power price (assuming 100% tax efficiency – i.e., local investors are able to use 100% of the PTC). This structure also has the advantage of relative simplicity, and in some sense is the “purest” community wind model, in that multiple local investors own the project without corporate assistance. What appear to be relatively stringent securities regulations in Oregon, however, may add additional expense to this ownership structure if securities registration cannot be avoided. Furthermore, without 100% tax efficiency, the economics of this structure deteriorate rather quickly to the point where flip structures make more sense (at around 65% PTC efficiency). Up to that point (and perhaps even beyond), however, the multiple local owner structure is certainly worthy of consideration by the Energy Trust (presuming additional support is necessary – our modeling results suggest that it may not be at high levels of tax efficiency, or with modest revenue from TRC sales).
Flip structures are also relatively attractive models, particularly if the local investors’ appetites for tax credits are low. The Wisconsin-style flip has a roughly $3/MWh advantage over the Minnesota-style flip, but has not yet been implemented in the United States, and may face scrutiny from the IRS regarding the pre-arranged sale of the project after ten years. More research is warranted on this issue. Minnesota-style flips, on the other hand, have several years’ worth of experience and operating history under their belts, and therefore are more of a known entity.
Assuming it can capture at least half the REPI, or alternatively at least half the value of a tradable PTC if implemented, the town-owned project selling power to a utility results in a revenue requirement that roughly matches the benchmark power price (at least for the 1.5 MW project – the 10.5 MW project is less competitive). Questions remain as to whether this
particular structure – which effectively involves a town getting into the power business – is even legal, however.
Finally, 10.5 MW projects are generally less competitive than their 1.5 MW counterparts, despite in all cases having lower revenue requirements (from capturing at least some economies of scale). This is a function of the 10.5 MW projects (which are assumed to require power delivery over the transmission system) having a 20-year nominal levelized benchmark power price that is $4.80/MWh lower than the 1.5 MW projects (which are considered to be distributed generators whose power is consumed locally). It also reflects a $10 million cap on costs eligible for the BETC: with the 10.5 MW projects costing more than $12 million, the BETC represents a lower proportion of total project costs than in the case of a 1.5 MW project that costs less than $10 million. Similarly, though not shown in Tables ES-2 or ES-3, USDA Section 9006 grants are limited to the greater of 25% of project costs or $500,000, which renders them far less useful to a 10.5 MW project than they are to a 1.5 MW project. Finally, Table ES-3 shows that the number of equity shares in 10.5 MW projects can be quite large, making it likely that such projects would need to undergo full securities registration, and thereby incur extra legal costs not reflected in our cost inputs. The cost of registration would make such projects even less
qualify for an exemption from securities registration.7 Given these considerations, the Energy Trust should not automatically assume that a 10.5 MW project will require less support than a 1.5 MW project; in fact, our modeling shows the reverse to be the case.
Conclusions
Experience with community wind power development in both Europe and the United States demonstrates that community wind is possible if the right combination of policies and conditions exist. Above all else, revenue certainty is paramount to attracting community wind investors. Thus, policies that provide stability (and profitability) to community wind in Oregon will be essential.8 If the past is any indication of the future, such policies are not likely to arise at the federal level; rather, specific state policies that differentially support community wind will be necessary to drive this form of development.
Along these lines, Oregon appears to be in a rather unique position. The state already has in place an aggressive Energy Loan Program and a valuable Business Energy Tax Credit, both of which are potentially (see below) accessible to each of the seven different community wind ownership structures examined in this report. The BETC in particular favors small over large projects, as eligible project costs against which the credit can be claimed are capped at $10 million.9 Furthermore, the Oregon Public Utilities Commission is currently considering a favorable expansion of PURPA contract terms, which, if implemented, could prove to be a critical keystone for the development of community wind in Oregon. Finally, the Energy Trust of Oregon has both the interest and means to support community wind power development, and has commissioned this report as a first step in thinking about how it might do so.
The modeling results presented in this report suggest that certain ownership structures are more likely than others to be successful in Oregon. Specifically, those structures that can capture the PTC (or REPI) by selling power to an unrelated party – i.e., the multiple local owner, Minnesota-and Wisconsin-style flip, and the town-owned structures – all appear to be more competitive and/or attractive than structures that depend upon selling power to investors (i.e., cooperative-owned, aggregate net metering, and on-site projects).10 Open questions remain regarding the viability, or even legality, of two of the more attractive structures, however – Wisconsin-style flips and town-owned projects. This leaves multiple local owner and Minnesota-style flip structures as proven models that are also fairly competitive; which of these two is more
competitive will depend in large part on the tax credit appetite of the local investors involved. Assuming local investors are able to use 100% of the PTC, the multiple local owner structure is more competitive; as overall PTC capture falls below 65%, however, the Minnesota-style flip structure becomes more competitive.
7
Of course, spreading the cost of registration over a greater amount of capacity (i.e., 10.5 MW instead of 1.5 MW) will mitigate this impact somewhat.
8
Such policies should also drive the development of a strong wind project construction and operations infrastructure to cost-effectively support such projects.
9
This is one reason why our results show that 1.5 MW, or even 10.5 MW, community wind projects may require less incremental support than one might otherwise think, based on the level of additional support recently sought by much larger wind projects: the BETC is worth proportionally less to projects that cost in excess of $10 million. 10
As shown in Tables ES-2 and ES-3, aggregate net metering actually appears to be the mostcompetitive structure. As noted, however, this particular structure likely faces perhaps the most significant barrier to implementation – strong utility opposition – and as such, should perhaps be discounted.
As with any modeling exercise, however, our results are only as good as our assumptions, and we note that several of our assumptions could – pending additional time, budget, and expertise – be refined with greater certainty. Since several of these assumptions are critical not only to our modeling results, but more importantly to the viability of those community wind projects that are already in development in Oregon, we recommend that among the Energy Trust’s first steps in developing a community wind program should be to resolve the following outstanding questions:
1) Will taxable loans from the Energy Loan Program trigger the PTC’s anti-double-dipping provisions? If so, then projects hoping to use the PTC will need to seek other sources of debt, most likely on less favorable terms (with respect to debt service coverage ratios, PTC/BETC monetization, and perhaps also interest rate).
2) Pending favorable resolution of the previous question, can the $20 million cap on the Energy Loan Program’s ability to issue “private use” (taxable) bonds be increased to ensure that there is sufficient loan capacity to support an Energy Trust community wind program?
3) Does the BETC (both as a 5-year credit and pass-through payment) trigger the PTC’s anti-double-dipping provisions?
4) Should the BETC pass-through payment be treated as taxable income, or as a reduction in depreciable basis (and if so, for Oregon purposes, Federal purposes, or both)?
5) Should Section 9006 USDA grants be treated as taxable income, or as a reduction in depreciable basis (and if so, for Oregon purposes, Federal purposes, or both)?
6) What requirements must be met to avoid having to register securities in Oregon? We provide a layman’s interpretation in the full report, but a more detailed opinion on this matter from a lawyer knowledgeable in Oregon securities law is warranted.
7) Are municipalities in Oregon permitted to own wind projects? If so, under what conditions may they use their bonding authority to issue tax-exempt municipal debt to finance a wind project?
8) Does the Wisconsin-style flip structure pass muster with the IRS?
9) What role will the Energy Trust allow TRC’s to play in providing an additional source of revenue to community wind projects?
Publicly resolving these specific questions will help reduce the transaction costs of developing a community wind project in Oregon. Furthermore, the answers to these questions could have major implications for both the relative and absolute competitiveness of various ownership structures, and therefore the amount of financial support the Energy Trust might ultimately need to provide. As such, we encourage the Energy Trust to pursue these questions, and to the extent that the correct answers to these questions are not consistent with our modeling assumptions, revise the model accordingly to reflect a more accurate picture of how community wind is likely to develop in Oregon.
More generally, a number of program design lessons arise from experience with community wind in both Europe and the United States, as well as our financial analysis of community wind in Oregon. Perhaps the most important of these is that community wind has thrived wherever there are long-term, stable policies that enable local investors to earn a reasonable rate of return while incurring minimal transaction costs. For example, feed-in tariffs in Denmark, Sweden, and
Germany have enabled community wind to dominate in those three countries. Closer to home, community wind in Minnesota – the only state in the US where community wind can be considered to be thriving – has developed primarily under what equates to a feed-in tariff with Xcel Energy. These lessons underscore the importance of the current PURPA proceeding in Oregon: if the proceeding does not result in a long-term standard offer power purchase
agreement (PPA) suitable for community wind, working independently with Pacific Power and PGE to negotiate such a tariff should become a high priority for the Energy Trust.11
Even with a long-term PPA, however, some sort of incremental state incentive may still be required to make community wind projects economically viable in Oregon. The question of whether, and if so how much, additional financial support (beyond the BETC and Energy Loan Program) is required can be addressed with financial modeling, as presented in this report. Under current Pacificorp tariffs, benchmark PPA prices provided by the Energy Trust, and our modeling assumptions, we find that on-site projects would require substantial incremental support, while several of the ownership structures that sell power to an unrelated party may not require much – if any – additional support.
Given the potentially limited need for ongoing, long-term financial support for some of these structures, the Energy Trust may wish to focus on supporting near-term projects that demonstrate replicable ownership models that can ultimately be applied at a scale sufficient to reduce
transaction costs, lead to infrastructure development, and minimize possible diseconomies of scale. In supporting this first wave of “groundbreaking” projects, the Energy Trust should recognize that such projects are perhaps likely to incur higher costs than the hypothetical projects modeled in this report.
Specific efforts targeted at building infrastructure to minimize transaction costs and bring community wind up to scale may also be warranted. For example, Wisconsin began by developing a community wind business plan, while Illinois funded a 3-year wind resource monitoring program targeted at sites suitable for community wind. Massachusetts has gone even farther by retaining a stable of consultants to provide developmental assistance, and a pool of “preferred partners” to reduce transaction costs during the construction phase. The Energy Trust should consider what types of infrastructure-building activities are appropriate (i.e., in addition to this report, as well as the anemometer loan program). At a minimum, the Energy Trust should continue to offer its anemometer loan program (and consider expanding its range to include areas outside of Pacific Power and PGE service territories), and should endeavor to answer the nine tax and legal questions listed above. More aggressive steps might include proactive efforts to reduce construction costs by, for example, attracting new local entrants into the crane business (which should reduce mobilization fees), perhaps through an Energy Trust guarantee of some minimal amount of business. Similarly, as an organization in tune with the evolving status and schedule of most wind projects in the Northwest (large and small), the Energy Trust may be in a unique position to help community wind projects to “piggyback” on top of larger commercial wind projects (even when not sited contiguously) in order to capitalize on lower turbine costs (i.e., through bulk purchases) or shared crane mobilization fees.
11
Since our financial modeling shows that even attractive on-site tariffs may not be sufficient to justify on-site wind in Oregon, working to establish reasonable on-site tariffs should be relegated to a second-tier priority.
Finally, a few other near-term activities should also be considered. Recognizing that the
availability of USDA grants may reduce the need for incremental financial support,12 the Energy Trust should work to connect potential projects to possible USDA funds, through workshops, referrals, or other forms of information dissemination. The Energy Trust may also wish to open a dialogue with rural electricity cooperatives (RECs) and Bonneville Power Administration (BPA) in the hopes of attaining reasonable wheeling tariffs for community wind projects located in REC service territories.13 And, given that several of the ownership structures modeled in this report can become significantly more or less attractive depending on possible changes to policies (particularly changes involving the PTC and REPI), the Energy Trust would be well-served to closely monitor the policy arena and be prepared to adapt its program to a changing policy environment.
12
Our modeling suggests that a USDA grant equal to $450,000, or 25% of the costs of a 1.5 MW project owned by
multiple local owners, reduces revenue requirements by about 0.5¢/kWh (and also reduces the amount of equity that must be raised to finance the project).
13
To be eligible for support from the Energy Trust, a community wind project that is located in the service territory of a REC must wheel its power – through BPA – to Pacificorp or PGE.
1. Introduction
The Northwestern United States is home to some very large, commercially developed wind projects. These projects can potentially capitalize on scale economies to lower the cost of wind-generated electricity, and can contribute to significant aggregate wind capacity additions. While such projects are likely to remain the predominant form of wind development in the Northwest, there has also been growing interest in wind projects of a smaller scale, yet still using modern utility-grade wind turbines – i.e., so called “community wind.” This report begins to evaluate the advantages, barriers, costs, and financing structures associated with community wind generally, and in Oregon specifically.
Definitions of community wind vary. For the purposes of this report, we define community wind power development to mean locally owned projects, consisting of one or more utility-scale turbines that are interconnected on either the customer or utility side of the meter.14 This relatively broad definition includes most – but not all – of the models that are in place in the United States today.15
Community wind power development of this scale has been purported to provide a number of benefits relative to the conventional commercial wind power development common in the U.S., as well as relative to small, on-site wind power projects. The list of potential benefits includes the following:
• Community wind projects tap into a latent and potentially lower-cost source of capital to fund utility-scale wind development.16
• With local investment dollars at stake, community wind projects may benefit from
increased community support (as the Danes say, “your own pigs don’t stink”), which might translate into a smoother permitting process, relative to commercially owned projects. • In some areas, interconnecting smaller projects to the distribution grid (embedded
generation) can provide distributed generation benefits (e.g., enhance grid stability). While such benefits vary by situation and are far from universal, widely dispersed wind
development (as opposed to sizable wind farms) should at least reduce the impact of wind resource variability, through geographic diversification.
• In instances where power from a community wind project is consumed on site, or is otherwise sold directly to investors in the project, the project owner should directly benefit from the price stability of wind power.
14
We define “locally-owned” to mean that one or more members of the local community have a significant direct financial stake in the project, other than through land lease payments, tax revenue, or other payments in lieu of taxes. For new projects, as will be the case in Oregon, we define “utility-scale” to mean projects consisting of one or more turbines of 600 kW (currently the smallest turbine size offered by the major wind turbine manufacturers) or greater in nameplate capacity. We recognize, however, that community wind projects in Europe and elsewhere have been around for many years, and that utility-scale wind turbine sizes have increased rapidly in recent years. For these older projects, we will not strictly adhere to the 600 kW threshold.
15
Note, however, that this definition excludes: (1) on-site, home-sized smaller wind turbines (including innovative uses of these systems, e.g., Our Wind Co-op in the Northwest), and (2) projects owned by public power utilities. 16
Community-based investors may settle for a lower return on equity than commercial investors would be willing to accept, thereby improving project economics
• Small community wind projects may be able to utilize existing infrastructure (e.g. roads, distribution lines, etc.), and if interconnected directly to the distribution grid may avoid the need to build a substation. These factors could offset some or all of any diseconomies of scale associated with smaller projects.
• Individual investors may be more tolerant than commercial investors of annual variability in revenues.
• Traditional commercial wind development is often “lumpy” on a year-to-year basis, and community wind may be able to fill some of the interim “valleys” that are all too common. • Small community wind projects could be an effective means of quickly proving out various
wind resource areas for later expansion through larger projects.
• Community wind projects may enhance local economic development benefits relative to other forms of wind power development, due to the participation of local investors, and perhaps greater use of local contractors.
• Relative to small, home-sized wind turbines (e.g., 10 kW or less) in which local investors might otherwise invest, utility-scale turbines are more cost-effective on a per-kWh basis, which should generally translate into greater return for each dollar invested.
We note that some of the purported advantages and disadvantages of community wind development – relative to the commercial model – are uncontroversial, while others have
generated debate. It is not the purpose of this report to resolve this debate or to address, in detail, the philosophical or practical advantages of one wind development model relative to another. As such, other than briefly noting them here for contextual reasons, this report will not specifically investigate the purported benefits of community wind listed above.17 Later in this report, however, a chapter on barriers to community wind power development will address several potential disadvantages of community wind development relative to the standard commercial model, such as potentially poor economies of scale and high transaction costs.
This report has been motivated and funded by the Energy Trust of Oregon (Energy Trust). The Energy Trust is a relatively new, nonprofit organization created to invest “public purpose” funding for energy efficiency and renewable energy in Oregon over at least the next 10 years. This mandate emerged from energy reform legislation (Senate Bill 1149) passed in 1999, which included a 3% system-benefits charge to apply to Portland General Electric and Pacific Power ratepayers in the state. With an annual budget of approximately $45-50 million – about $10 million of which is dedicated to renewable energy – the Energy Trust is expected to have a sizable impact on the energy future of the state.
The Energy Trust has developed a number of programs to support renewable energy, including programs for on-site photovoltaics and larger-scale renewable energy development. The Energy Trust is now exploring opportunities to support community-scale and small-scale wind
17
We note, however, that a companion report is being prepared by ECONorthwest, in conjunction with NWSEED and with funding from the Energy Trust of Oregon, the Washington Department of Community, Trade, and Economic Development, and A World Institute for a Sustainable Humanity (AWISH), to investigate the economic development benefits of community wind power in the Pacific Northwest. Another report currently underway, funded by NREL and prepared by the Renewable Energy Policy Project (REPP), will compare the local benefits of community and “commercial” wind power development in a generic setting. We refer readers interested in the local economic development benefits of community wind to these two reports.
development. In initiating this report, the Energy Trust’s goals are to gain a better understanding of the likely ownership structures that will be used for community wind projects in the
Northwest, to explore the barriers, opportunities, and costs associated with community wind, and ultimately to better understand the types and levels of financial and non-financial support that may be required to make such projects viable.
The report proceeds by first briefly describing experience with community wind in Europe (Chapter 2), and then contrasting that with experience in the US (Chapter 3). Chapter 4 goes on to explore a number of barriers to community wind development in the US, and in the Pacific Northwest in particular. In Chapter 5, we develop a standardized set of cost inputs, assumptions, and parameters that are applied in modeling the economics of several different community wind ownership structures. Chapter 6 describes the various structures analyzed and presents results from the modeling exercise. Chapter 7 offers some final conclusions from our analysis.
2. Community Wind in Europe
Europe is the birthplace of community wind power development, which began in Denmark in the 1970s. This chapter provides brief context on the development of community wind in Europe, the unique factors that have driven this particular form of wind development, and what lessons have been learned that might be applicable to community wind in the United States.
2.1 History and Current Status
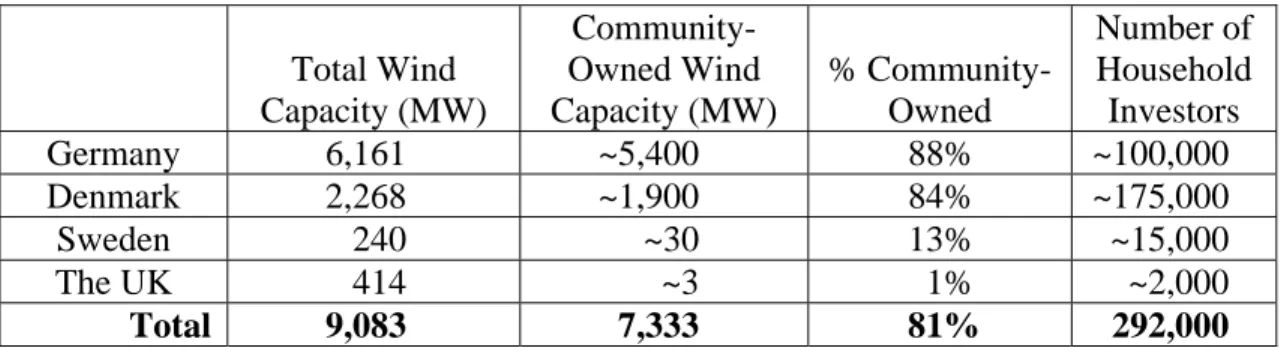
In early 2004, nearly three-quarters of the world’s installed wind power capacity resided in Europe. One reason that wind power has flourished in Europe, particularly relative to other industrialized regions, is community participation in, and resulting acceptance of, wind power development. Table 1, adapted from Bolinger (2001), shows that at the end of the year 2000, roughly 80% of all wind power capacity in four northern European countries – Germany, Denmark, Sweden, and the United Kingdom – could be considered community-owned. Given that these four countries hosted roughly half of the world’s installed wind power capacity at that time, community-owned projects accounted for at least 40% of world wind power development at the end of 2000. Thus, despite its quaint-sounding name, community wind has historically been responsible for large amounts of installed wind power capacity.
Table 1. Community Wind Power Development in Select European Countries (2000)
Total Wind Capacity (MW) Community- Owned Wind Capacity (MW) % Community- Owned Number of Household Investors Germany 6,161 ~5,400 88% ~100,000 Denmark 2,268 ~1,900 84% ~175,000 Sweden 240 ~30 13% ~15,000 The UK 414 ~3 1% ~2,000 Total 9,083 7,333 81% 292,000
In the years since 2000, community wind has lost some ground in both Denmark and Sweden, as both countries have transitioned away from a support system based on feed-in tariffs to a more “market-based” support system.18 The uncertainty surrounding this transition has contributed to a slower pace of onshore wind development in both countries. In contrast to Denmark and Sweden, community wind power in Germany continues to thrive, as that country – with ongoing feed-in tariffs – has more than doubled its installed wind capacity since 2000. In fact, demand among German “wind funds” for projects in which to invest is so strong that at least one early-stage 240 MW offshore wind project – a relatively risky endeavor – is being financed by a community wind fund. Community wind has also advanced somewhat in the UK, as the once-local Baywind Energy Cooperative continues to expand its presence throughout the British Isles, in part by teaming up with large wind developers to parcel off small portions of larger projects for community investment.
18
A “feed-in tariff” is a premium price that a utility must pay to any wind projects that delivers (i.e., “feeds in”) power to it over the grid. For more information, see Section 2.3 below.
2.2 European Ownership Structures
Of interest and particular relevance to this report, the community wind capacity in Table 1 has been developed under at least four different ownership structures, varying by country in response to local laws, customs, conditions, and policy support systems.
For example, the famous Danish wind “cooperatives” are technically not cooperatives at all, but rather general partnerships.19 While cooperatives are used extensively in Denmark for other endeavors (and are even widely used in the energy sector with combined heat and power), Danish electricity law has historically required that wind turbines be directly owned by electricity consumers. A partnership, which is understood to be a contractual relationship between several entities (i.e., electricity consumers) to pool certain resources in order to run a business, has historically been the only joint form of ownership to qualify under Danish power law (Bolinger 2001).
In Sweden, meanwhile, community ownership schemes have generally fallen into one of two models: real estate communes and consumer cooperatives. The real estate commune is based on the traditions of common law and communal ownership of physical resources, such as fishing or grazing rights, which were often attached to land titles (e.g., one must own land along a stream or in a village in order to fish in that stream or pasture livestock in the village field). Somewhat unique to Sweden, this common law tradition has evolved into a modern vehicle for communal ownership of public facilities such as parking lots, playgrounds, and now wind turbines. The other common ownership structure used for community wind projects in Sweden – the consumer cooperative – is more familiar to US citizens, and has been successful in Sweden largely due to utility cooperation in enabling cooperative members to “patronize” the wind turbine(s) (Bolinger 2001).20
Community wind projects in Germany are most often owned by limited partnerships, with a developer’s limited liability company serving as general partner (GmbH & Co. KG). In this tax-advantaged structure, a wind developer initially incorporates his business as a limited liability company (GmbH). For each project undertaken, the developer forms a limited partnership (KG) with his limited liability company as general partner and individual investors as limited partners. Project revenues are distributed proportionate to the level of each partner’s investment.
The UK does not have a specific cooperative law, which means that it is possible to structure almost any legal form of business along cooperative principles. While there are potentially as many as six legal structures suitable for community wind ownership in the UK, a legal structure known as an industrial and provident society (IPS), which is appropriate for organizations pursuing both economic as well as social goals, has so far dominated. An IPS will generally be
19
A cooperative is “a business owned and democratically controlled by the people who use its services and whose benefits are derived and distributed equitably on the basis of use” (Frederick 1997). A general partnership is a business structure in which two or more partners jointly own, control, and operate a business. Each partner is “jointly and severally” liable for all debts incurred by the partnership, and any income generated by the partnership is taxed at the level of the individual partners.
20
The cooperative structure relies on a system of patronage, whereby each cooperative member benefits in
proportion to how much he or she uses – or patronizes – the cooperative. For a wind power cooperative to function, members must be able to patronize the wind turbine.
organized according to cooperative principles, such as open membership, one member one vote, and distribution of profits (e.g., the Baywind Energy Cooperative is structured as an IPS). Because an IPS is not technically by law a cooperative, however, there is considerable room for flexibility in operations. For example, an IPS need not abide by the strict cooperative practice of basing dividends on the degree of patronage (see Section 6.1.2 for more on this), but rather may pay dividends according to the level of investment. An IPS also has the unrestricted ability to advertise shares to the public (Bolinger 2001).
2.3 European Drivers of Community Wind
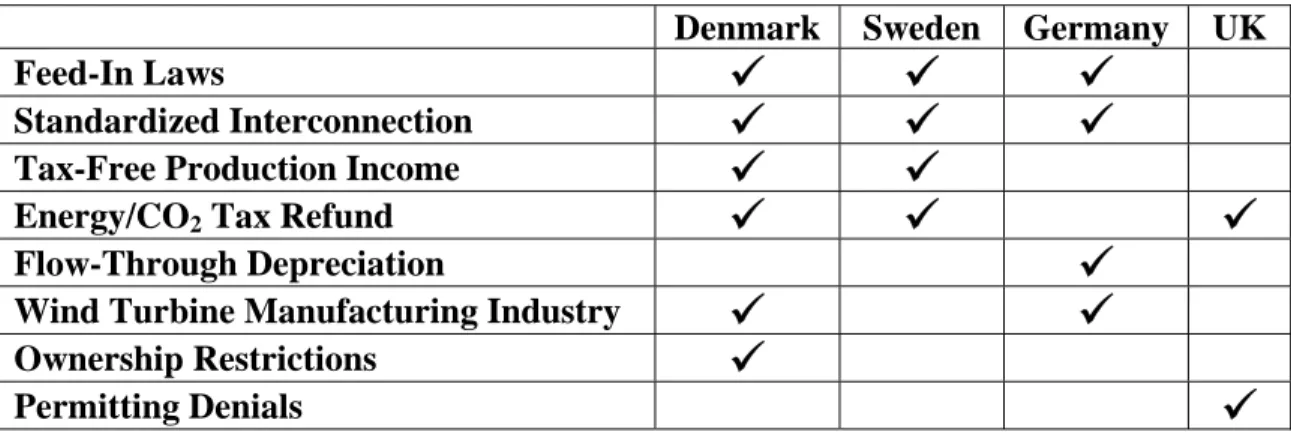
Community wind power development in Europe has been driven by a number of factors, as shown in Table 2, and described below.
Feed-in laws that require utilities to purchase wind power at premium prices have created accessible, stable, and profitable markets for community wind projects in Denmark and Sweden (historically), as well as Germany (to this day). Such laws provide long-term revenue certainty with relatively little associated transaction costs. The importance of feed-in laws to community wind can be seen in both Denmark and Sweden, where new community wind development has in recent years effectively come to a halt as both countries transitioned away from feed-in tariffs towards more market-based (i.e., uncertain) support systems.
Standardized interconnection rules and procedures in Denmark, Sweden, and Germany remove the uncertainty over who pays for interconnection and any necessary transmission upgrades. Furthermore, the presence of a relatively strong, three-phase electrical grid throughout much of Europe facilitates the interconnection of distributed, utility-scale wind projects by minimizing power quality impacts and the need for costly transmission upgrades (Cohen and Wind, 2001).
Favorable tax treatment for wind power enhances its appeal as an investment. In Denmark and Sweden, for example, community wind investors are typically not taxed on income generated by wind projects, up to certain limits. Furthermore, several European countries tax energy consumption and CO2 emissions, and in some cases wind project owners receive a refund on these taxes. Finally, up until recently, German tax law allowed depreciation and other losses from investments in wind projects to offset taxes on ordinary (e.g., wage) income, thereby making community wind investments a popular tax shelter among wealthy Germans.
Table 2. Historical Drivers of Community Wind Power Development
Denmark Sweden Germany UK
Feed-In Laws
9
9
9
Standardized Interconnection
9
9
9
Tax-Free Production Income
9
9
Energy/CO2 Tax Refund
9
9
9
Flow-Through Depreciation
9
Wind Turbine Manufacturing Industry
9
9
Ownership Restrictions
9
The presence of a strong domestic wind turbine manufacturing industry has been an important driver in Denmark, where, in the 1980s and 1990s, turbine manufacturers sent sales representatives out into the countryside to organize and facilitate community wind projects, with the ultimate objective of consummating turbine sales. Through this sales strategy, Danish wind turbine manufacturers co-evolved with the market for their product. In other words, by steadily filling orders for just a few turbines at a time, as opposed to hundreds or thousands of turbines destined for large wind farms, Danish turbine manufacturers were able to test new products and discover and solve technical problems prior to mass production (van Est 1999).
In Denmark, government-imposed ownership restrictions have historically required that wind projects be owned by the local community, based on the notion that those who benefit from feed-in laws should also bear the visual and aural burden of livfeed-ing near the wfeed-ind turbfeed-ine. Over the years, as the market for “local” community wind projects has become increasingly saturated, Denmark has gradually relaxed its ownership restrictions, to the point where anyone in the European Union can now invest in a Danish wind project.
Finally, while the United Kingdom lacks most of the drivers historically present in Denmark, Sweden, and Germany, there has nevertheless been a concerted push towards community wind power development in the UK, in part as a result of the rash of permitting denials for larger commercial projects that swept the countryside a few years ago. Giving the local community a financial stake in the success of a project is one way to bolster community support for that project.
2.4 Lessons Learned
Community wind is neither “quaint” (e.g., see Table 1) nor part of a bygone era (e.g., see
ongoing development in Germany and the UK), but conditions in Europe are unique, and will be difficult to replicate elsewhere, particularly in the United States. In fact, on a national level, the United States has few of the drivers that have historically supported community wind in Europe (listed in Table 2). That said, there are a number of lessons learned in Europe that might be applicable to the US in general, and the Pacific Northwest in particular.
First, revenue certainty is paramount to attracting community investors. Experience in Denmark and Sweden (where new community wind power development has largely ground to a halt following the demise of feed-in tariffs), as well as Germany (where community wind continues to thrive amidst renewed feed-in tariffs) suggest that stable, long-term feed-in tariffs are superior to a more market-based support system such as renewable portfolio standards (RPS) in providing sufficient revenue stability to enable community investment. While such feed-in tariffs may be unlikely to be directly replicated in the US, policy structures that provide stability and
profitability to community wind will be essential.
Second, experience in Europe shows that a strong wind turbine operations and support
infrastructure is necessary to facilitate community wind cost-effectively. As such, community wind projects are likely to be most cost-effective when deployed in significant quantities (thereby directly supporting the development of a support infrastructure), and in areas where a
wind turbine support infrastructure already exists (due, for example, to large wind development activities in the region). The latter condition potentially exists in Oregon.
Third, the taxation of carbon emissions and energy consumption in some European countries provides policymakers with additional options when designing financial support systems for renewable energy. These options – such as refunding those taxes to wind projects – are not open to countries without these taxes, such as the United States. However, the U.S. federal
government – and individual states – do have available to them a basket of other