COST-EFFECTIVENESS OF
ACCELERATED STUDY IN
ASSOCIATE PROGRAMS (ASAP)
OF THE CITY UNIVERSITY OF
NEW YORK (CUNY)
Henry M. Levin and Emma Garcia
with assistance from
James Morgan
September 2012
CENTER FOR BENEFIT-COST STUDIES IN EDUCATION, TEACHERS COLLEGE, COLUMBIA UNIVERSITY
Acknowledgments
The authors wish to extend thanks to the following individuals for their assistance in the development of the study and preparation of this report: Donna Linderman, CUNY ASAP University Executive Director; Colin Chellman, CUNY Associate Dean for Institutional Research; Zineta Kolenovic, CUNY ASAP Assistant Director for Evaluation and Research; Daniela Boykin, CUNY ASAP Assistant Director; and Simon McDonnell, CUNY Senior Policy Analyst.
Special thanks to the New York City Center for Economic Opportunity (CEO) for their support of this study.
About The Center for Benefit-Cost Studies of Education (CBCSE),
Teachers College, Columbia University
The Center for Benefit-Cost Studies of Education (CBCSE) conducts research on the benefits and costs of alternative educational policies and interventions.
Education is a social investment that entails both costs and outcomes.
Too often assessments of educational alternatives either ignore their costs or calculate them in inappropriate ways. Similarly, benefits of education are often viewed too narrowly or measured inappropriately.
The CBCSE brings together scholarship on both benefits and costs so that the full value of investments in education can be evaluated, and the most productive use of resources can be chosen.
The Center also undertakes cost-effectiveness studies to ascertain the types of educational interventions that will produce educational outcomes at least cost.
ABSTRACT
Although community colleges enroll almost half of the students engaged in post-secondary education, they have poor success in student completion of degrees. Nationally it appears that less than a quarter of community college students obtain the two-year associate degree, and the success rate is even lower in urban community colleges. In response, the City University of New York (CUNY) evaluated the obstacles to degree completion and responded by establishing the Accelerated Study in Associate Programs (ASAP). ASAP attempts to assist students in overcoming financial, academic, and scheduling difficulties that undermine degree attainment.
An early evaluation of ASAP students over three years found that in comparison with a matched group of students in six community colleges of CUNY, the graduation rates doubled from about a quarter of students completing to more than half. But ASAP does require additional financial resources. The purpose of this study was to undertake a cost-effectiveness analysis to see if the additional costs were compensated by a higher graduation rate sufficient to justify those costs. The cost of producing an additional graduate in the comparison group without ASAP was compared with the cost when ASAP was provided.
The conclusion is that ASAP is so much more effective in producing additional graduates in a timely fashion and that the cost per graduate for ASAP is comparable to or less than that of the traditional approach. ASAP can increase considerably the number of CUNY community college graduates while actually reducing costs.
INTRODUCTION
In the golden age of U.S. education in the 1960‟s, the nation was first in the world in the proportion of students both completing high school and attaining degrees from colleges and universities. By 2009 the U.S. had fallen to 21st in terms of high school completion and 16th in college completion among the industrialized countries of the OECD (Organization for Economic Cooperation and Development 2011: Chart A2.1 and Chart A3.1). The failure to complete studies at both levels has become so dire that in the absence of dramatic improvements in high school completion and college graduation, the absolute level of educational attainment of the labor force will decline in the next decade (Bailey 2007). Retirees will be replaced by labor market entrants with lower educational attainments than those leaving the labor force. The urgency of increasing high school and college completion rates cannot be overstated if we expect to have a capable and adaptable labor force that can compete effectively with those of other nations.
Much of the challenge is due to the fact that the demography of the population has changed. Rapid shifts in the U.S. population created by immigration and rising poverty have meant that the school population is now more heavily comprised of groups that face serious educational challenges. This has meant that in the absence of change, future labor force entrants with less educational attainment could potentially replace those with more education leaving the labor force, resulting in a decline in the overall quality of the labor force. Such deterioration will have negative consequences for U.S. productivity and international competitiveness among nations whose labor forces are experiencing growth in educational attainments, rather than stagnation or decline.
Impending decline in the overall education of the labor force is heavily concentrated in those populations that are increasing most rapidly: minorities, immigrants, and the poor. Students from these groups will continue to fare poorly both in educational attainments and their economic consequences without a dramatic improvement in the institutions responsible for their educational performances. Accordingly, the educational agenda must be one that sets priorities not only for increasing the educational attainments of the young and the future labor force generally, but with special attention to students from origins that have not fared well previously in the educational system.
The first port of entry into postsecondary education for such students is often through the community college, an institution that enrolled about eight million students in the fall of 2011, or about half of all college students. A major challenge of the community colleges has been to increase the success rate of students in completing associate degrees in a timely manner (Schneider & Yin 2012). According to the U.S. Department of Education, only about 22 percent of students who enroll in community
colleges complete the associate degree three years later (Snider & Dillow 2011) and at urban community colleges the percentage is lower. The CUNY Office of Institutional Research and Assessment (OIRA) analysis of data from the National Center for Education Statistics‟ Integrated Postsecondary Education Data System (IPEDS) reveals that nationally only 16 percent of urban community college students graduate within three years.
Significant obstacles to graduation include the lack of financial resources, inadequate educational preparation, language hurdles, and family and work responsibilities. In addition, many such students are first-generation entrants to post-secondary education without exposure to the study and coping skills required for success in college (Karp & Bork 2012). All of these challenges confront students at most of the community colleges in the nation, and especially those in urban areas.
The low completion rates for community college students have precipitated a search for strategies to increase community college degree receipt within a reasonable time period. Students who fail to obtain degrees represent a loss of both human resources and the public and private investments devoted to their college educations. In response, the City University of New York and the New York Center for Economic Opportunity established Accelerated Study in Associate Programs (ASAP) in 2007 to increase graduation rates in a timely fashion (Linderman & Kolenovic 2012). ASAP has shown that a well-designed and implemented approach to advance community college student progress can produce sharply higher completion rates for the associate degree within three years of study (Linderman & Kolenovic 2009:1-2)
PURPOSE OF THIS REPORT
The purpose of this report is to provide an initial cost-effectiveness assessment of ASAP. ASAP requires additional resources beyond those normally allotted to community college educational operations to obtain its superior results. A cost-effectiveness analysis is designed to evaluate the payoff to the use of such resources. More specifically, we wish to ask the question of whether the higher costs associated with ASAP are compensated or more than compensated for by an improvement in timely completions. Cost analysis has become an important part of evidence-based decision-making in education where we want our resources to be used in the most efficient way possible (Baker & Welner 2012). Instead of just knowing the effectiveness of a promising intervention, we need to understand its costs for comparison with the costs and effectiveness of alternatives. It is also important to note that additional graduates not only improve the quality of the labor force, but provide other investment returns to the
taxpayer in the form of higher tax revenues and lower cost for social services including public health, criminal justice, and public assistance (Belfield and Levin 2007).
In what follows, we will provide a brief description of ASAP and the resources needed to support the program. The budgetary costs of these resources will be evaluated to ascertain the costs of accelerating completion of additional associate degrees within a three-year time horizon. This cost per acceleratedassociate degree will be compared with the cost for producing an associate degree in a traditional program. Essentially this assessment will ask whether the additional costs are justified by the potential quantifiable gains.
ASAP
A predominant goal for the community college is not only to produce more graduates with associate degrees, but to do this in a timely manner. An emphasis on accelerating community college progress has already become a major theme in preparing students with academic deficiencies for entering regular courses through more rapid completion of developmental education (Edgecombe 2011). In principle, it is possible for a full-time student who satisfies preliminary basic skill criteria to complete all of their degree requirements within two years. But in many cases students may face scheduling problems, financial difficulties, and other challenges that interfere with timely
completion. ASAP was designed to overcome these obstacles by first determining what types of contingencies interfered with timely completion of the associate degree and then providing supports to overcome these difficulties. Some of these obstacles are the uneven scheduling of courses, the need for academic assistance and advisement support, financial barriers, and personal responsibilities that interfere with academic study and timely completion.
The goal of ASAP is to graduate at least “…50 percent of students within three years through provision of comprehensive support services and financial resources that remove barriers to full-time study, build student resiliency, and support degree completion (Linderman & Kolenovic 2012: 9).” When ASAP began in 2007, the three-year CUNY community college graduation rate was 24.7 percent for fully skills- proficient students (CUNY Office of Institutional Research and Assessment). ASAP has been implemented at all six of CUNY‟s community colleges: Borough of Manhattan (BMCC in the tables), Bronx, Hostos, Kingsborough, LaGuardia, and Queensborough1 and uses a common and comprehensive design to overcome the obstacles to timely degree completion. To counter these obstacles, the program enlists a variety of interconnected supports (Linderman & Kolenovic 2012:10-11):
1 CUNY opened a seventh community college, the New Community College (NCC), in fall 2012. NCC
1. Financial Incentives: Any gap betweena student‟s financial aid award and tuition and fees is waived, and all students receive free monthly transit Metrocards and free use of textbooks.
2. Consolidated Full-time Schedule: Classes are clustered into a consolidated schedule (either morning or afternoon) to help balance school, work, and domestic responsibilities, and students are required take at least 12 units a semester.
3. Cohort and Faculty Support: Students are grouped with ASAP students by major; in their first year, they take several “blocked” classes with fellow ASAP students that are capped at 25 students.
4. Regular Advisement: ASAP students meet with advisors at least twice a month for provision of academic, social, and interpersonal support. Students also participate in a weekly seminar for two semesters.
5. Career Preparation: ASAP career and employment specialists meet with students for career assessment, discussion of job skill requirements, career planning, and interview preparation. They also support students with any immediate job placement needs.
6. Extra Academic Assistance: Tutoring is provided for struggling students.
Careful assessment of ASAP has provided evidence of its early promise with over half of its initial cohort of 1,132 students who started community college in the fall of 2007 having earned the associate degree three years later, in comparison with only about a quarter of a matched comparison group of students who did not benefit from inclusion in ASAP. These evaluations were accomplished by matching students in ASAP with a statistically similar group in terms of demography, academic major and educational preparedness. Other evaluations are also underway using different methodologies—for example, an experimental study using random assignment to ASAP, being led by MDRC.2
Although ASAP has shown positive results on increasing the completion of associate degrees, it also has costs associated with the added services. In the next section we will examine whether the higher costs are compensated for by superior outcomes, the focus of cost-effectiveness analysis.
2 A preliminary report from MDRC on the ASAP random assignment study can be found at:
COST AND COST-EFFECTIVENESS
Cost-effectiveness analysis entails a comparison between two or more alternatives designed to achieve particular objectives. Each may require different resources and produce different results. The cost-effectiveness comparison is designed to understand which alternative provides the best outcome for any particular level of cost or which provides the lowest cost for any particular outcome. The existing community college approach augmented by ASAP services has both a higher cost per student and a superior outcome in terms of associate degree completions. The central question that we will address in the cost-effectiveness analysis is whether the additional resources required for ASAP are compensated by a sufficient improvement in degree completion; i.e., is the cost per completion of the ASAP program lower than that for the traditional program without ASAP? Note that the outcome we are seeking is not a lower cost per student, but a lower cost per student result as measured by associate degree completions.
Normally cost-effectiveness analysis proceeds by identifying resources or ingredients required for a specific alternative. These ingredients are described in terms of both the quantity and the quality of the resources. Adjusting for quality is a central goal in addressing costs. For example, an educational intervention may specify a need for advisors. But experienced advisors who have had success in guiding community college students and possess the training to address the needs of this audience may be quite different in terms of their costs and effectiveness relative to newly-hired counselors without these experiences.
Establishing the specific resource requirements in reasonable detail is the first step in cost analysis. A second step is to ascertain the costs of acquiring these resources in order to replicate the program. Note that even contributed or in-kind resources have a cost and are included in the analysis. They are distinguished only in terms of who pays for them, and though financed differently than those that are purchased directly by the program, they are included in the underlying cost of the intervention. Details for undertaking a cost-effectiveness analysis can be found in Levin and McEwan (2001).
The method of cost analysis requires a specification of the program and the ingredients or resources required for replication. These are translated into the market costs for such ingredients (e.g., salaries and benefits for personnel for a particular role). Costs of all ingredients are aggregated to obtain a total cost, and these can be analyzed for the average cost per student or per successful student or some other measure of effectiveness.
By compiling an accurate list of ingredients required for replication, it is possible to identify both the sources and the measurement of costs that can also be used to
extrapolate costs into the future, accounting for future changes in price levels and economies of scale. Economies of scale refer to a measure of how the cost per outcome may change as the scale or size of the endeavor increases. Most productive activities incorporate fixed resources or ingredients such as a central administrative capacity or installed technology (such as wi-fi) and variable ones, such as instructional personnel, that must be increased in response to program enrollments. Ingredients with fixed costs over a large range of enrollments mean that as enrollments rise, these costs are divided over more enrollees, reducing the cost per enrollee and per successful enrollee. These can be contrasted at different levels of enrollment with those resource ingredients which have variable costs and which must increase with enrollments. Between the two types of ingredients, fixed and variable, it is possible to assess economies of scale in projecting enrollment costs. Ultimately this must be done for each of the community colleges since they vary considerably in enrollment capacities.
COST COMPARISONS
In order to use the ingredients method to measure the cost of an intervention such as ASAP, one usually enlists a program at a single site where all of the resources can be identified and specified in detail. However, when there are multiple sites, it is either necessary to analyze the implementation at each site or gain assurance that the application at each site is identical. The latter is usually possible only when a central authority carries out the implementation.
In the case of ASAP‟s six community college sites—Borough of Manhattan, Bronx, Hostos, Kingsborough, LaGuardia, and Queensborough--each institution implemented its program following the design principles, policies, guidelines and coordination established by ASAP staff at the CUNY Office of Academic Affairs (CUNY Central). Although the program and most ingredients are broadly similar among the campuses, they are not identical. For example, some of the campuses have drawn upon more experienced personnel than others. As we have found in other cost studies of similar programs, actual implementation and costs often differ from site to site depending upon the specific organizational features of the site (Levin, Catlin, & Elson 2007). In the event where the program is designed and coordinated from a central site as is the case with ASAP, there is likely to be greater similarity in implementation, but site idiosyncrasies can still be found. This is also true in terms of the scale of the program at each community college and the percentage of enrollments participating in ASAP.3
3
Consider just the difference in enrollments at the different colleges, which vary from about 5,000 FTE at Hostos to almost 20,000 at BMCC. Such differences in enrollment magnitudes require specific analysis for institutional capacities and economies of scale by college because most of the resource utilization is based at the individual colleges.
For this reason we have used the combined ASAP expenditures from CUNY Central and the six community colleges to provide an overall picture of the costs of both the normal production of associate degrees and the costs for those in ASAP. Since the numbers of students in ASAP at each of the six institutions differs significantly, the costs are weighted according to institutional representation in the overall sample, rather than simply obtaining an average among the institutions. ASAP cost data were provided by the ASAP University Director, who oversees allocations to community colleges for ASAP expenditures. Annual costs for all CUNY community college students (FTEs) were provided by the CUNY University Budget Office.
There were a number of criteria that had to be met for comparability in the collection and analysis of these data.
1. The cohorts for comparison had to be selected with a similar or nearly similar time window to assess their costs and effectiveness.
2. The academic majors of students in the two groups had to be broadly similar. 3. Developmental education costs would not be included for either group, as any
basic skills needs were addressed prior to the period of this analysis.4
TIME WINDOW
Comparing the completion times achieved between the comparison group and the ASAP student group requires comparability in conditions between the two groups because we wish to isolate the impact of ASAP independently of other influences on completion. One criterion is overlap in terms of the timing of the comparison so that the two groups are subject to similar institutional influences and external economic conditions--that is, we want to assure that the two groups are being educated largely under the same conditions, with the only difference being that of the ASAP intervention. The second criterion is the provision of adequate time to complete an associate degree. While ASAP measures graduation success within three years and requires students to attend full time, the comparison group of students is not held to a graduation timetable or full-time enrollment requirement. At the study‟s inception, a four-year window was considered to allow comparison group students more time to complete their degrees. Analysis of enrollment and graduation data, however, revealed that there was a sizable decline in retention of comparison group students after one year and a negligible difference in additional degrees earned after four years (see appendix). For the purposes of this analysis, we will therefore utilize a three-year time period. Accordingly, we chose the initial fall 2007 ASAP cohort for evaluation over the three-year period 2007-2010.
For the comparison group we chose the 2006-2009 comparison group, a group that has been used in all previous ASAP evaluation analyses. The ASAP group comprises 1,132 students, and the comparison group consists of 1,791 students.
Some academic majors are viewed as being more demanding than others and may result in more time needed to complete the associate degree. One example is that of nursing and most allied health majors, not included in ASAP because they require prerequisites and also may take more time to complete due to their clinical requirements. Accordingly, we needed to make sure that the majors in both the ASAP and comparison groups were relatively similar, a challenge since each college has its own offerings and distribution of majors. The largest majors for ASAP were liberal arts and business,5 also representing the largest majors in the comparison group. Nursing and most allied health majors were not included in the ASAP group, and also were not included in the costing exercise for the comparison group.
The ASAP and comparison groups for this analysis were limited to students who were deemed fully skills proficient in fall 2007 for the ASAP group or fall 2006 for the comparison group. Fully skills proficient is defined as meeting CUNY college-readiness standards in reading, writing, and mathematics.6 This meant that these students met CUNYrequirements for placement in credit-bearing courses at their community colleges. Although some members of both groups had taken developmental education courses previously, we have not included those costs for either ASAP or the comparison group because developmental needs were addressed prior to the time period for this cost analysis.7 Thus, the cost comparison is limited to the period in which students were enrolled in college credit classes required to earn an associate degree.
COST PER ASSOCIATE DEGREE COMPLETION
8Before undertaking the cost analysis, it is useful to provide some detail on ASAP funding and its deployment. ASAP funding allocations follow the design and intent of the program to a remarkable degree. The overall allocation was $6.5 million per year through FY10, which increased to $6.8 million in FY11 with additional funds provided by the New York City Center for Economic Opportunity (CEO) to include an evening/weekend ASAP program at BMCC. Of this amount, most goes to the high
5 See the list of ASAP majors in Linderman & Kolenovic (2012), p. 49. 6
Since 2009 this requirement has been waived for ASAP students, but developmental education requirements must be satisfied in the early stages of the program.
7 A total of 319 students, or 28% of the fall 2007 ASAP cohort, had developmental need at the time of
application and took required courses in summer 2007 in order to join the program.
8 All data in the following comparisons were obtained from CUNY. ASAP cost data were obtained from
the CUNY ASAP Central Office; CUNY FTE cost data were obtained from the CUNY University Budget Office.
personnel demands required for faculty support, advisement, academic assistance, and career preparation. Including fringe benefits, more than 70 percent of the ASAP budget in 2008, about $4.6 million, was allocated to these personnel functions. Faculty replacement funds of $1.4 million defrayed instructional costs associated with the provision of block schedules in the first year, the reserving of seats by major in other years, planning time, and other faculty services. Advisors accounted for about $ 1 million and academic support service personnel for about $ 727 thousand, all including fringe benefits. Of the remaining allocation, two-thirds was comprised of the transportation Metrocards ($664 thousand) and textbooks ($609 thousand). The mapping of the funding and service provision is closely aligned.
In the following analysis the main measure of effectiveness is completion of the associate degree. Clearly this understates the full effectiveness of both the regular community college and ASAP programs since there are benefits of course completion even for students who do not complete the associate degree, but complete at least a significant portion of the requirements (Kane & Rouse 1995; Attewell & Lavin 2007). Using the associate degree as the measure of effectiveness will be an understatement of the benefits to both the students and society of community college education investment. In a subsequent report we will consider this issue more fully.
Given that the main goal of ASAP is to accelerate the completion and increase the number of associate degrees, we can compare the effectiveness of the standard community college program with that of ASAP. Presumably the careful design and implementation of ASAP will have a positive effect on the proportion of its students who complete the associate degree in three years relative to similar students not receiving ASAP services. This will be the measure of relative effectiveness.
But ASAP requires added services and resources which raise the cost per ASAP student beyond that of students in the regular community college program. This means that we have to compare not only the relative effectiveness of ASAP with that of the regular program, but also the relative costs. The cost-effectiveness of ASAP depends upon whether it has a higher rate of completion of associate degrees in the defined period of analysis relative to its higher costs. For example, if the cost of ASAP is 20 percent greater per graduate, but the additional yield of completed associate degrees is 20 percent or less, there would be no cost-effectiveness advantage. But, if the cost of ASAP adds 20 percent to the cost of the program per graduate, and the yield of completed associate degrees is at least 20 percent greater than the regular program, ASAP is more cost effective because it costs less than the regular program for each additional degree produced. If by adding the ASAP services to the regular program the yield rises at a greater rate than the additional costs, then this means that the combined program has a
lower cost per completed degree (effectiveness), and the cost-effectiveness of providing ASAP is greater than the regular program alone.
In order to compare the progress of similar students in programs without ASAP resources and those with ASAP, a comparison group was matched based on the program selection criteria for the ASAP group. As is often the case in this type of study, the program group (ASAP) and the comparison group were not perfectly equivalent from a statistical perspective in terms of demographics.9 In particular, the ASAP students were younger and had higher family incomes (Linderman & Kolenovic 2012: 23). Proportional distribution of the two groups across the six community colleges also differed. Accordingly, statistical adjustments were made to more nearly approximate comparability of the two groups. This was done initially through co-variate adjustments and in a second round of analysis using two types of propensity score matching in consultation with Metis Associates, external evaluators for the New York City Center for Economic Opportunity (CEO). Both of these methods are designed to compensate for differences in outcomes that are due to differences in sample selection and to gain statistical equivalence between groups (Murnane and Willett 2011). As mentioned previously, CUNY is also engaged in an experimental study by MDRC that is evaluating the impact of random assignment of students between ASAP and the conventional community college program.
9 See Linderman & Kolenovic (2012), p. 50.
ASSOCIATE DEGREE COMPLETION IN THREE YEARS
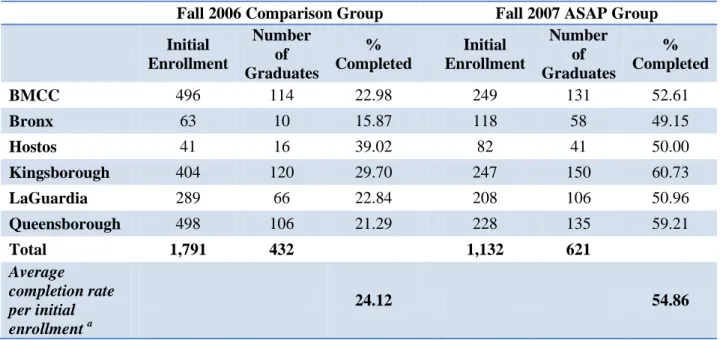
Table 1: Associate Degree Completion in Three YearsFall 2006 Comparison Group Fall 2007 ASAP Group
Initial Enrollment Number of Graduates % Completed Initial Enrollment Number of Graduates % Completed BMCC 496 114 22.98 249 131 52.61 Bronx 63 10 15.87 118 58 49.15 Hostos 41 16 39.02 82 41 50.00 Kingsborough 404 120 29.70 247 150 60.73 LaGuardia 289 66 22.84 208 106 50.96 Queensborough 498 106 21.29 228 135 59.21 Total 1,791 432 1,132 621 Average completion rate per initial enrollment a 24.12 54.86
a. Average completion rate weighted by number of students per college.
Table 1 displays the associate degree completion rates for the comparison group and ASAP group over three years for each of the six community colleges. The comparison group completion rate varies from about 16 percent at Bronx Community College to 39 percent at Hostos. The average completion rate for the comparison group for its initial enrollment was about 24 percent. BMCC, Kingsborough, and Queensborough each had about ten times as many students in the comparison group as did Hostos, so these differences were taken into account when calculating the overall average completion rate.
In contrast with the comparison group, the ASAP group shows a much higher completion rate, of almost 55 percent. Rates of completion vary from about 53 percent for BMCC to about 61 percent for Kingsborough. Overall, the graduation rates for the ASAP students are more than double those of the comparison group. Every individual college also shows a large increase for the ASAP group relative to the comparison group, a remarkably consistent finding. In the case of three colleges, the ASAP rate is about triple the comparison group rate of completion.
THREE-YEAR COST PER FTE
Table 2: Three-year Cost per FTEFall 2006 ASAP Comparison
Group Fall 2007 ASAP Group
ASAP Supplement ASAP Totala
BMCC $27,272 $19,443 $46,715 Bronx $35,678 $21,259 $56,937 Hostos $46,170 $23,573 $69,743 Kingsborough $27,441 $20,341 $47,782 LaGuardia $29,715 $19,108 $48,823 Queensborough $31,185 $18,306 $49,491 Average per FTEb $29,521 $19,837 $49,358
Average per year $9,840 $6,612 $16,452
a. ASAP total is calculated as the sum of the Comparison and ASAP Supplement costs, per site and for each of the average costs.
b. Average per FTE: calculated using the weighted cost per FTE, using the number of students in each college and group as the corresponding weights.
Table 2 shows the three-year cost per FTE for both the comparison group and the ASAP group. The comparison group includes only the three years of “regular” costs for community college full-time participation; the ASAP group includes the regular three years of CUNY FTE funding plus the ASAP supplement, which is provided for three years.
In summary, Table 2 shows the separate three-year costs for each group as well as the combined costs for the ASAP students. The average cost per FTE is listed for each college. The differences among colleges for the comparison group are substantial, varying from about $ 27,000 per FTE for BMCC and Kingsborough to more than $46,000 for Hostos. It should be noted that Hostos had a much higher completion rate than other colleges for its comparison group so that the higher cost for its non-ASAP students may also account for its higher success rate. The average cost per FTE for all colleges is shown, adjusted by the numbers of students participating at each college. The average cost per student FTE is about $29,500 in the weighted comparison group for an average over the three years of about $ 9,800 per year.
For the ASAP group, there is a cost supplement of almost $20,000 which creates a total cost per college-weighted FTE for the ASAP group of about $50,000. The supplement is provided for three years, so it averages about $6,600 for each of those
years based upon a full-time enrollee over that period. The variability in ASAP supplement costs among colleges is relatively smaller than the variability in the non-ASAP costs.
CALCULATING THREE-YEAR COST PER COHORT
If each student who initially enrolled in the ASAP or comparison cohort participated on a full-time basis, it would only be necessary to multiply the number of enrollees by the cost per year for a given number of years to obtain the total costs. However, students may drop out, go part-time, complete the associate degree in less than three years, or transfer to another institution. Although ASAP students are expected to enroll full-time, they may leave the program or take a leave and then return. As a result, over the three-year period for each group we would expect to see a reduction in the number of full-time equivalent students (FTE) enrolled. Of course, it should be noted that such reductions can have negative consequences if they are due to dropouts, or positive ones if students have completed their associate degrees or transferred to another program. Therefore, without knowing the cause, reductions in FTE credits from each group cannot be considered intrinsically as positive or negative.
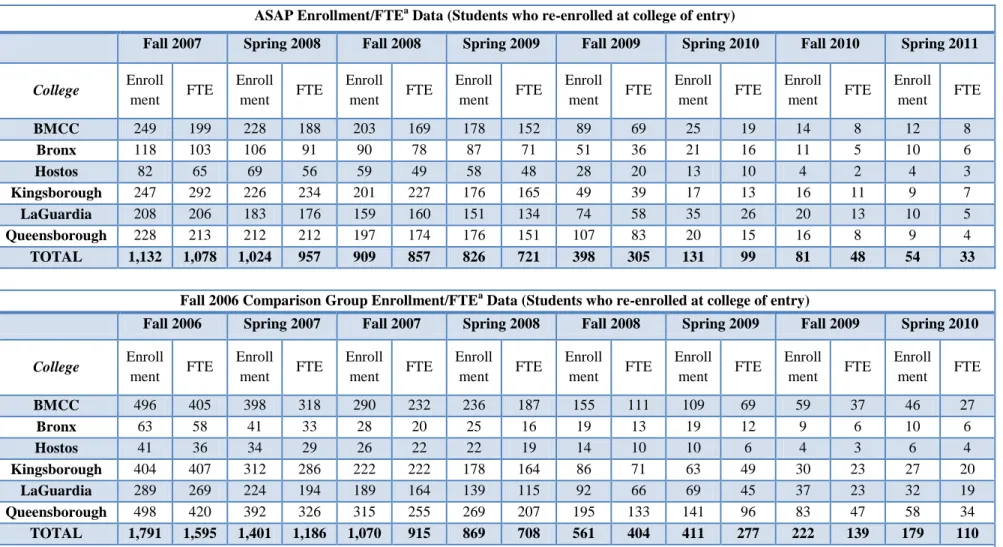
Table 3 shows the pattern of enrollments and FTE credits by college for both the ASAP group and the comparison group over eight semesters. The patterns differ dramatically. For the comparison group the reduction in FTE credits and enrollments occurred far more rapidly than for the ASAP group. This can be seen more clearly in Table 4 where the FTE students for each semester are expressed as a proportion of the initial FTE students in the first semester. Just one year after beginning the program (third semester), FTE‟s for the comparison group fell by more than 40 percent in comparison with a fall of 21 percent in the ASAP group.
Table 3: Enrollment and FTEs for ASAP and Comparison Groups
ASAP Enrollment/FTEa Data (Students who re-enrolled at college of entry)
Fall 2007 Spring 2008 Fall 2008 Spring 2009 Fall 2009 Spring 2010 Fall 2010 Spring 2011
College Enroll ment FTE Enroll ment FTE Enroll ment FTE Enroll ment FTE Enroll ment FTE Enroll ment FTE Enroll ment FTE Enroll ment FTE BMCC 249 199 228 188 203 169 178 152 89 69 25 19 14 8 12 8 Bronx 118 103 106 91 90 78 87 71 51 36 21 16 11 5 10 6 Hostos 82 65 69 56 59 49 58 48 28 20 13 10 4 2 4 3 Kingsborough 247 292 226 234 201 227 176 165 49 39 17 13 16 11 9 7 LaGuardia 208 206 183 176 159 160 151 134 74 58 35 26 20 13 10 5 Queensborough 228 213 212 212 197 174 176 151 107 83 20 15 16 8 9 4 TOTAL 1,132 1,078 1,024 957 909 857 826 721 398 305 131 99 81 48 54 33
Fall 2006 Comparison Group Enrollment/FTEa Data (Students who re-enrolled at college of entry)
Fall 2006 Spring 2007 Fall 2007 Spring 2008 Fall 2008 Spring 2009 Fall 2009 Spring 2010
College Enroll ment FTE Enroll ment FTE Enroll ment FTE Enroll ment FTE Enroll ment FTE Enroll ment FTE Enroll ment FTE Enroll ment FTE BMCC 496 405 398 318 290 232 236 187 155 111 109 69 59 37 46 27 Bronx 63 58 41 33 28 20 25 16 19 13 19 12 9 6 10 6 Hostos 41 36 34 29 26 22 22 19 14 10 10 6 4 3 6 4 Kingsborough 404 407 312 286 222 222 178 164 86 71 63 49 30 23 27 20 LaGuardia 289 269 224 194 189 164 139 115 92 66 69 45 37 23 32 19 Queensborough 498 420 392 326 315 255 269 207 195 133 141 96 83 47 58 34 TOTAL 1,791 1,595 1,401 1,186 1,070 915 869 708 561 404 411 277 222 139 179 110
a. FTE (full-time equivalent) data taken directly from CUNY‟s Institutional Research Database. The Office of Institutional Research and Assessment calculates FTE data based on an enrollment of 15 credits per semester.
Table 4: FTE per Semester as a Proportion of FTEs in the First Semester
Fall 2007 ASAP Group
College Fall 2007 Spring 2008 Fall 2008 Spring 2009 Fall 2009 Spring 2010 Fall 2010 Spring 2011 BMCC 100 94.5 84.9 76.4 34.7 9.4 3.9 4.3 Bronx 100 88.3 75.7 68.9 35.0 15.3 5.1 5.8 Hostos 100 86.2 75.4 73.8 30.8 15.0 3.4 4.8 Kingsborough 100 80.1 77.7 56.5 13.4 4.4 3.8 2.4 LaGuardia 100 85.4 77.7 65.0 28.2 12.7 6.5 2.4 Queensborough 100 99.5 81.7 70.9 39.0 7.0 3.8 1.8 TOTAL 100 88.8 79.5 66.9 28.3 9.2 4.5 3.1
Fall 2006 Comparison Group
College Fall 2006 Spring 2007 Fall 2007 Spring 2008 Fall 2008 Spring 2009 Fall 2009 Spring 2010 BMCC 100 78.5 57.3 46.2 27.4 17.0 9.1 6.7 Bronx 100 56.9 34.5 27.6 22.4 20.7 10.3 10.3 Hostos 100 80.6 61.1 52.8 27.8 16.7 8.3 11.1 Kingsborough 100 70.3 54.5 40.3 17.4 12.0 5.7 4.9 LaGuardia 100 72.1 61.0 42.8 24.5 16.7 8.6 7.1 Queensborough 100 77.6 60.7 49.3 31.7 22.9 11.2 8.1 TOTAL 100 74.4 57.4 44.4 25.3 17.4 8.7 6.9
The comparison group exhibited a much larger decline in FTEs during the first two years (with a particularly large reduction for Bronx Community College). Eighteen months after enrolling, in the spring semester of the second year, the FTE credits taken by the comparison group were less than 45 percent of those taken during the first semester. In contrast, the continuing members of the ASAP group were still registered for two-thirds of their initial FTE credits in that semester. Further, the ASAP group retained about 73 percent of its enrollees in the fourth semester, compared to less than half for the comparison group.
It is not surprising to see the large drop in FTEs at the beginning of the third year for both groups, as many associate degrees are completed for full-time enrollees in two years.10 But, the majority of the reductions in FTEs occurred earlier and more precipitously in the comparison group, well before attainment of any associate degrees. To the extent that students facing the most serious obstacles are those who drop out early, this finding implies that the ASAP program succeeded at retaining more of the students with serious challenges who might otherwise have reduced or terminated their studies in its absence. That is, the ASAP program not only retained more students, but more of the students with educational disadvantages.
10 The two-year graduation rate was 30.1% for the fall 2007 ASAP group vs. 11.4% for the comparison
The basic method for estimating the cost per student in the two programs was to calculate the overall number of FTEs undertaken by each group over three years and to multiply that by the cost per FTE for each institution shown in Table 2. For the ASAP group, we added the additional cost of the ASAP program to the basic FTE cost per institution. This procedure provided a total cost for the ASAP cohort and a total cost for the comparison cohort, as shown in Table 5.
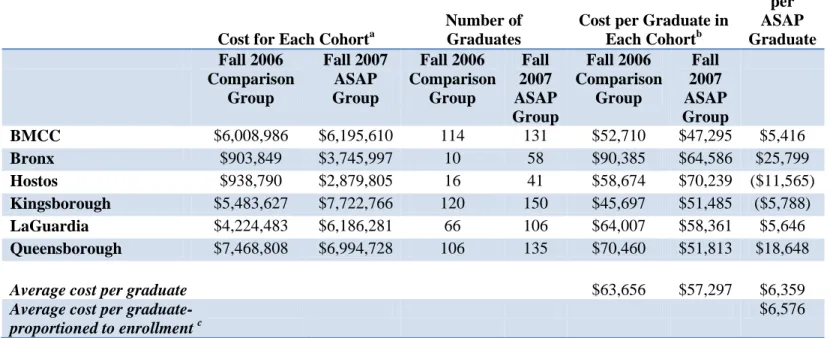
Table 5: Cost per Cohort (all FTEs) and per Graduate: Over Three Years
Cost for Each Cohorta
Number of Graduates
Cost per Graduate in
Each Cohortb Cost Saving per ASAP Graduate Fall 2006 Comparison Group Fall 2007 ASAP Group Fall 2006 Comparison Group Fall 2007 ASAP Group Fall 2006 Comparison Group Fall 2007 ASAP Group BMCC $6,008,986 $6,195,610 114 131 $52,710 $47,295 $5,416 Bronx $903,849 $3,745,997 10 58 $90,385 $64,586 $25,799 Hostos $938,790 $2,879,805 16 41 $58,674 $70,239 ($11,565) Kingsborough $5,483,627 $7,722,766 120 150 $45,697 $51,485 ($5,788) LaGuardia $4,224,483 $6,186,281 66 106 $64,007 $58,361 $5,646 Queensborough $7,468,808 $6,994,728 106 135 $70,460 $51,813 $18,648
Average cost per graduate $63,656 $57,297 $6,359
Average cost per graduate- proportioned to enrollment c
$6,576 a. Using average cost per FTE per semester and number of FTE per semester.
b. Cost per cohort divided by number of graduates.
c. Enrollment trends: Fall 2010, City University of New York.
The first column in Table 5 shows the total cost for each cohort by college for the ASAP group and the comparison group. The second column shows the number of associate degree graduates for each group. The third column shows the cost per graduate for each cohort. The last column displays the cost savings per graduate. Among institutions we observe a mixed pattern. For BMCC, Bronx, LaGuardia, and Queensborough, there were cost savings per graduate; for Hostos and Kingsborough, the comparison group had a lower cost per graduate. The overall impact among all of the institutions was a saving of about $6,400 per graduate for the ASAP cohort relative to the comparison group. That is, if we compare the average cost per graduate among all of the community colleges, there was a saving of this amount for each graduate in the ASAP group relative to the costs per graduate in the comparison group.
However, there was considerable variance among institutions. It should be noted that Hostos spent considerably more for each FTE in the comparison group than did other
institutions (Tables 1 and 2). Also, Hostos had relatively few students in ASAP, and expansion of the program could result in economies of scale for ASAP that would be likely to reduce costs.11
The overall savings per graduate are almost $6,500, and only two of the institutions show higher costs per degree for their ASAP group than for their comparison group, including Hostos with its very low ASAP enrollments.12 The overall savings shown in Tables 5 are based upon the specific numbers of ASAP students in each institution participating in the ASAP group. If these students were distributed in proportion to the overall enrollments of each institution as we might expect in a system expansion of ASAP, the savings would be about $6,600 per graduate in a three-year comparison.
Since the ASAP cohort produced more than twice as high a graduation rate as the comparison group, and the cost per FTE for the ASAP supplement is only about 50 percent more per ASAP FTE, one might expect cost savings to be even greater. This puzzle is largely resolved when we consider the fact that the comparison group experienced much larger losses of enrollment and FTE credits early in the three -year comparison. This meant that the costs of the conventional program for the comparison group also dropped precipitously, as our method is based on cost per FTE. With the reduction of FTE, especially from the early reductions and enrollment withdrawals, the costs per member of the comparison group declined considerably over time relative to the costs of the ASAP group that was maintaining greater persistence with higher relative FTEs and enrollments.
One interpretation of this phenomenon is that students who were highly unlikely to succeed from the comparison group were more likely to withdraw or reduce participation after brief exposure to community college. This has become well-known in the community college research literature as the “cooling out” function (Clark 1960; Karabel 1972). Traditionally, students in the community colleges facing academic and other obstacles perceive quickly that they are unlikely to complete their studies and drop out rather quickly. This phenomenon also reduces institutional costs and retains only the most promising students who make fewer demands on the college. ASAP is devoted to meeting the needs of these groups with additional resources, and their higher continuation rates raise the cost per student, but also provide much higher completion rates.
11 This assumes that fixed costs such as the director, and ASAP requirements for personnel/FTE ratios are
underutilized with such small ASAP enrollments at Hostos. Hostos has an enrollment of only about 5,000 FTE in comparison with BMCC with almost 19,000 and LaGuardia and Queensborough in the 14,000 FTE range.
OTHER COST CONSIDERATIONS
Without question ASAP has shown that it provides an investment that not only raises the number of completed associate degrees, but also reduces the cost per degree, on average, because its proportionately added effectiveness in degree production exceeds the added costs. If CUNY plans to expand the number of students who graduate within three years through an ASAP expansion, the added cost of ASAP services is more than compensated for by a higher production of degrees. The larger investment will result in a lower cost per degree and large aggregated savings of degree production for CUNY community colleges. There are also opportunities to further reduce costs through expansion by benefiting from economies of scale as the fixed costs of ASAP at each institution are divided over more students, and by seeking ways to improve the performance of all colleges in using ASAP to increase graduates. What is also noteworthy is the likelihood that ASAP is more likely to succeed with less advantaged students rather than experiencing a high proportion of “cool outs” from this group.
Although we have referred to cost-effectiveness of ASAP only in terms of its greater student success in producing associate degrees within three years, it is important to note that even those who succeed in taking some college probably receive considerable benefits. For example, the advising provides guidance for challenges beyond school such as time management, problem-solving, and decision-making. The program also provides tutoring assistance, which should enhance understanding of subjects beyond the minimum needed for credit as well as offering other academic benefits. Thus, even those students who do not complete the associate degree within the specified time period should benefit (Kane & Rouse 1995).
It is also important to point out that the results reported here are based upon the performance of the first cohort that entered ASAP relative to a comparison group. This means that there are opportunities to improve the future effectiveness of ASAP in two ways. First, as the community colleges gain experience with ASAP and the various approaches to overcoming obstacles to degree completion, they should discover new ways of improving performance and efficiency, such as by building in systematic training programs for ASAP and other personnel that capitalize on lessons learned from ASAP. There may also be possibilities of reducing costs by modifying or eliminating those ASAP components that are found to be under-utilized or identified as being of less value to students. Examples might include workshops, special cultural events, and block programming, which did not rank as high on annual ASAP student satisfaction surveys as financial resources, personalized advisement and career support, and condensed class schedules (Linderman & Kolenovic 2012: 44).
Finally, there is considerable evidence that improving graduation rates at any level of education has a considerable payoff to both the students and to society. Thus, the
cost of ASAP services can be compared with the private and societal benefits generated by the ASAP production of additional graduates. In this respect, ASAP should not be considered only as an added cost, but also as an investment in which there may be a considerable payoff or social return. Graduates experience higher employment and income than non-graduates, as well as greater social status and civic activity. Additional graduates also improve the competitiveness of the labor force and return the investment to the taxpayer in the form of higher tax revenues and lower costs for social services, including public health, criminal justice, and public assistance (Belfield & Levin 2007; Belfield & Bailey 2011). In a forthcoming report we will illustrate and document the returns to this investment.
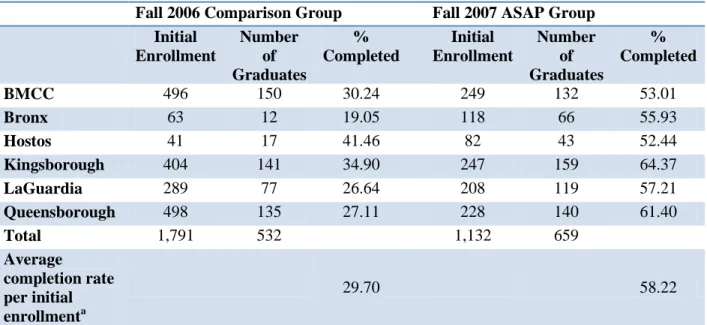
APPENDIX
Associate Degree Completion in Four Years
Table A1: Associate Degree Completion in Four Years
Fall 2006 Comparison Group Fall 2007 ASAP Group
Initial Enrollment Number of Graduates % Completed Initial Enrollment Number of Graduates % Completed BMCC 496 150 30.24 249 132 53.01 Bronx 63 12 19.05 118 66 55.93 Hostos 41 17 41.46 82 43 52.44 Kingsborough 404 141 34.90 247 159 64.37 LaGuardia 289 77 26.64 208 119 57.21 Queensborough 498 135 27.11 228 140 61.40 Total 1,791 532 1,132 659 Average completion rate per initial enrollmenta 29.70 58.22
a. Average completion rate weighted by number of students per college.
Four-Year Cost per FTE
Table A2: Four-year Cost per FTE
Fall 2006 Comparison Group Fall 2007 ASAP Group
ASAP Supplement ASAP Totala BMCC $36,363 $19,443 $55,806 Bronx $47,571 $21,259 $68,830 Hostos $61,560 $23,573 $85,133 Kingsborough $36,588 $20,341 $56,929 LaGuardia $39,620 $19,108 $58,728 Queensborough $41,580 $18,306 $59,886
Average per FTEb $39,361 $19,837 $59,198
Average per yearc $9,840 $6,612
a. ASAP total is calculated as the sum of the Comparison and ASAP Supplement costs, per college and for each of the average costs.
b. Average per FTE: calculated using the weighted cost per FTE, using the number of students in each college and group as the corresponding weights.
CALCULATING FOUR YEAR COST PER COHORT
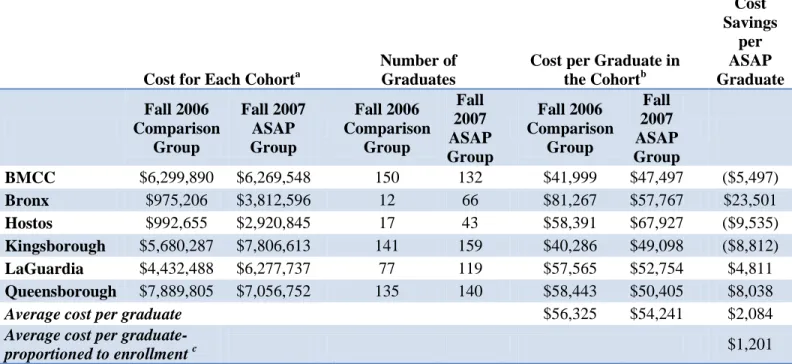
Table A3: Cost per Cohort (all FTEs) and per Graduate: Over Four Years
Cost for Each Cohorta
Number of Graduates
Cost per Graduate in
the Cohortb Cost Savings per ASAP Graduate Fall 2006 Comparison Group Fall 2007 ASAP Group Fall 2006 Comparison Group Fall 2007 ASAP Group Fall 2006 Comparison Group Fall 2007 ASAP Group BMCC $6,299,890 $6,269,548 150 132 $41,999 $47,497 ($5,497) Bronx $975,206 $3,812,596 12 66 $81,267 $57,767 $23,501 Hostos $992,655 $2,920,845 17 43 $58,391 $67,927 ($9,535) Kingsborough $5,680,287 $7,806,613 141 159 $40,286 $49,098 ($8,812) LaGuardia $4,432,488 $6,277,737 77 119 $57,565 $52,754 $4,811 Queensborough $7,889,805 $7,056,752 135 140 $58,443 $50,405 $8,038
Average cost per graduate $56,325 $54,241 $2,084
Average cost per graduate-
proportioned to enrollment c $1,201
a. Using average cost per FTE per semester and number of FTE per semester. b. Cost per cohort divided by number of graduates.
REFERENCES
Attewell, P., Lavin, D., Domina, T., & Levey, T. (2007) Passing the Torch: Does Higher
Education for the Disadvantaged Pay off Across the Generations? (New York:
Russell Sage).
Bailey, T. (2007) “Implications of Educational Inequality in a Global Economy,” In C. Belfield and H. M. Levin, eds., The Price We Pay (pp. 74-98) (Washington D.C.: Brookings Institution Press).
Baker, B. & Welner, K. G. (2012) “Evidence and Rigor: Scrutinizing the Rhetorical Embrace of Evidence-Based Decision Making,” Educational Researcher 41(3), pp. 98-101.
Belfield, C. R. & Bailey, T. (2011) “The Benefits of Attending Community College: A Review of the Evidence,” Community College Review, 39, pp. 46-68.
Belfield, C. R. & Levin, H. M. (2007) The Price We Pay: Economic and Social
Consequences of Inadequate Education (Washington, DC: The Brookings Press).
Clark, B. R. (1960) “The „Cooling-Out” Function in Higher Education,” American
Journal of Sociology, 65(6), pp. 569-576.
Edgecombe, N. “Accelerating the Academic Achievement of Students Referred to Development Education, CCRC Brief, No. 55 (New York: Community College Research Center, Teachers College, Columbia University).
http://ccrc.tc.columbia.edu/Publication.asp?UID=867.
Education Trust (2012) Replenishing Opportunity in America: The 2012
Midterm Report of Public Higher Education System in the Access to Success
Initiative (Washington, DC: The Education Trust).
Kane, T. & Rouse, C. (1995) ¨Labor Market Returns to Two & Four Year Colleges,¨
American Economic Review, 85(3), pp. 600-614.
Karabel, J. R. (1972) “Community Colleges and Social Stratification,” Harvard
Education Review, 42(4), pp. 521-562.
Levin, H. M. & McEwan, P. (2001) Cost-Effectiveness Analysis: Methods and
Applications (Thousand Oaks, CA: Sage Publications).
Levin, H. M., Catlin, D. & Elson, A. (2010) Adolescent Literacy Programs: Costs of
Implementation (New York: Carnegie Corporation of New York).
Linderman, D. and Kolenovic, Z (2009) Early Outcomes Report for City University of
New York (CUNY) Accelerated Study in Associate Programs (ASAP) (New York:
Center for Economic Opportunity).
Linderman, D. and Kolenovic, Z. (2012) Results Thus Far and the Road Ahead: A
Follow-up Report on CUNY Accelerated Study in Associate Programs (ASAP),
(New York: City University of New York).
http://www.cuny.edu/academics/programs/notable/asap/ASAP_Followup_Report _020112.pdf
Murnane, R. & Willett, J. (2011) Methods Matter (New York: Oxford University Press). Organization for Economic Cooperation and Development (2011) Education at a
Glance (Paris, OECD).
Rini, A. L. (2011) The Contribution of Student Success Programs on Community College Student Persistence and Graduation Rates: A Case Study of the Benefits and Costs of the Accelerated Study in Association Programs (ASAP) at the City
University of New York, Unpublished Ed.D. dissertation (Philadelphia: University
of Pennsylvania).
Schneider, M. & Yin, L. M. (2012) Completion Matters: the high cost of low community
college graduation rates (Washington, DC: American Enterprise Institute).
http://www.aei.org/outlook/education/higher-education/community- colleges/completion-matters-the-high-cost-of-community-college-graduation-rates/
Snyder, T. A. & Dillow, S. A. (2011) Digest of Education Statistics, 2010, NCES 2011- 015 (Washington, DC: National Center for Education Statistics, U.S. Department of Education), Table 341.