N E W S L E T T E R
VISUAL ENVIRONMENT WITH HIGH
RESOLUTION TILED DISPLAY AND
PC RENDERING CLUSTER
Dinesh M. Sarode, S.K. Bose, P.P.K. Venkata Soumen Dey and P.S. Dhekne,
Computer Division
Introduction
Today we can have huge datasets resulting from computer simulations (CFD, physics, chemistry, etc) and sensor measurements (medical, seismic and satellite). There is an exponential growth in computational requirements in scientific research. Modern parallel computers are providing the required computational power for the simulation runs and efficient visualization is essential in interpreting the large, dynamic data generated from these simulation runs. The visualization process maps these data sets on to graphical representations and then generates the pixel representation. The large number of pixels show the picture in greater detail and interaction with it enables greater insight on the part of user in understanding the data and picking out small anomalies that could turn out to be critical. However, the memory constraints, lack of the rendering power and the display resolution offered by even the most powerful graphics workstation make the visualization of this magnitude difficult or impossible. All over the world, tightly coupled multi processor multi pipe graphics supercomputers are used for large-scale data visualization. The number of graphics accelerator cards that can fit in the system and the high cost involved are the limitations of this approach.
No. 248 September 2004
C o n t e n t s
1. Visual environment with high resolution tiled display and PC rendering cluster…… 1 2. Development of advanced
alarm annunciation system for nuclear reactors………… 9
3. Optical technique for high speed measurement………. 13 4. BARC transfers technology
of "Lascan Dia Gauge"…… 17 5. National workshop on radiochemistry and applications of radioisotopes……… 18 6. Safety training programme at BARC facilities at Kalpakkam……… 20 7. National Symposium on Environment (NSE-13)……. 20 8. Nuclear and Radiochemistry Symposium (NUCAR 2005)……… 22 9. Workshop on minimisation
of radioactive solid waste.… 22
10. ž¸¸.œ¸.‚. ˆ½¿ÅÍ ˆ½Å ¨¸¾±¸¸¹›¸ˆÅ¸½¿ ˆÅ¸½ ¬¸ŸŸ¸¸›¸ / BARC scientists honoured……… 23
While the cost-performance ratio for the component based on semiconductor technology doubles in every 18 months, or beyond that for graphics accelerator cards, the display resolution is lagging far behind. The resolutions of the displays have been increasing at an annual rate of 5% for the last two decades. The ability to scale the components of computing CPU, memory, graphics accelerator and displays by combining them is the most cost-effective way to meet the ever-increasing demand for computational power, rendering rate and high resolution. The high resolution tiled display and rendering cluster initiative at Computer Division, BARC, explore means to build and use a scalable display system by tiling multiple LCD displays driven by the Linux-based PC graphics-rendering cluster. Off-the-shelf components such as PCs, PC graphics accelerators, network components and LCD displays are used. This article focuses on building such a system that can render and drive over 20 million pixels, using the open source software framework that allows running existing graphics (OpenGL) as well as non-graphics (X11) applications at interactive speed. Tiled display-aware applications requiring higher intrinsic display resolution and more display space have been developed.
System Architecture
In our architecture, a display is constructed by tiling the LCD displays. A single workstation drives a single display; software environment controls the rendering of the portion of the graphics apportioned to that display. A separate workstation of the cluster is used to control the entire tiled display.
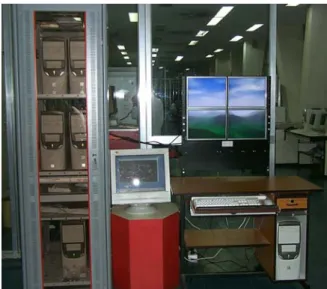
In March 2003, we designed the first 4-tile LCD display system that provides a display resolution of 2048 x 1536 (3.1 million) pixels. Each tile is 15″ ViewSonic display with maximum resolution of 1024x768. A PC Linux cluster of five workstations running Red Hat 7.2 is used to drive the display system. The workstations are Intel P-IV 1.7 Ghz processor, 256 MB RDRAM and
3Dlabs GVX1 pro AGP graphics accelerator cards. Communication between them is handled over the Fast Ethernet. The display is constructed from 2 x 2 LCD displays. A picture of the cluster and display system is shown in Fig. 1.
In September 2003, we scaled the display by constructing 16-tiles from 4 x 4 17″ ViewSonic LCD display and cluster of 17 (16+1) workstations running Red Hat 7.2. Fig. 2 shows the current high-resolution display system. The resolution of our new system is 5120x4096 (20 million) pixels. In our scaling efforts, we used two commodity interconnects: Gigabit Ethernet for graphics related communication and Fast Ethernet for file sharing etc.
The commodity projectors can also be used for seamless tiled display. The projectors are costly as compared to LCD monitors and they are hard
Fig.1: 2x2 Tiled display system
to align. The brightness, color coordination, balance and edge blending also need to be addressed. Because of these issues, we decided to use LCD monitors for tiled display. However, the borders of the LCD displays (seams) provide a grid-like pattern etched through the logical display, in which nothing can be displayed. The seams introduce issues while visualizing the data. Our software environment treats the borders as if represented by hidden pixels, thereby creating the “panned window” effect.
Software Environment for Tiled Display
Moving the visualization applications to PC rendering cluster and tiled display makes software environment much more complex than the traditional shared memory multi-processor multi-pipe systems. In these systems the application data uses the shared memory, enabling the graphics and computations to easily access data and process it. In the PC rendering cluster, since there is no single place to share the data, the programmer must know the cluster configuration and provide ways to effectively share data through interconnecting network Finally, the tiled display environment must fulfill three functional requirements: genlock, swaplock and datalock. Genlock synchronizes the video frames from each node of the cluster so that final image presented is coherent image. It is critical for active stereo on tiled display. Each graphics card in a cluster renders different number of polygons resulting in different rendering times for each frame. Swaplock ensures that the frame buffers swaps are synchronized. Datalock further ensures the synchronization of the views to maintain consistency across the tiles. We have not used any explicit genlock for tiled display whereas swaplock and datalock have been implemented in the software.
The basic two approaches for software architecture for PC rendering cluster and tiled display are: Client/Server and Synchronized
program execution. In the Client/Server, single
instance of the application (client) serves data to the graphics rendering servers. This is usually transparent because the program can be implemented as if it runs on a single node. The software system will handle the necessary changes for running the program on PC cluster. The disadvantage is higher consumption of network bandwidth. With the Synchronized
program execution approach, multiple instances
of the applications execute on the cluster nodes. The execution of the application on all nodes must be synchronized to insure consistency among all application instances. Typically, the master node handles all user interaction and synchronizes state changes between the slaves. The advantage is the less consumption of network bandwidth.
With aim to support existing applications along with available open source software for running them on the tiled display, we selected Chromium and DMX software environment. These software environment implements Client/Server approach. Chromium is used for running OpenGL based graphics applications while non-graphics applications (X) use DMX (Distributed Multihead X).
Distributed Rendering
The rendering pipeline consists of three conceptual stages: geometry database (graphics primitives), geometry processing (transformation, clipping, lighting etc) and rasterization (scan-conversion, shading and visibility). The graphics accelerator cards of the cluster provide multiple rendering pipelines. The decision to split up and recombine the rendering workload can happen before or after either of the geometry processing or rasterization stage. Thus we can have
sort-first, sort-middle, and sort-last architectures for
distributed rendering.
The sort-first architecture distributes the graphics primitives early in the rendering pipeline (geometry processing) to the rendering node that
can do the remaining work. This is achieved by dividing the display into disjoint regions and making rendering nodes responsible for all rendering calculations that affect their respective screen regions. The screen-space bounding box of the primitive determines the regions into which it falls. The primitives are then distributed over an interconnect network to the appropriate rendering nodes. In sort-middle, primitives are distributed arbitrarily to geometry processing units and then screen space primitives are redistributed in the middle of the rendering pipeline to the appropriate rasterizer responsible for a portion of the display screen. The sort-last architecture assigns arbitrary subsets of the primitives to the rendering nodes which rasterize into pixels values no matter where they fall in the screen. The rendering nodes then transmit these pixels over an interconnect network to compositing nodes which resolve the visibility of the pixels according to the alpha or Z-buffer entries of the pixels. In short, the partial images are rendered in parallel and in the end combined according to their Z-buffer values.
The main advantages of sort-first architecture are relatively less communication requirements; it can deal well with both large number of primitives and large number of pixels. The disadvantages are extra work for finding primitive-tile overlap for each frame, limited scalability and load imbalance. The sort-last approach is scalable but requires an image composition network with very high bandwidth. The desired resolution and quality of the output image also directly affects the communication bandwidth. The sort-middle approach is very difficult in a cluster-of-PCs system; we can not break the rendering pipeline as it is implemented in hardware. We selected the sort-first approach for high-resolution graphics system.
Chromium
Chromium is a flexible framework for distributed-rendering on cluster of computers, initiated at
Stanford University and supported by the Lawrence Livermore, Sandia, and Los Alamos National Labs and IBM Research. It provides a generic and extensible mechanism for manipulating streams of OpenGL (industry standard graphics) API commands. Hence, existing applications can take advantage of the rendering capability of a cluster, without modifying, or even recompiling the source code.
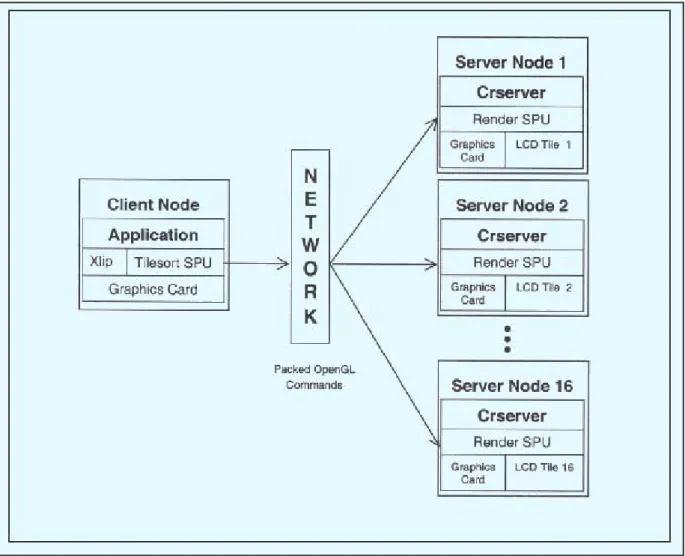
Chromium implements sort-first, sort-last and hybrid algorithms to distribute the rendering of polygonal geometry across the cluster. It works by replacing the native OpenGL library with its own. It directly operates on the stream of the OpenGL graphics commands issued by the application. It provides Stream Processing Units (SPU). Each SPU has its input-streams of graphics commands, performs some operation on these commands and passes them on. SPUs can be chained to perform combined operations. The SPUs for tiled rendering are tilesort, render and pack. Tilesort SPU implements the sort-first algorithm. The tilesort SPU sorts the OpenGL commands into tiles so that they are packed and sent over a network to the nodes handling the tiles. Render SPU passes the stream to the node’s local OpenGL implementation. Pack SPU packs the stream into a buffer for transmission to cluster servers.
A python script called mothership controls running programs through Chromium. It contains the tile layout, SPU chains and nodes used for running the application. The mothership runs an event loop waiting for communication from the
crappfakers and crservers. The crappfaker will
run the OpenGL program and relink it against the defined SPU libraries. The crserver is used for tiled rendering and any SPU that requires network access for data transmission. Crserver sits on a socket and waits for packed OpenGL commands. Fig. 3 shows the sort-first configuration used by our PC cluster.
Fig. 3: Sort-first configuration
DMX (Distributed Multihead X)
DMX is an open source framework, distributing X Window sessions across the nodes of a tiled display such that the X display/desktop can span many individual tiles. It is used to run any program that runs under X Windows on the tiled display. The program can use the entire display space and resolution offered by the tiled display. It works by providing a front-end X server acting as a proxy to a number of back-end X servers running on the nodes of the cluster driving tiled display. X clients will connect to front-end X server running on the control node of the tiled display. Rendering and input requests will be accepted by the front-end server and then will be
Applications
Many application domains would benefit from the system. The tiled display-aware applications available for visualization, display of images and animations currently include:
CollabCAD
CollabCAD is a java based distributed 2D&3D CAD/CAM and CAE software system being developed by the Computer Aided Design Group of National Informatics Centre, New Delhi.
We have augmented the display capabilities of CollabCAD with the tiled display environment setup in BARC, which is extremely useful for visualizing huge CAD models. It provides detailed view of the individual components of the model
and as well as overall interrelationships often required for design reviews. Fig 5 shows one such model.
VTK (Visualization ToolKit)
VTK is an open source software system for 3D computer graphics and visualization. VTK supports a wide variety of visualization algorithms including scalar, vector, tensor, texture and volumetric methods. The advanced modeling techniques such as implicit modeling, polygon reduction, mesh smoothing; cutting, contouring and triangulation are also supported. We decided to use VTK for our high-end scientific applications running on the rendering cluster and presenting the high-resolution visual information on the tiled display.
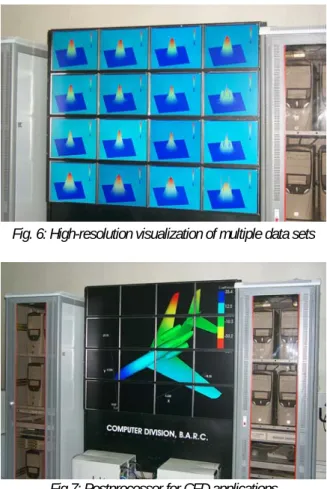
We are developing visualization applications for CFD and medical data sets. The visualization of CFD datasets is a powerful tool for problem solving, engineering design and communication of results to decision-makers. CFD visualizations with high-resolution grid will enhance the quality of the visual information. In the field of medical imaging, which is moving from films to digital images, the high-resolution visualization is an absolute need. With this new display technology, it is possible to see the very fine detail of important areas, such as a tumor in the brain, while at the same time seeing the overall context of the entire head. A number of high-resolution slices can be displayed together for analysis. Interacting with large CFD data sets in real time and providing rich and deep visual feedback is achieved only with rendering cluster and tiled display. This system also provides the cost
effective and scalable solution in visualizing the complex data sets generated by medical scanners. Interactive visualization in real time
Fig. 5: CollabCAD on tiled display
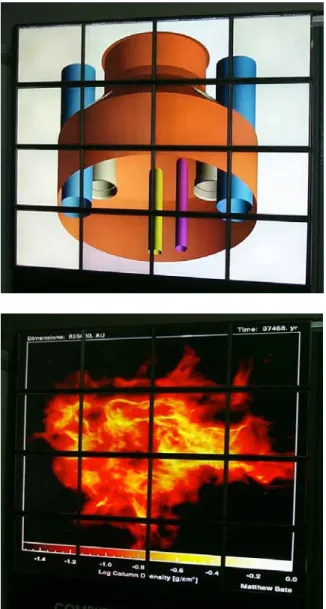
Fig. 6: High-resolution visualization of multiple data sets
Fig.7: Postprocessor for CFD applications (scalar plot)
with these datasets provides a wealth of information about internal structures, which lacks in static images.
Open source softwares like ParaView and VisIt based on VTK, specifically developed for parallel interactive visualization of large data sets, are also available.
VMD
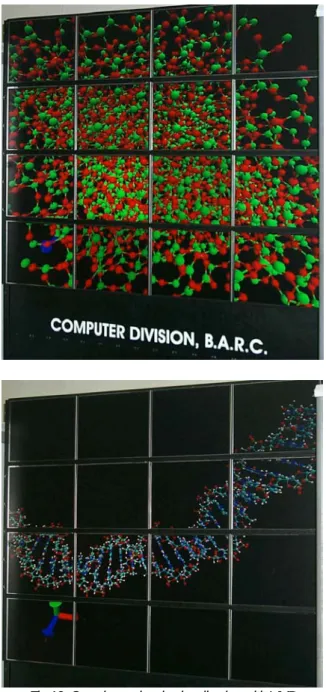
VMD is an open source molecular visualization program for displaying, animating, and analyzing large biomolecular systems.
It is used with our tiled display for high-resolution visualization of complex molecule structures.
Tiled MPEG/AVI movie player
The MPEG/AVI movie is a powerful way of visualizing complex data. The tiled movie player developed by Computer Division, BARC, plays the MPEG/AVI movie at the native resolution of the tiled display. It is an MPI (Message Passing Interface) application where the master reads the MPEG/AVI file, decodes it and divides the frame into tiles. Tiles are sent to the slave running on nodes of the tiled display, which uses interpolation for mapping it to the entire display resolution. The frames of the movie are rendered using OpenGL texture functionality.
Fig.10: Complex molecule visualization with VMD on tiled display
Fig. 8: Volume rendering (isosurfaces)
Tiled Image Viewer
It is useful for viewing high-resolution images. The typical display does not have sufficient resolution, requiring scrolling or image shrinking which results in loss of context and lack of details.
Conclusion
The PC rendering cluster and high-resolution tiled display is a reasonable alternative to high-end multiprocessor, multipipe systems. The advantages are low cost and technology tracking: commodity components have better price/performance ratio and improve at faster rate than proprietary hardware. The large field of view (FOV) coupled with 20 times more pixels than the standard display provides the deep and rich visual experience. We found that the approach is scalable, works well with various computing and display configurations. Many visual-intensive applications would benefit from it. The visualization power that is available now also compliments the computational power of BARC’s ANUPAM supercomputer.
References
1. "Building and Using A Scalable Display Wall System", Kai Li, Han Chen, Yuqun Chen, Douglas W. Clark, Perry Cook, Stefanos Damianakis, Georg Essl, Adam Finkelstein, Thomas Funkhouser, Timothy Housel, Allison Klein, Zhiyan Liu, Emil Praun,
Rudrajit Samanta, Ben Shedd, Jaswinder Pal Singh, George Tzanetakis, Jiannan Zheng, IEEE Computer Graphics and
Applications, July/August 2000
2. "Visualization Research with Large Displays", Bin Wei, Claudio Silva, Eleftherios Koutsofios, Shankar Krishnan and Stephen North, IEEE Computer
Graphics and Applications, July/August 2000
Fig. 13: High resolution map on tiled display
Fig.11: Movie player on Tiled Display
3. "Commodity Clusters for Immersive Projection Environments", Course Notes 47,
SIGGRAPH 2002
4. "Software Environments for Cluster-based Display Systems", Yuqun Chen, Han Chen, Douglas W. Clark, Zhiyan Liu, Grant Wallace and Kai Li., Proceedings of the 1st
International Symposium on Cluster Computing and the Grid, 2001
5. "Deep View: High-Resolution Reality", J. T. Klosowski, P. D. Kirchner, J. Valuyeva, G. Abram, C. J. Morris, R. H. Wolfe, and T. Jackman, IEEE Computer Graphics and
Applications, May/June 2002.
6. "Chromium: A Stream Processing Framework for Interactive Rendering on Clusters of Workstations", Greg Humphreys, Mike Houston, Ren Ng, Randall Frank, Sean Ahern, Peter Kirchner and James T. Klosowski, Computer Graphics, SIGGRAPH
2002 Proceedings
7. "A Sorting Classification of Parallel Rendering", S Molnar, Michael Cox, David Ellsworth and Henry Funchs, IEEE
Computer Graphics and Applications, 1994.
8. DMX Homepage http://dmx.sourceforge.net/ 9. CollabCAD Homepage http://www.collabcad.com/ 10. VTK Homepage http://public.kitware.com/VTK/ 11. ParaView Homepage http://www.paraview.org/ 12. VisIt Homepage http://www.llnl.gov/visit/ 13. VMD Homepage http://www.ks.uiuc.edu/Research/vmd
DEVELOPMENT OF ADVANCED ALARM ANNUNCIATION
SYSTEM FOR NUCLEAR REACTORS
Vikas Chauhan, Jose Joseph and R. K. Patil Reactor Control Division
Introduction
In any plant, when a process parameter goes to abnormal limit, the operator is to be alerted immediately, so that he can take corrective actions to bring the parameter back to normal. Also, when the parameter returns to normal, the operator should know it. This task of calling the operator attention in such conditions is accomplished by alarm annunciation system. This function has a very important role in the safety of nuclear reactors and hence alarm annunciation system is classified as category-IB system as per AERB guidelines.
Alarm annunciation systems have been available around in the industry for quite some time. But systems available in the industry generally do not provide enough self-diagnostic and fault tolerant capabilities required for the purpose of a nuclear reactor. Moreover, it is extremely difficult to qualify these commercially available systems. Hence, Reactor Control Division took up the task of developing an advanced alarm annunciation system.
The requirements were finalised after studying the existing systems, inputs from plant personnel, latest industry trends and methodologies to qualify for category-IB